from plotnine import (
ggplot,
aes,
geom_area,
geom_line,
scale_x_date,
scale_y_continuous,
theme_linedraw,
theme_set,
)
from plotnine.data import economics
# Set default theme
theme_set(theme_linedraw())
Area plot
geom_area(
    mapping=None,
    data=None,
    *,
    stat="identity",
    position="stack",
    na_rm=False,
    inherit_aes=True,
    show_legend=None,
    raster=False,
    outline_type="upper",
    **kwargs
)
An area plot is a special case of geom_ribbon, where the minimum of the range is fixed to 0, and the position adjustment defaults to ‘stack’.
Parameters
mapping : aes = None-
Aesthetic mappings created with aes. If specified and
inherit_aes=True, it is combined with the default mapping for the plot. You must supply mapping if there is no plot mapping.Aesthetic Default value x y alpha 1color 'none'fill '#333333'group linetype 'solid'size 0.5where TrueThe bold aesthetics are required.
Aesthetics Descriptions
where-
Define where to exclude horizontal regions from being filled. Regions between any two
Falsevalues are skipped. For sensible demarcation the value used in the where predicate expression should match theyminvalue or expression. i.e.aes(ymin=0, ymax="col1", where="col1 > 0") # good aes(ymin=0, ymax="col1", where="col1 > 10") # bad aes(ymin=col2, ymax="col1", where="col1 > col2") # good aes(ymin=col2, ymax="col1", where="col1 > col3") # bad
data : DataFrame = None-
The data to be displayed in this layer. If
None, the data from from theggplot()call is used. If specified, it overrides the data from theggplot()call. stat : str | stat = "identity"-
The statistical transformation to use on the data for this layer. If it is a string, it must be the registered and known to Plotnine.
position : str | position = "stack"-
Position adjustment. If it is a string, it must be registered and known to Plotnine.
na_rm : bool = False-
If
False, removes missing values with a warning. IfTruesilently removes missing values. inherit_aes : bool = True-
If
False, overrides the default aesthetics. show_legend : bool | dict = None-
Whether this layer should be included in the legends.
Nonethe default, includes any aesthetics that are mapped. If abool,Falsenever includes andTruealways includes. Adictcan be used to exclude specific aesthetis of the layer from showing in the legend. e.gshow_legend={'color': False}, any other aesthetic are included by default. raster : bool = False-
If
True, draw onto this layer a raster (bitmap) object even ifthe final image is in vector format. **kwargs : Any-
Aesthetics or parameters used by the
stat.
See Also
Examples
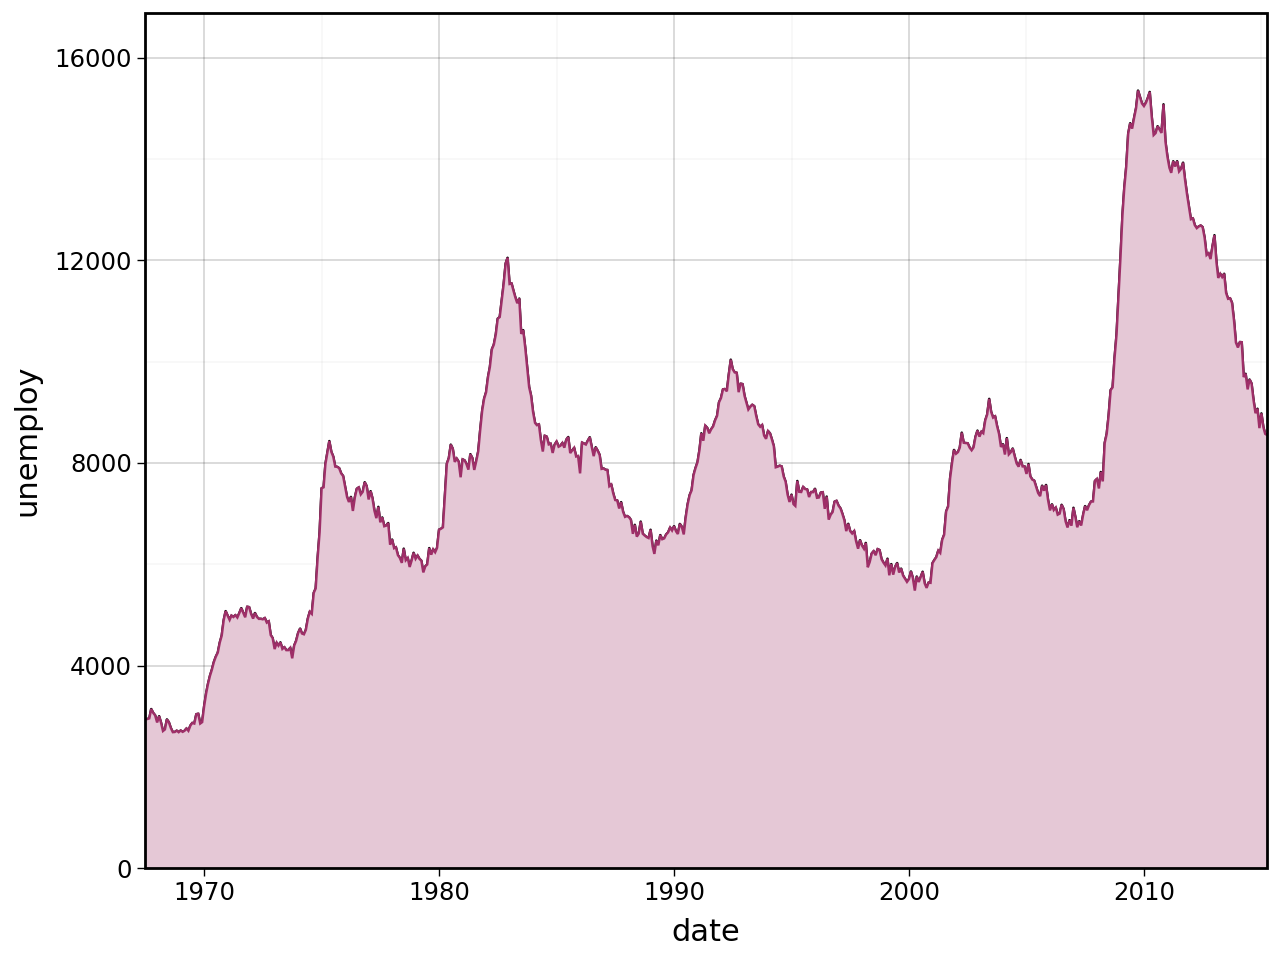
Area Under Line
# Gallery, areas
(
    ggplot(economics, aes(x="date", y="unemploy"))
    + geom_line()
    + geom_area(fill="#e5c8d6", color="#9e2f68")
    + scale_x_date(expand=(0, 0), date_labels="%Y")
    + scale_y_continuous(expand=(0, 0, 0.1, 0))
    + theme_linedraw()
)