from plotnine import ggplot, aes, geom_bar, labs, coord_flip, theme_classic
from plotnine.data import mpg
Bar plot
geom_bar(
    mapping=None,
    data=None,
    *,
    stat="count",
    position="stack",
    na_rm=False,
    inherit_aes=True,
    show_legend=None,
    raster=False,
    just=0.5,
    width=None,
    **kwargs
)
Parameters
mapping : aes = None-
Aesthetic mappings created with aes. If specified and
inherit_aes=True, it is combined with the default mapping for the plot. You must supply mapping if there is no plot mapping.Aesthetic Default value x y alpha 1color Nonefill '#595959'group linetype 'solid'size 0.5The bold aesthetics are required.
data : DataFrame = None-
The data to be displayed in this layer. If
None, the data from from theggplot()call is used. If specified, it overrides the data from theggplot()call. stat : str | stat = "count"-
The statistical transformation to use on the data for this layer. If it is a string, it must be the registered and known to Plotnine.
position : str | position = "stack"-
Position adjustment. If it is a string, it must be registered and known to Plotnine.
na_rm : bool = False-
If
False, removes missing values with a warning. IfTruesilently removes missing values. inherit_aes : bool = True-
If
False, overrides the default aesthetics. show_legend : bool | dict = None-
Whether this layer should be included in the legends.
Nonethe default, includes any aesthetics that are mapped. If abool,Falsenever includes andTruealways includes. Adictcan be used to exclude specific aesthetis of the layer from showing in the legend. e.gshow_legend={'color': False}, any other aesthetic are included by default. raster : bool = False-
If
True, draw onto this layer a raster (bitmap) object even ifthe final image is in vector format. just : float = 0.5-
How to align the column with respect to the axis breaks. The default
0.5aligns the center of the column with the break.0aligns the left of the of the column with the break and1aligns the right of the column with the break. width : float = None-
Bar width. If
None, the width is set to90%of the resolution of the data. **kwargs : Any-
Aesthetics or parameters used by the
stat.
See Also
geom_histogramstat_count-
The default
statfor thisgeom.
Examples
Bar chart
geom_bar() makes the height of the bar proportional to the number of cases in each group
mpg.head()| manufacturer | model | displ | year | cyl | trans | drv | cty | hwy | fl | class | |
|---|---|---|---|---|---|---|---|---|---|---|---|
| 0 | audi | a4 | 1.8 | 1999 | 4 | auto(l5) | f | 18 | 29 | p | compact |
| 1 | audi | a4 | 1.8 | 1999 | 4 | manual(m5) | f | 21 | 29 | p | compact |
| 2 | audi | a4 | 2.0 | 2008 | 4 | manual(m6) | f | 20 | 31 | p | compact |
| 3 | audi | a4 | 2.0 | 2008 | 4 | auto(av) | f | 21 | 30 | p | compact |
| 4 | audi | a4 | 2.8 | 1999 | 6 | auto(l5) | f | 16 | 26 | p | compact |
Bar Plot with Counts
# Gallery, distributions
ggplot(mpg) + geom_bar(aes(x="class"))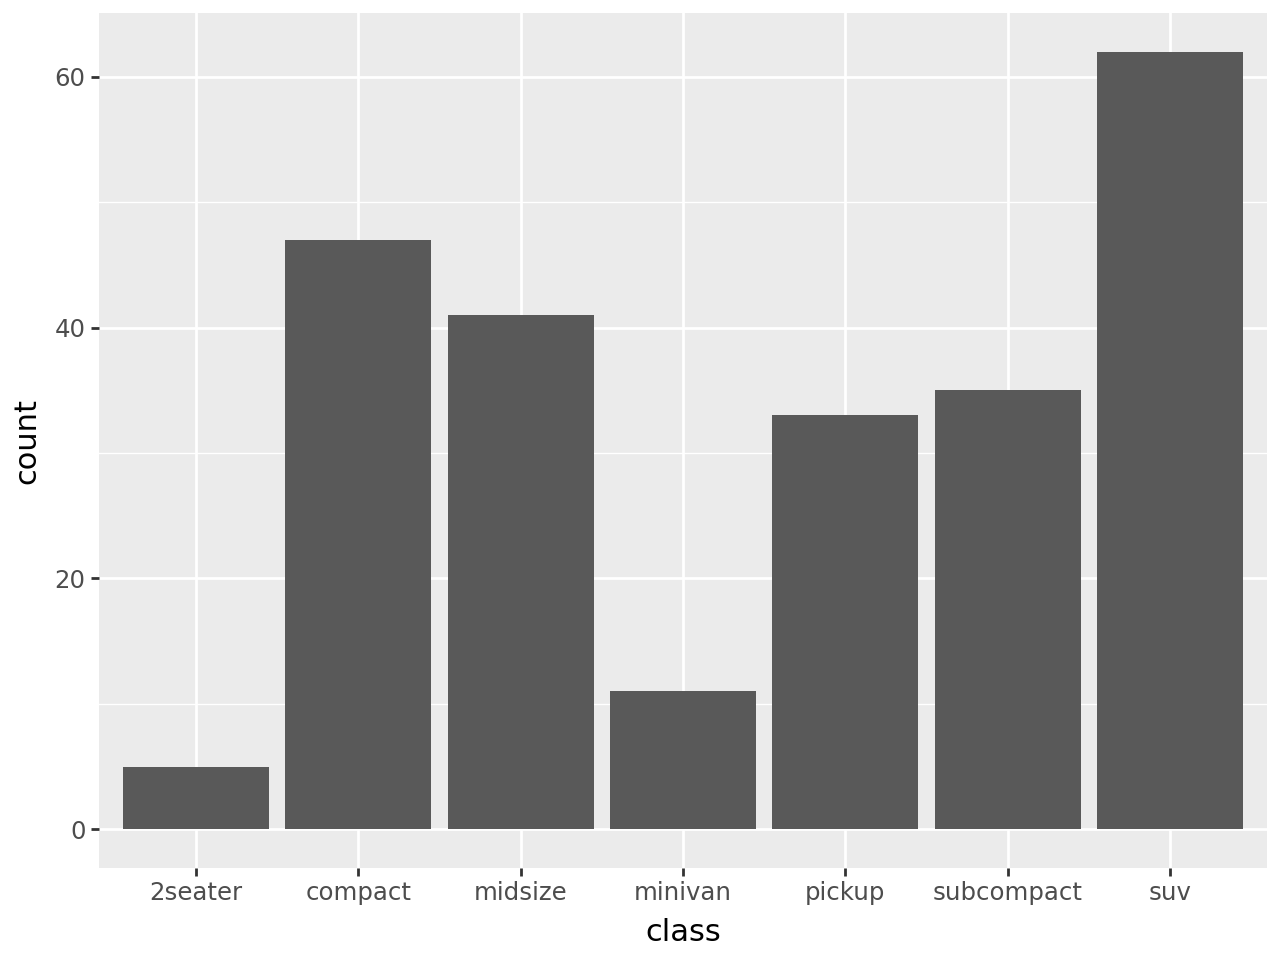
Sorting the bars
We can use the internal function reorder to sort the bars depending on the size of each group. In this case we create a variable class2 with values equal to those of class so because class is a reserved name and:
reorder(class, class, len)is not a valid python expression, while:
reorder(class2, class2, len)is a valid python expression.
mpg["class2"] = mpg["class"]

(
    ggplot(mpg)
    + geom_bar(aes(x="reorder(class2, class2, len)"))
    + labs(x="class")
)
And in descending order
(
    ggplot(mpg)
    + geom_bar(
        aes(x="reorder(class2, class2, len, ascending=False)")
    )
    + labs(x="class")
)
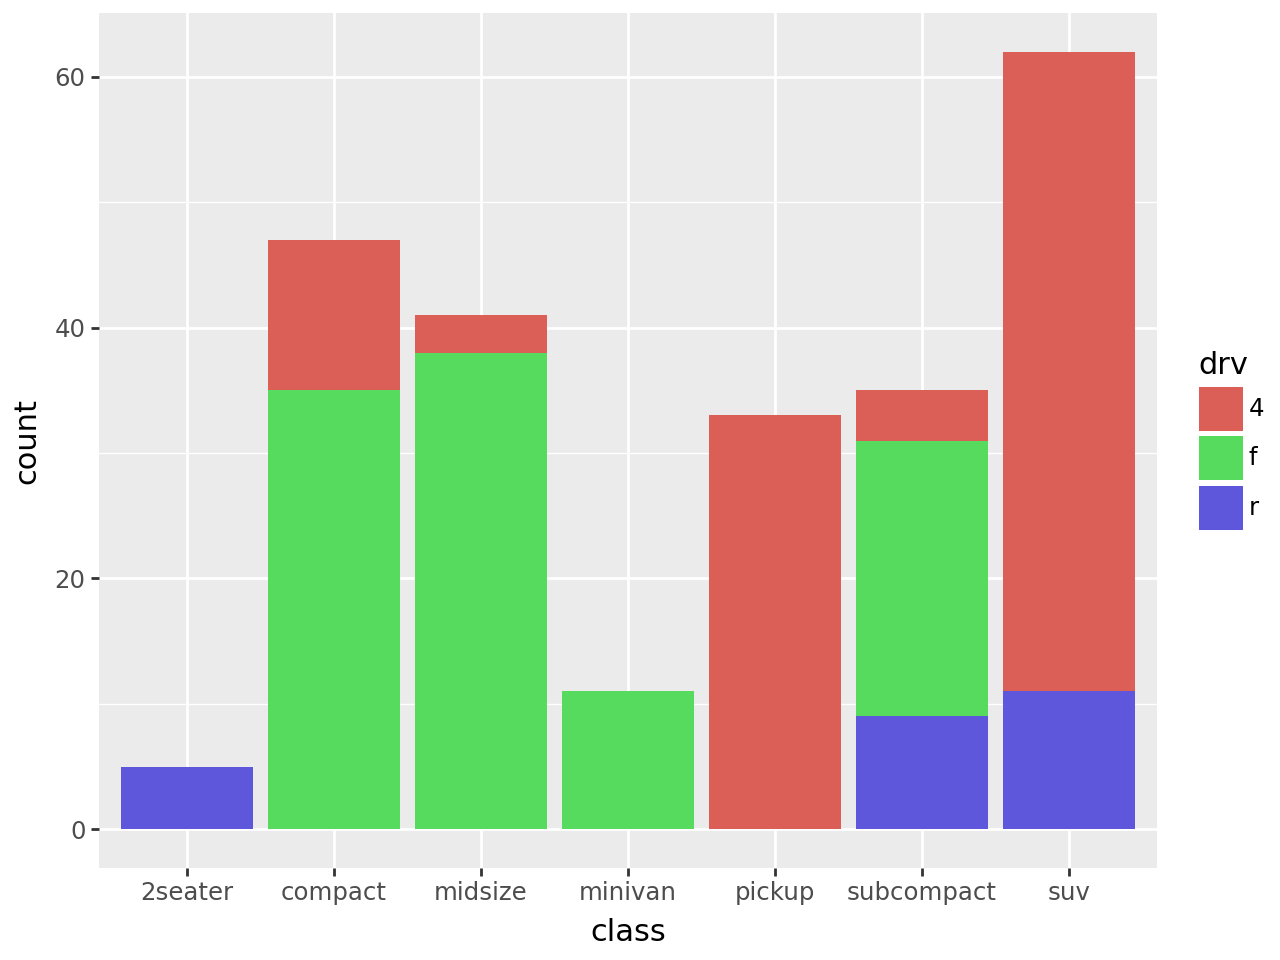
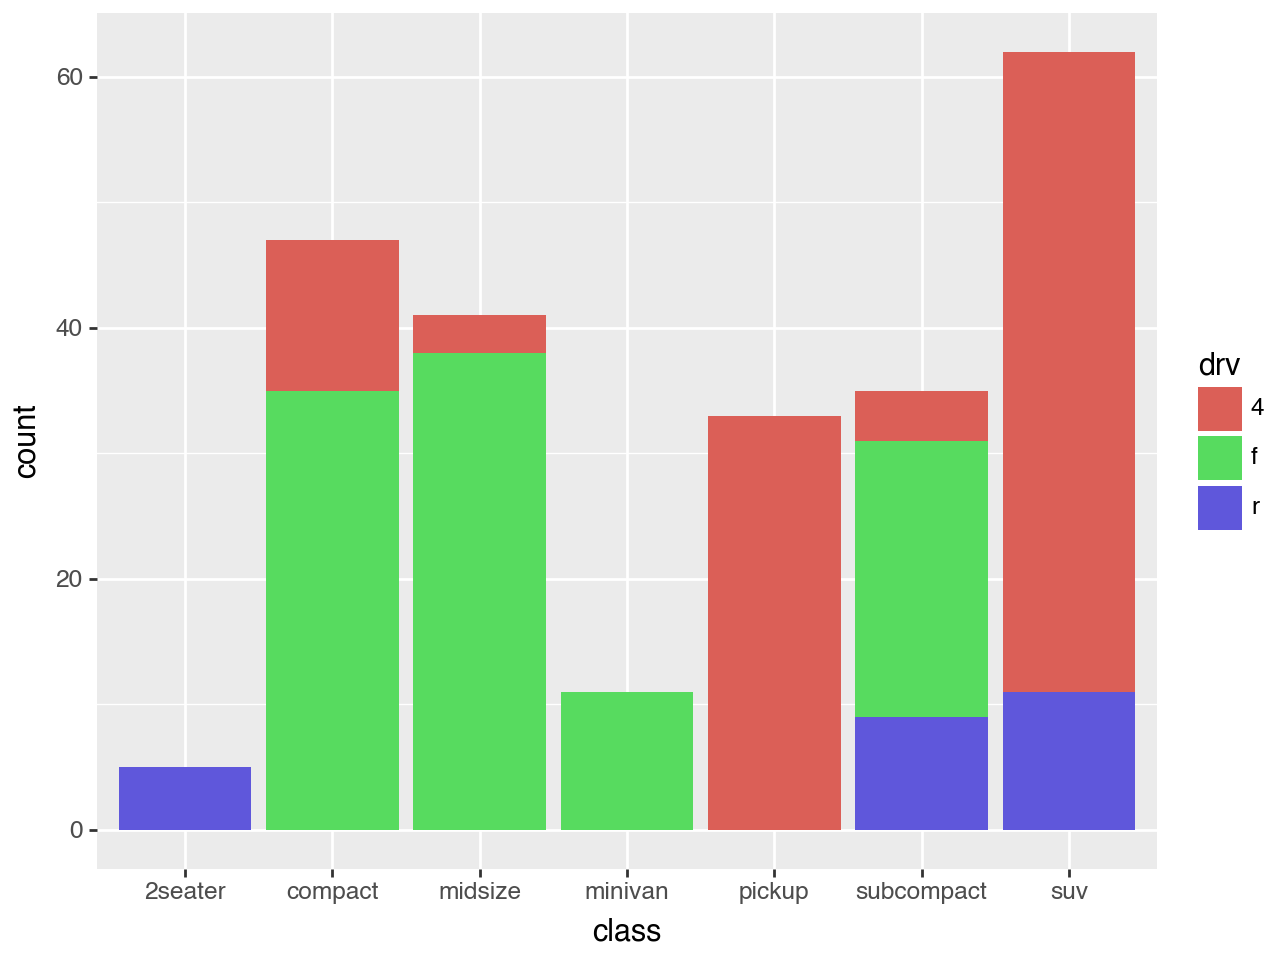
(
    ggplot(mpg)
    + geom_bar(aes(x="class", fill="drv"))
)
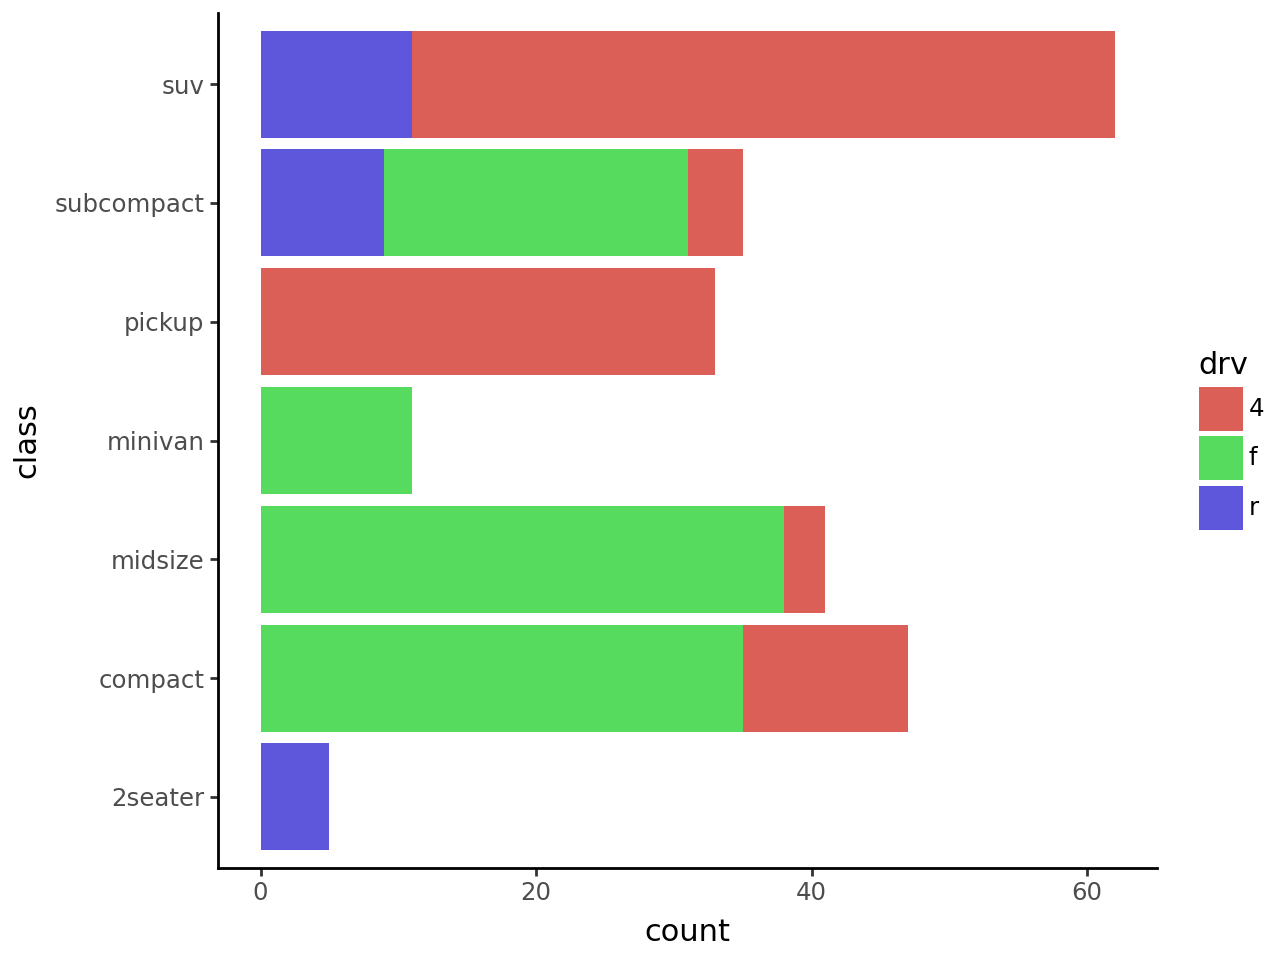
Horizontal Bar Plot with Counts
# Gallery, distributions
(
    ggplot(mpg)
    + geom_bar(aes(x="class", fill="drv"))
    + coord_flip()
    + theme_classic()
)