import pandas as pd
from plotnine import (
ggplot,
aes,
geom_point,
geom_line,
geom_linerange,
element_blank,
element_rect,
theme,
theme_matplotlib,
theme_set,
)
# Set default theme
# matplotlib + the background of 538
theme_set(
theme_matplotlib()
+ theme(
plot_background=element_rect(fill="#F0F0F0"),
panel_background=element_rect(fill="#F0F0F0"),
)
)
Vertical interval represented by lines
geom_linerange(
    mapping=None,
    data=None,
    *,
    stat="identity",
    position="identity",
    na_rm=False,
    inherit_aes=True,
    show_legend=None,
    raster=False,
    **kwargs
)
Parameters
mapping : aes = None-
Aesthetic mappings created with aes. If specified and
inherit_aes=True, it is combined with the default mapping for the plot. You must supply mapping if there is no plot mapping.Aesthetic Default value x ymax ymin alpha 1color 'black'group linetype 'solid'size 0.5The bold aesthetics are required.
data : DataFrame = None-
The data to be displayed in this layer. If
None, the data from from theggplot()call is used. If specified, it overrides the data from theggplot()call. stat : str | stat = "identity"-
The statistical transformation to use on the data for this layer. If it is a string, it must be the registered and known to Plotnine.
position : str | position = "identity"-
Position adjustment. If it is a string, it must be registered and known to Plotnine.
na_rm : bool = False-
If
False, removes missing values with a warning. IfTruesilently removes missing values. inherit_aes : bool = True-
If
False, overrides the default aesthetics. show_legend : bool | dict = None-
Whether this layer should be included in the legends.
Nonethe default, includes any aesthetics that are mapped. If abool,Falsenever includes andTruealways includes. Adictcan be used to exclude specific aesthetis of the layer from showing in the legend. e.gshow_legend={'color': False}, any other aesthetic are included by default. raster : bool = False-
If
True, draw onto this layer a raster (bitmap) object even ifthe final image is in vector format. **kwargs : Any-
Aesthetics or parameters used by the
stat.
Examples
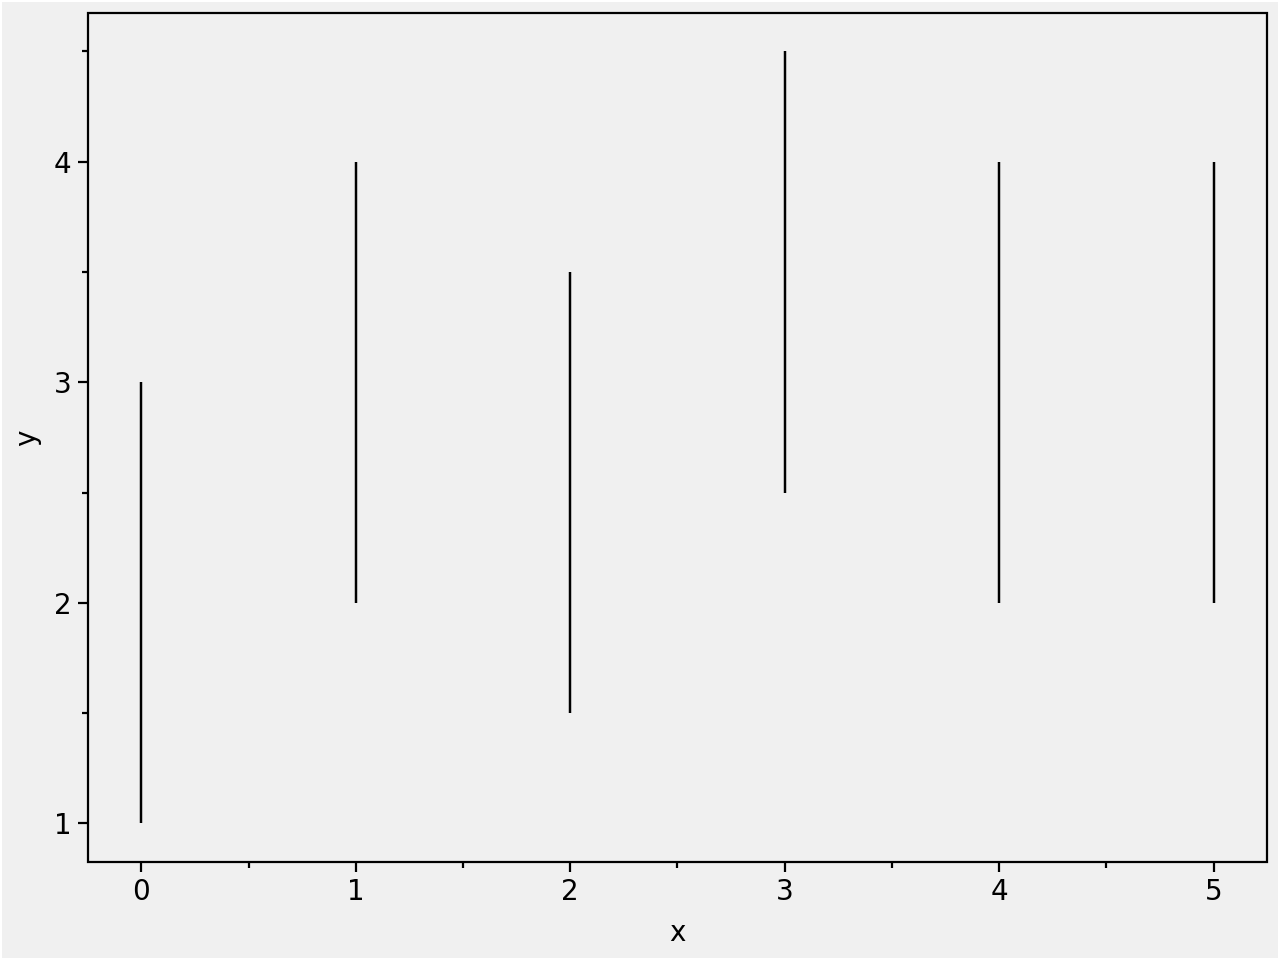
Upper & Lower Trends
The data
df = pd.DataFrame({
    "x": range(0, 6),
    "y": [3, 4, 3.5, 4.5, 4, 4]
})
Create the line ranges
(ggplot(df, aes("x", "y"))
 + geom_linerange(aes(ymin="y-2", ymax="y"))
)
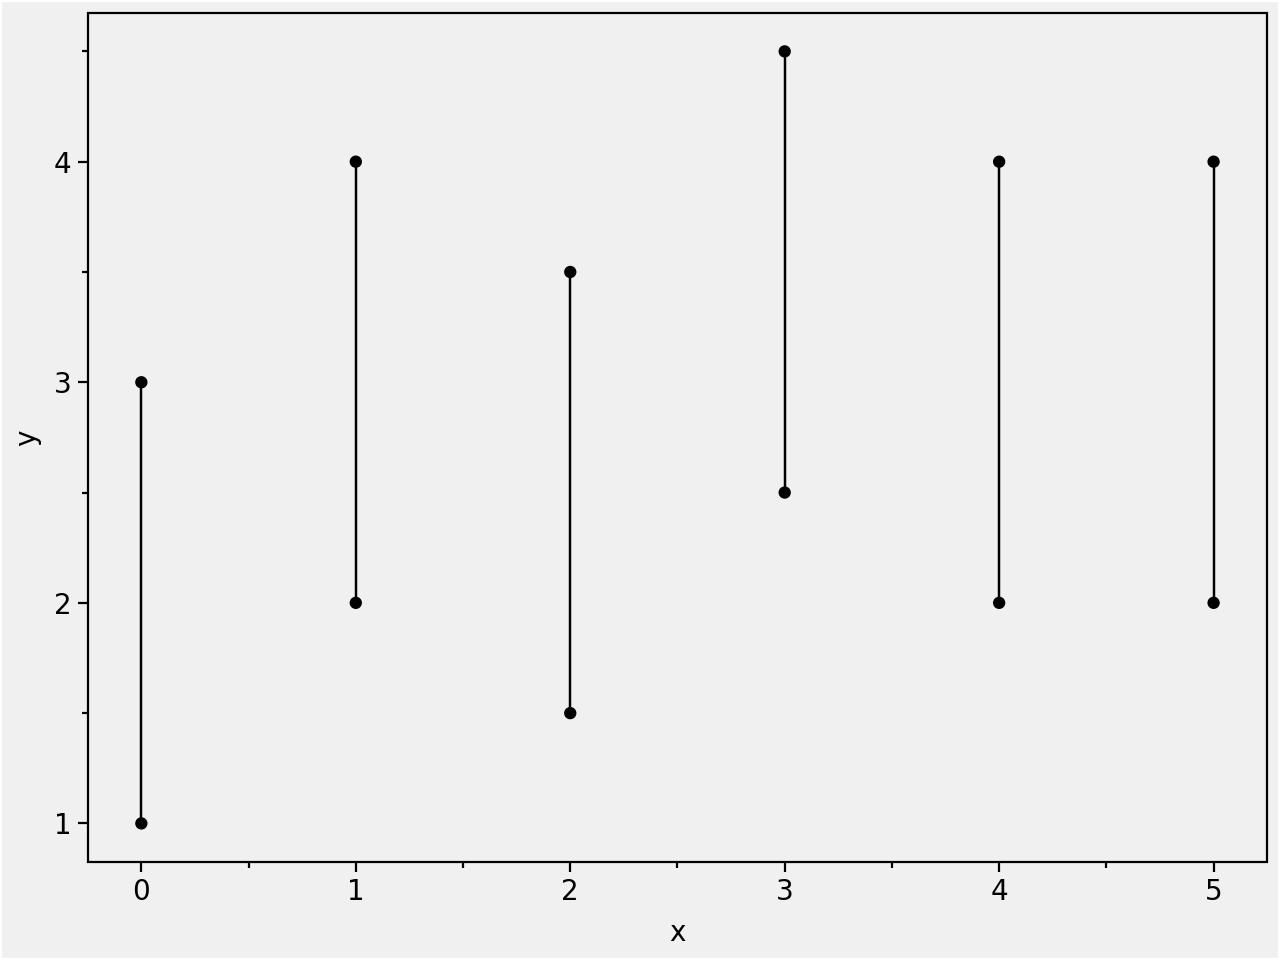
Add points at each end of the ranges.
(ggplot(df, aes("x", "y"))
 + geom_linerange(aes(ymin="y-2", ymax="y"))
 + geom_point()
 + geom_point(aes(y="y-2"))

)
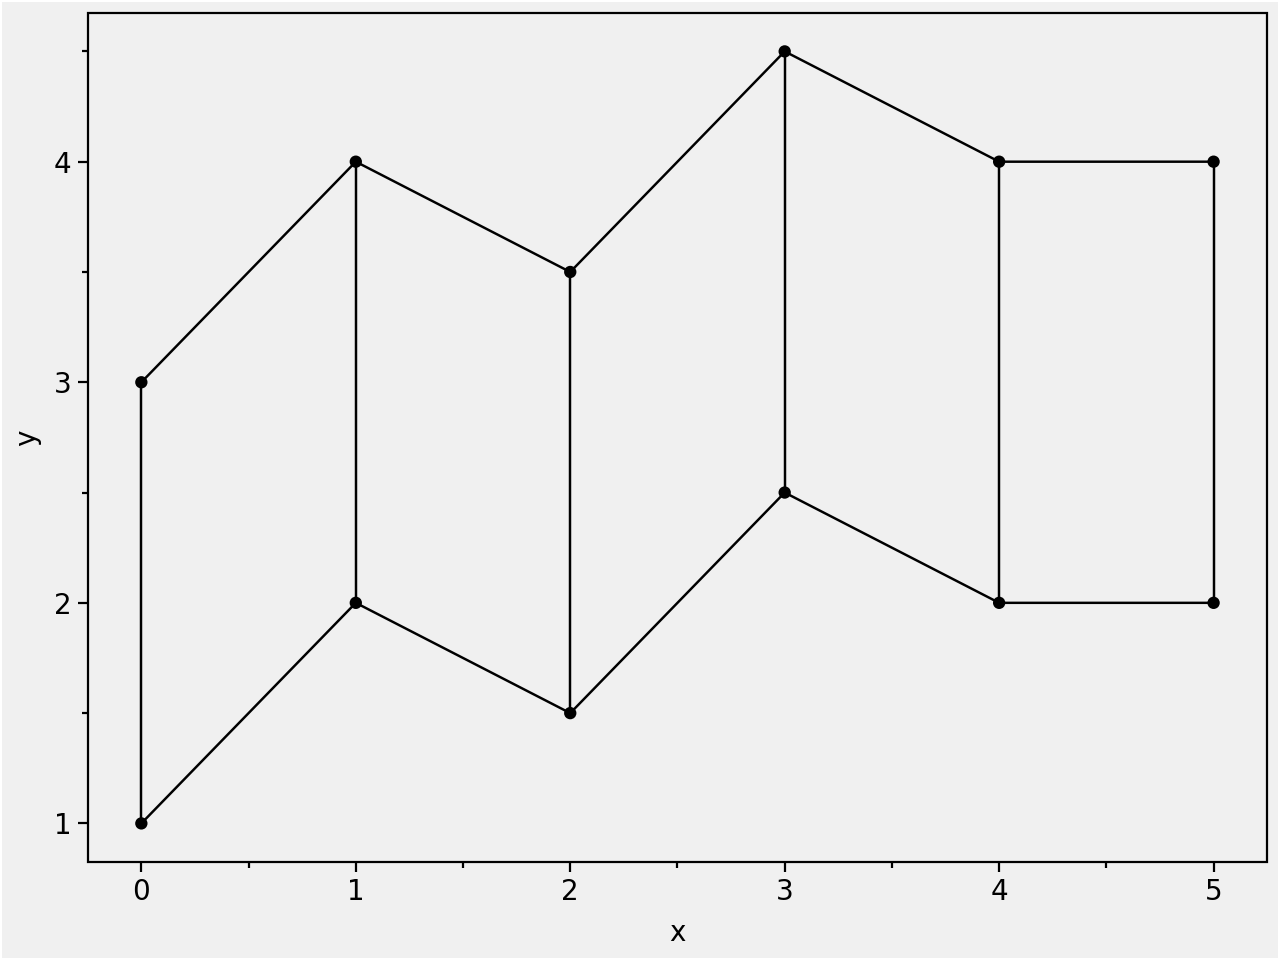
Add a trend-line along the top of the ranges and one along the bottom of the ranges. The line is added before(below) the points.
(ggplot(df, aes("x", "y"))
 + geom_linerange(aes(ymin="y-2", ymax="y"))

 + geom_line()
 + geom_point()

 + geom_line(aes(y="y-2"))
 + geom_point(aes(y="y-2"))

)
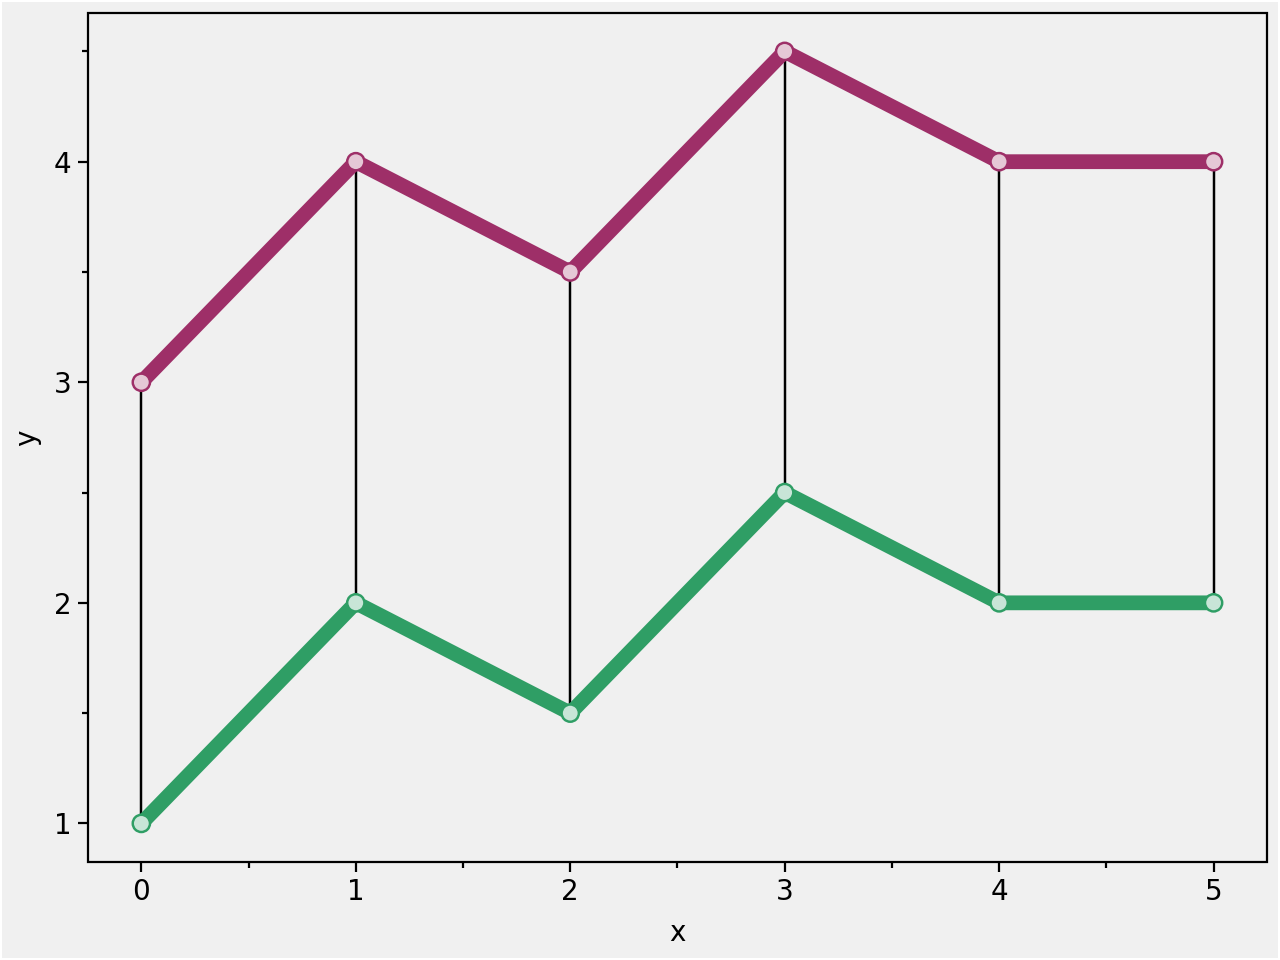
Add some color.
# Gallery, lines
magenta = "#9E2F68"
magenta_light = "#E5C8D6"

sea_green = "#2F9E65"
sea_green_light = "#C8E5D7"

(ggplot(df, aes("x", "y"))
 + geom_linerange(aes(ymin="y-2", ymax="y"))

 + geom_line(color=magenta, size=3)
 + geom_point(color=magenta, fill=magenta_light, size=3, stroke=0.5)

 + geom_line(aes(y="y-2"), color=sea_green, size=3)
 + geom_point(aes(y="y-2"), color=sea_green, fill=sea_green_light, size=3, stroke=0.5)
)