import geopandas as gp
import geodatasets
from plotnine import (
ggplot,
aes,
coord_fixed,
facet_wrap,
geom_map,
geom_text,
labs,
scale_fill_brewer,
scale_fill_continuous,
scale_x_continuous,
scale_y_continuous,
scale_size_continuous,
stage,
coord_cartesian,
element_line,
element_rect,
element_text,
theme_void,
theme,
)
Draw map feature
geom_map(
    mapping=None,
    data=None,
    *,
    stat="identity",
    position="identity",
    na_rm=False,
    inherit_aes=True,
    show_legend=None,
    raster=False,
    **kwargs
)
The map feature are drawn without any special projections.
Parameters
mapping : aes = None-
Aesthetic mappings created with aes. If specified and
inherit_aes=True, it is combined with the default mapping for the plot. You must supply mapping if there is no plot mapping.Aesthetic Default value geometry alpha 1color '#111111'fill '#333333'group linetype 'solid'shape 'o'size 0.5stroke 0.5The bold aesthetics are required.
data : DataFrame = None-
The data to be displayed in this layer. If
None, the data from from theggplot()call is used. If specified, it overrides the data from theggplot()call. stat : str | stat = "identity"-
The statistical transformation to use on the data for this layer. If it is a string, it must be the registered and known to Plotnine.
position : str | position = "identity"-
Position adjustment. If it is a string, it must be registered and known to Plotnine.
na_rm : bool = False-
If
False, removes missing values with a warning. IfTruesilently removes missing values. inherit_aes : bool = True-
If
False, overrides the default aesthetics. show_legend : bool | dict = None-
Whether this layer should be included in the legends.
Nonethe default, includes any aesthetics that are mapped. If abool,Falsenever includes andTruealways includes. Adictcan be used to exclude specific aesthetis of the layer from showing in the legend. e.gshow_legend={'color': False}, any other aesthetic are included by default. raster : bool = False-
If
True, draw onto this layer a raster (bitmap) object even ifthe final image is in vector format. **kwargs : Any-
Aesthetics or parameters used by the
stat.
Notes
This geom is best suited for plotting a shapefile read into geopandas dataframe. The dataframe should have a geometry column.
Examples
Define some useful functions
def good_centroid(geometry):
    """
    Calculate "good" centroids for polygons in the geometry

    The polygon is projected onto the Equal Area Cylindrical projection,
    the centroids are computed, then mapped back onto the original
    coordinate system.
    """
    return geometry.to_crs("+proj=cea").centroid.to_crs(geometry.crs)


def overlay_color(rgb_hex_colors, light="white", dark="black", threshold=0.5):
    """
    Decide which color is suitable to write onto the given colors
    """
    def luminance(rgb_hex):
        """
        Calculate the Luminance ([0, 1]) of a hex color
        """
        r = int(rgb_hex[1:3], 16)
        g = int(rgb_hex[3:5], 16)
        b = int(rgb_hex[5:], 16)
        luma = (r*0.299 + g*0.587 + b*0.0722) / 256
        return luma
    return [light if luminance(x) < threshold  else dark for x in rgb_hex_colors]
A Map from geodatasets
We are going to use a dataset from the geodatasets package. We can explore the dataset providers at geodatasets.data, each of which has one or more datasets:
We choose the dataset of Sudden Infant Death (SIDS) counts from counties in North Carolina. We can see some meta information about that dataset. You can view the details with geodatasets.data.geoda.sids.
Download the dataset we want (it is automatically cached).
geodatasets.fetch("geoda sids")Read data
sids = gp.read_file(geodatasets.get_path("geoda.sids"))
sids.head()| AREA | PERIMETER | CNTY_ | CNTY_ID | NAME | FIPS | FIPSNO | CRESS_ID | BIR74 | SID74 | NWBIR74 | BIR79 | SID79 | NWBIR79 | geometry | |
|---|---|---|---|---|---|---|---|---|---|---|---|---|---|---|---|
| 0 | 0.114 | 1.442 | 1825 | 1825 | Ashe | 37009 | 37009 | 5 | 1091.0 | 1.0 | 10.0 | 1364.0 | 0.0 | 19.0 | POLYGON ((-81.47276 36.23436, -81.54084 36.272... |
| 1 | 0.061 | 1.231 | 1827 | 1827 | Alleghany | 37005 | 37005 | 3 | 487.0 | 0.0 | 10.0 | 542.0 | 3.0 | 12.0 | POLYGON ((-81.23989 36.36536, -81.24069 36.379... |
| 2 | 0.143 | 1.630 | 1828 | 1828 | Surry | 37171 | 37171 | 86 | 3188.0 | 5.0 | 208.0 | 3616.0 | 6.0 | 260.0 | POLYGON ((-80.45634 36.24256, -80.47639 36.254... |
| 3 | 0.070 | 2.968 | 1831 | 1831 | Currituck | 37053 | 37053 | 27 | 508.0 | 1.0 | 123.0 | 830.0 | 2.0 | 145.0 | MULTIPOLYGON (((-76.00897 36.3196, -76.01735 3... |
| 4 | 0.153 | 2.206 | 1832 | 1832 | Northampton | 37131 | 37131 | 66 | 1421.0 | 9.0 | 1066.0 | 1606.0 | 3.0 | 1197.0 | POLYGON ((-77.21767 36.24098, -77.23461 36.214... |
The sids data has two periods 1974 - 1978 and 1979 - 1985. For each period there is a number of births and a number of deaths. We want to visually compare the deaths per 1000 in each county for the two periods.
data = sids.copy()

# Calculate the death per 1000
data["1974 - 1978"] = (data["SID74"] / data["BIR74"]) * 1000
data["1979 - 1984"] = (data["SID79"] / data["BIR79"]) * 1000

# Calculate center coordinates for the counties
data["center_lon"] = good_centroid(data.geometry).x
data["center_lat"] = good_centroid(data.geometry).y

# Make the data
data = data.melt(
    id_vars=["NAME", "geometry", "center_lon", "center_lat"],
    value_vars=["1974 - 1978", "1979 - 1984"],
    var_name="period",
    value_name="deaths_per_1k",
).rename(
    {"NAME": "county"},
    axis=1
)

data.head()| county | geometry | center_lon | center_lat | period | deaths_per_1k | |
|---|---|---|---|---|---|---|
| 0 | Ashe | POLYGON ((-81.47276 36.23436, -81.54084 36.272... | -81.498245 | 36.431263 | 1974 - 1978 | 0.916590 |
| 1 | Alleghany | POLYGON ((-81.23989 36.36536, -81.24069 36.379... | -81.125138 | 36.490963 | 1974 - 1978 | 0.000000 |
| 2 | Surry | POLYGON ((-80.45634 36.24256, -80.47639 36.254... | -80.685736 | 36.412381 | 1974 - 1978 | 1.568381 |
| 3 | Currituck | MULTIPOLYGON (((-76.00897 36.3196, -76.01735 3... | -76.027392 | 36.407026 | 1974 - 1978 | 1.968504 |
| 4 | Northampton | POLYGON ((-77.21767 36.24098, -77.23461 36.214... | -77.410484 | 36.422110 | 1974 - 1978 | 6.333568 |
Plot the data
# Gallery, maps

(
    ggplot(data)
    + geom_map(aes(fill="deaths_per_1k"))
    + geom_text(
        aes(
            "center_lon",
            "center_lat",
            label="county",
            color=stage("deaths_per_1k", after_scale="overlay_color(color)")
        ),
        size=6,
        show_legend=False
    )
    + scale_fill_continuous(
        name="Deaths Per 1000",
        cmap_name="plasma",
        breaks=[0, 2.5, 5, 7.5, 10],
        labels=["0", "2.5", "5", "7.5", "10"],
        limits=[0, 10],
    )
    + facet_wrap(
        "period",
        ncol=1,
        labeller=lambda s: f"Sudden Infant Deaths in the Period {s}"
    )
    + coord_fixed(expand=False)
    + theme_void()
    + theme(
        figure_size=(12, 8),
        legend_position=(0, 0),
        legend_direction="horizontal",
        legend_title_position="top",
        plot_margin=0.01,
        plot_background=element_rect(fill="white"),
        panel_spacing=0.025,
        legend_frame=element_rect(color="black"),
        legend_ticks=element_line(color="black"),
        strip_text=element_text(size=12),
    )
)
The Territories of Westeros
Layering different features on a Map
Read data and select features in Westeros only.
continents = gp.read_file("data/lands-of-ice-and-fire/continents.shp")
islands = gp.read_file("data/lands-of-ice-and-fire/islands.shp")
lakes = gp.read_file("data/lands-of-ice-and-fire/lakes.shp")
rivers = gp.read_file("data/lands-of-ice-and-fire/rivers.shp")
political = gp.read_file("data/lands-of-ice-and-fire/political.shp")
wall = gp.read_file("data/lands-of-ice-and-fire/wall.shp")
roads = gp.read_file("data/lands-of-ice-and-fire/roads.shp")
locations = gp.read_file("data/lands-of-ice-and-fire/locations.shp")

westeros = continents.query('name=="Westeros"')
islands = islands.query('continent=="Westeros" and name!="Summer Islands"')
lakes = lakes.query('continent=="Westeros"')
rivers = rivers.query('continent=="Westeros"')
roads = roads.query('continent=="Westeros"')

wg = westeros.geometry[0]
bool_idx = [wg.contains(g) for g in locations.geometry]
westeros_locations = locations[bool_idx]
cities = westeros_locations[westeros_locations["type"] == "City"].copy()
Create map by placing the features in layers in an order that limits obstraction.
The GeoDataFrame.geometry.centroid property has the center coordinates of polygons, we use these to place the labels of the political regions.
# Gallery, maps

# colors
water_color = "#a3ccff"
wall_color = "white"
road_color = "brown"


# Create label text by merging the territory name and
# the claimant to the territory
def fmt_labels(names, claimants):
    labels = []
    for name, claimant in zip(names, claimants):
        if name:
            labels.append("{} ({})".format(name, claimant))
        else:
            labels.append("({})".format(claimant))
    return labels


def calculate_center(df):
    """
    Calculate the centre of a geometry

    This method first converts to a planar crs, gets the centroid
    then converts back to the original crs. This gives a more
    accurate
    """
    original_crs = df.crs
    planar_crs = "EPSG:3857"
    return df["geometry"].to_crs(planar_crs).centroid.to_crs(original_crs)


political["center"] = calculate_center(political)
cities["center"] = calculate_center(cities)

(
    ggplot()
    + geom_map(westeros, fill=None)
    + geom_map(islands, fill=None)
    + geom_map(political, aes(fill="ClaimedBy"), color=None, show_legend=False)
    + geom_map(wall, color=wall_color, size=2)
    + geom_map(lakes, fill=water_color, color=None)
    + geom_map(rivers, aes(size="size"), color=water_color, show_legend=False)
    + geom_map(roads, aes(size="size"), color=road_color, alpha=0.5, show_legend=False)
    + geom_map(cities, size=1)
    + geom_text(
        political,
        aes("center.x", "center.y", label="fmt_labels(name, ClaimedBy)"),
        size=8,
        fontweight="bold",
    )
    + geom_text(
        cities,
        aes("center.x", "center.y", label="name"),
        size=8,
        ha="left",
        nudge_x=0.20,
    )
    + labs(title="The Political Territories of Westeros")
    + scale_fill_brewer(type="qual", palette=8)
    + scale_x_continuous(expand=(0, 0, 0, 1))
    + scale_y_continuous(expand=(0, 1, 0, 0))
    + scale_size_continuous(range=(0.4, 1))
    + coord_cartesian()
    + theme_void()
    + theme(figure_size=(8, 12), panel_background=element_rect(fill=water_color))
)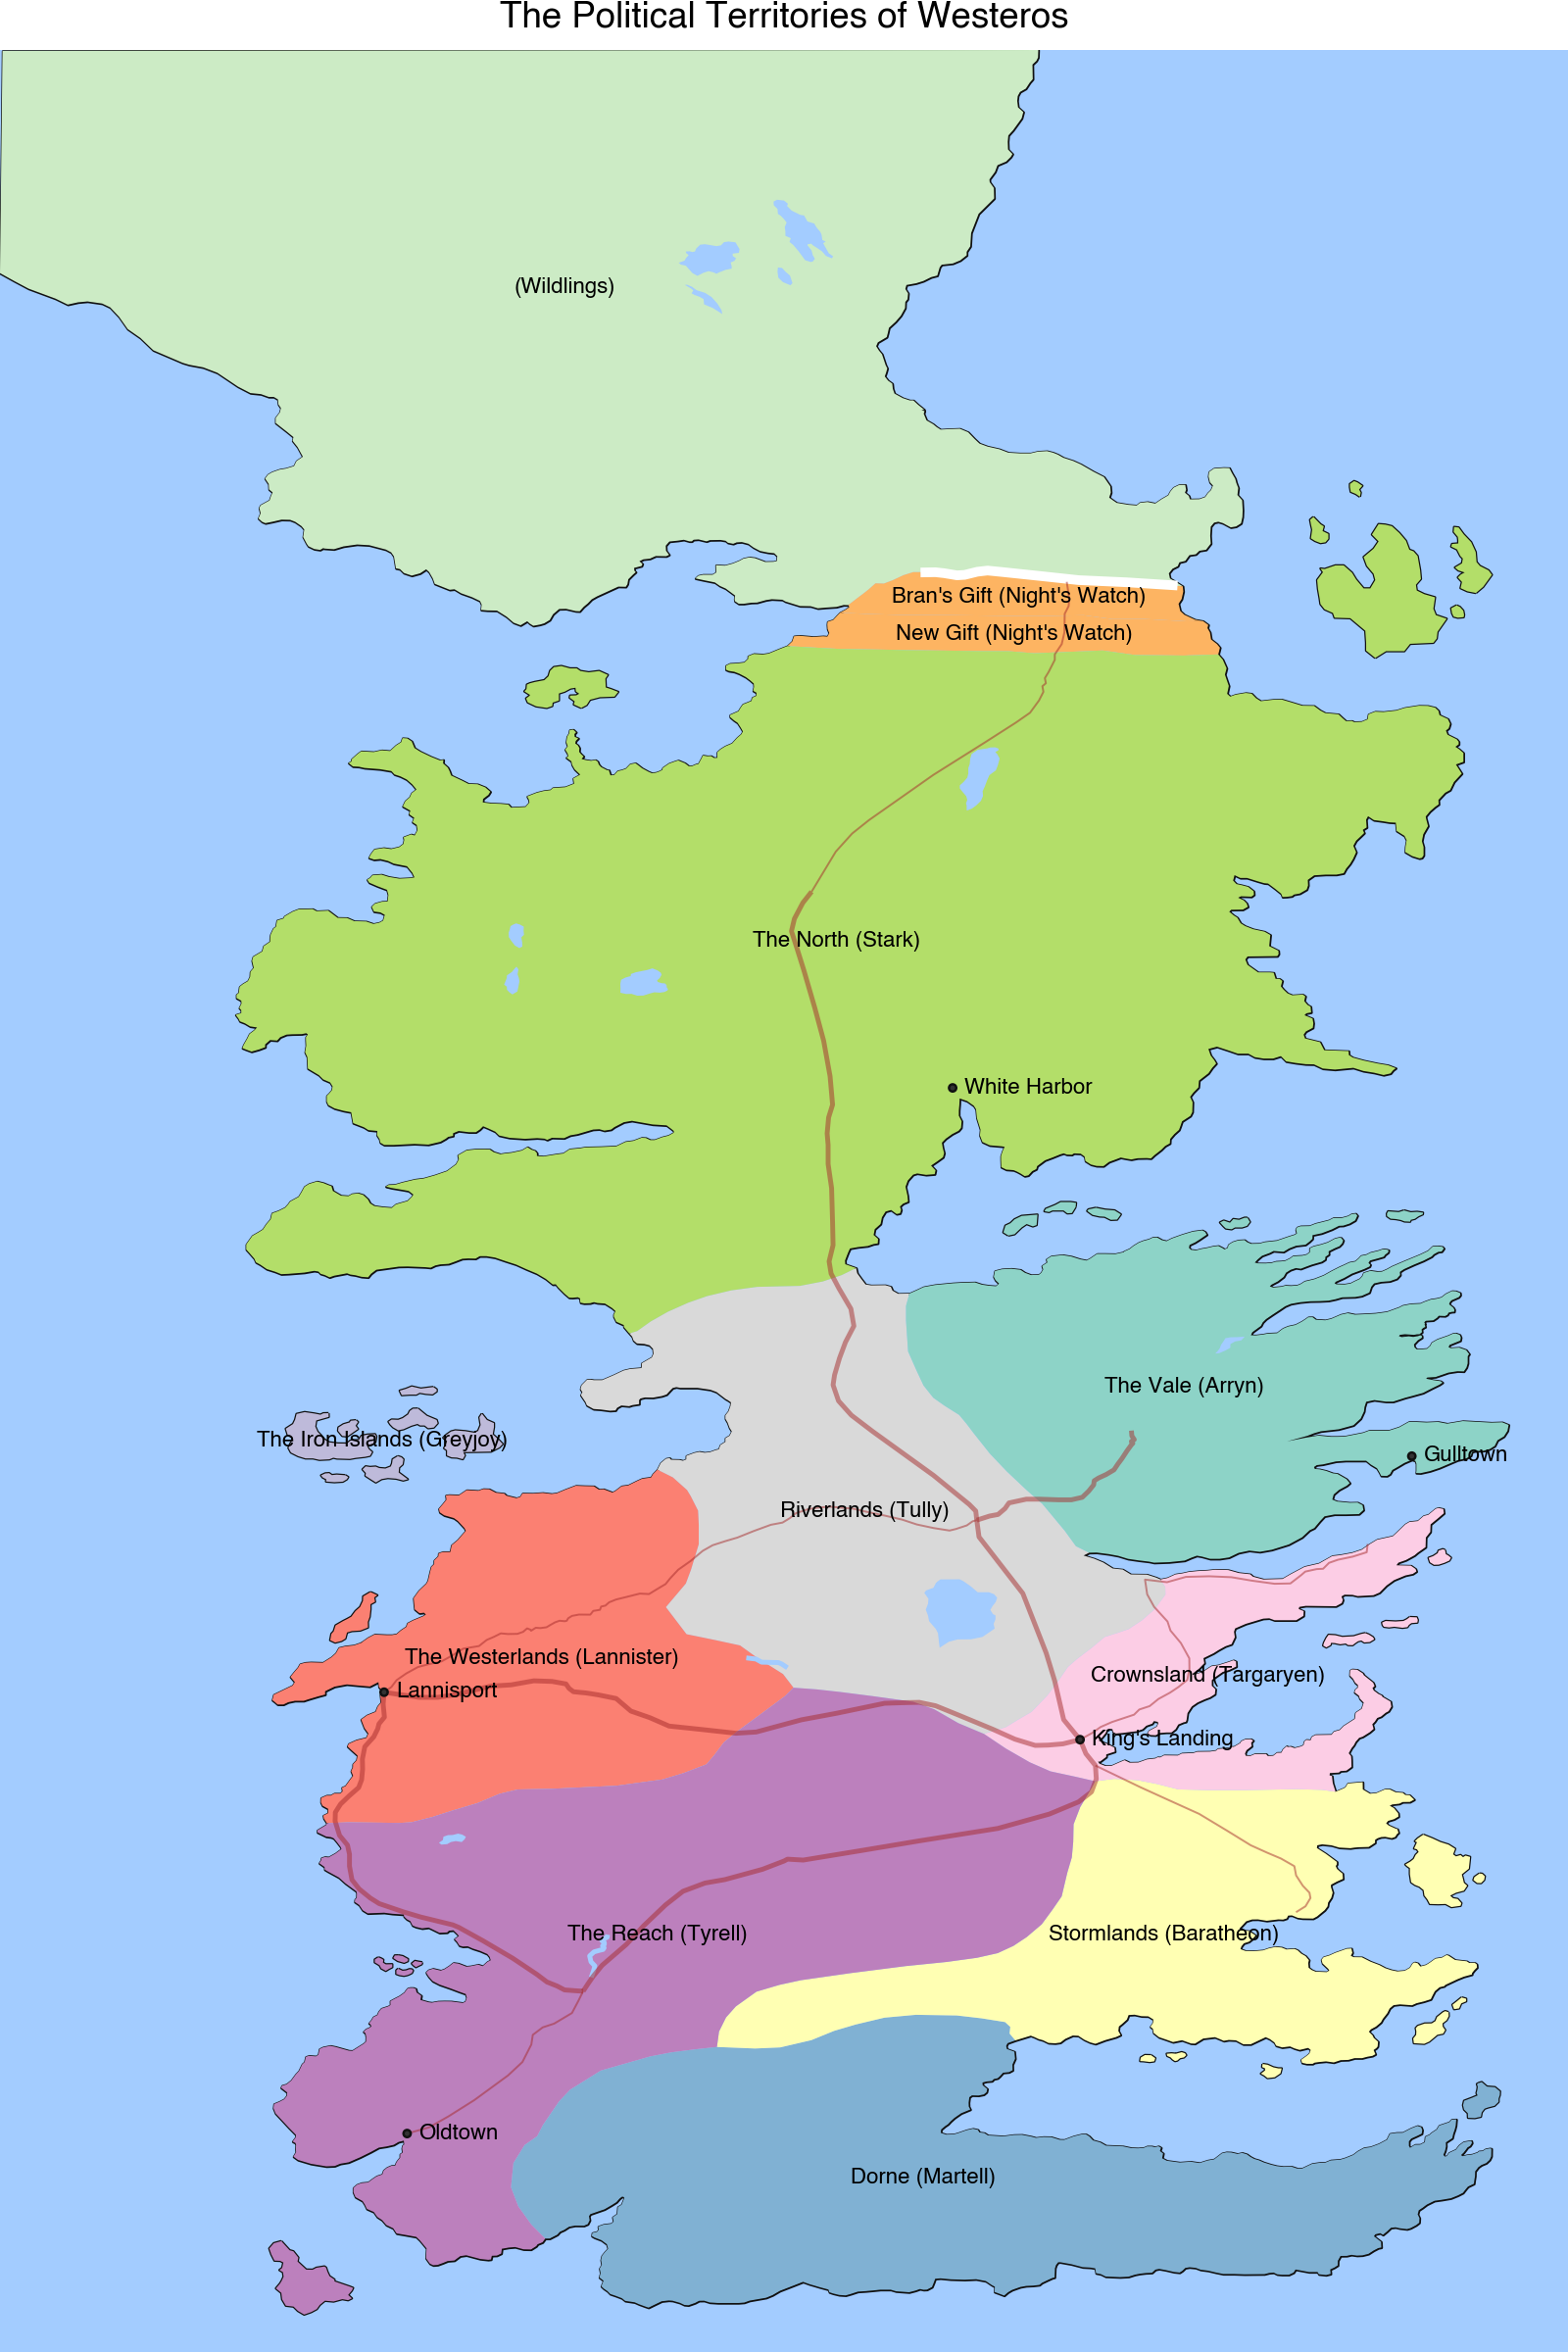
Credit: cadaei of the cartographersguild website forum.