import pandas as pd

from plotnine import *

df = pd.DataFrame(
    {
        "group": ["A"] * 2 + ["B"] * 2,
        "condition": ["treatment", "control"] * 2,
        "measure": [3, 1, 2, 1],
    }
)Scale linetype, shapes, sizes
- linetype and shape tend to be simple
- size supports a range of scale types
- refer to aesthetics specification
Linetype: specifying values
p = (
    ggplot(df, aes("condition", "measure", group="group"))
    + geom_line(aes(linetype="group"), size=1)
    + geom_point(aes(fill="group", shape="group"), size=4)
)

p
p + scale_linetype_manual(breaks=["A", "B"], values=["dotted", "dashdot"])

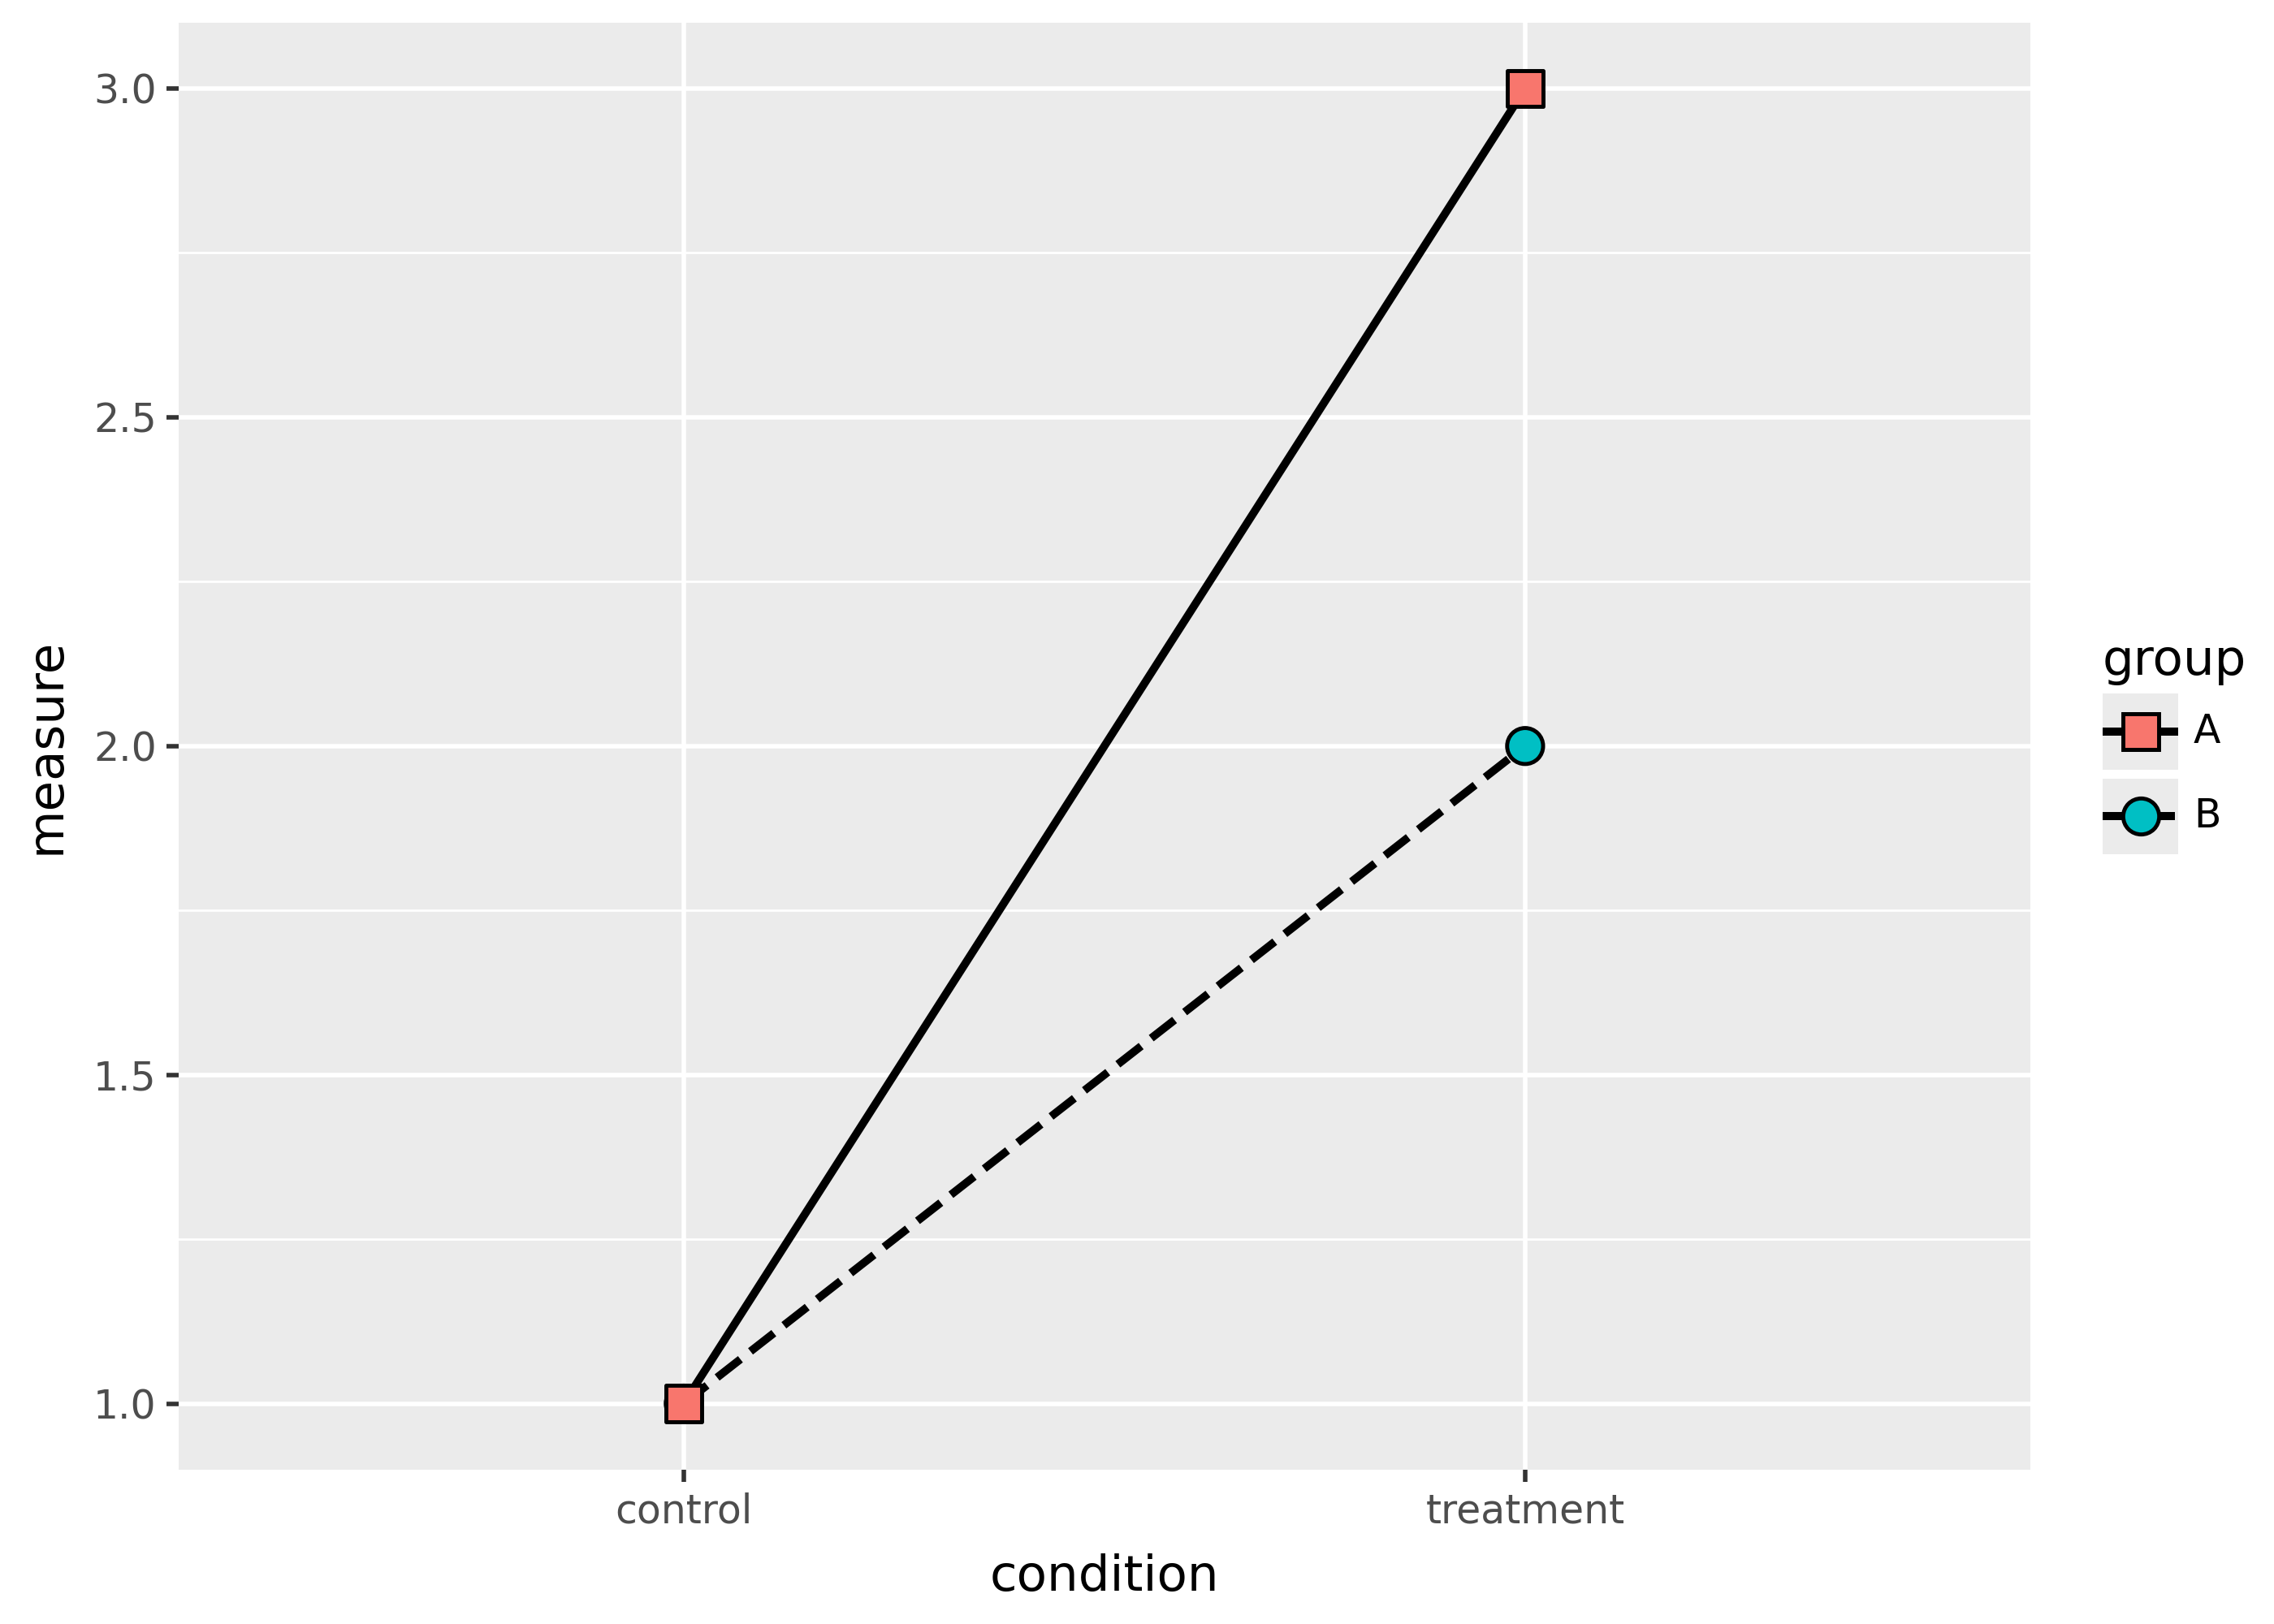
Shape: specifying values
p = (
    ggplot(df, aes("condition", "measure", group="group"))
    + geom_line(aes(linetype="group"), size=1)
    + geom_point(aes(fill="group", shape="group"), size=4)
)

p
p + scale_shape_manual(breaks=["A", "B"], values=["s", "o"])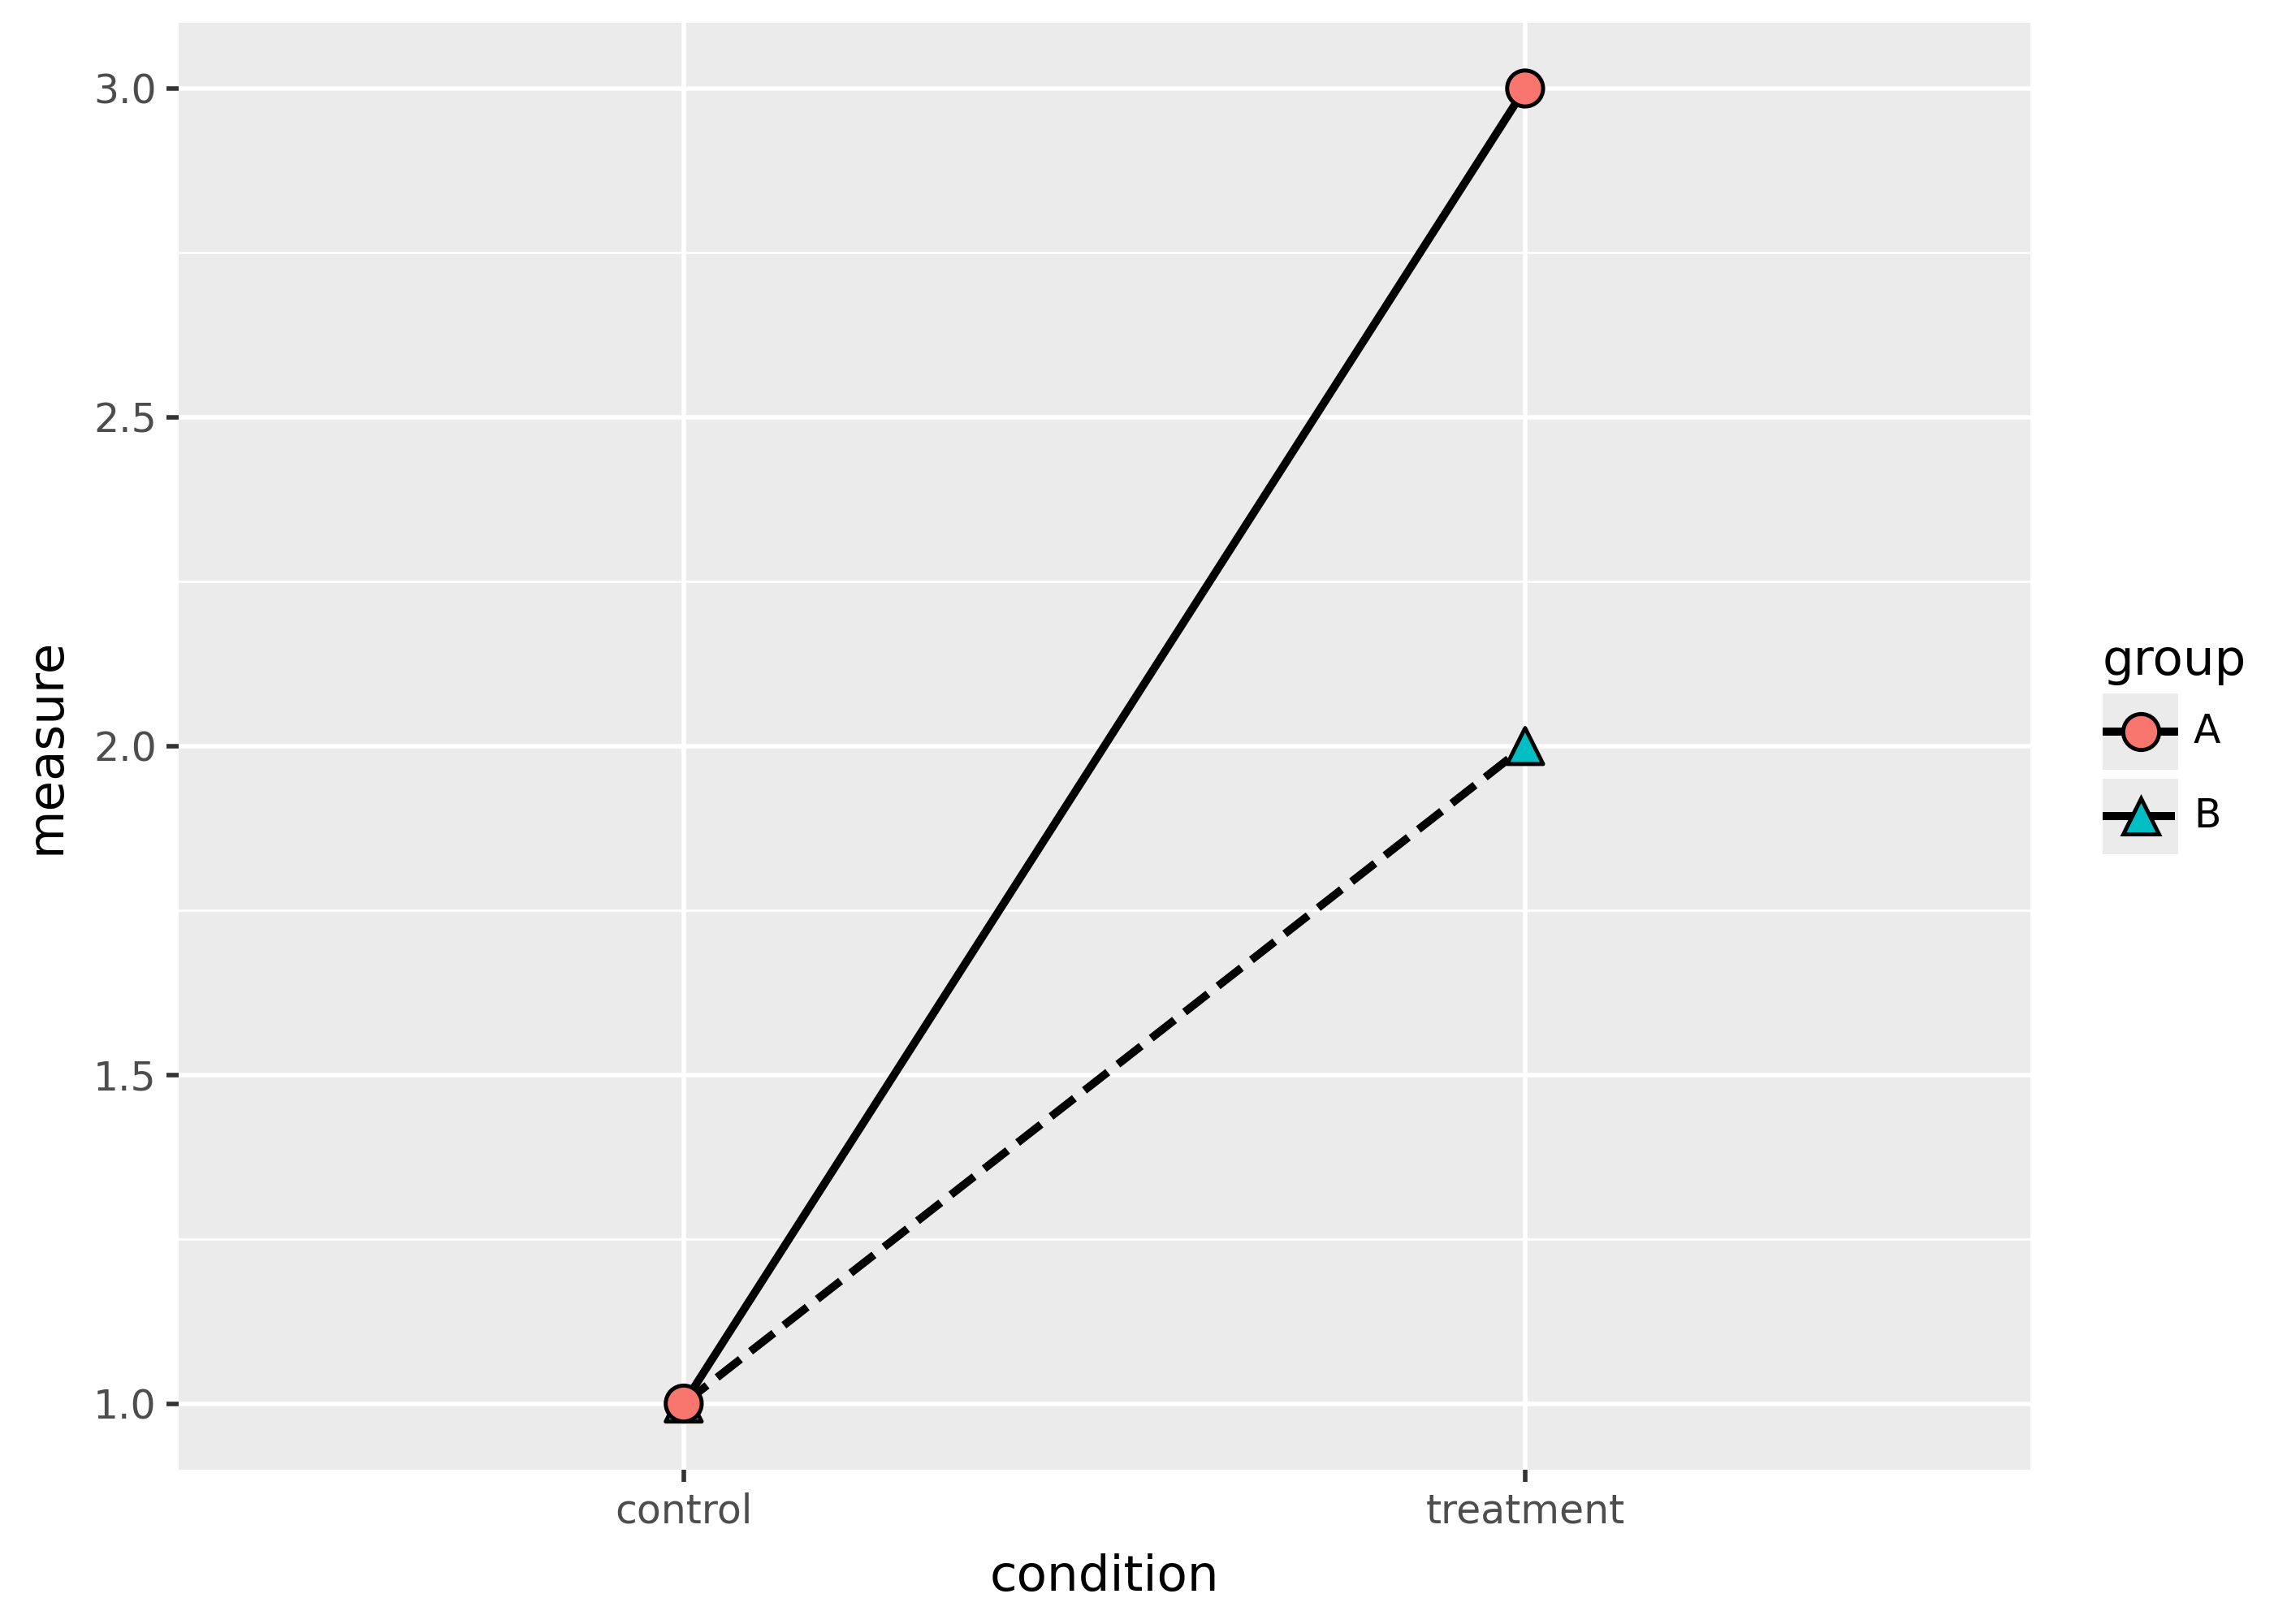
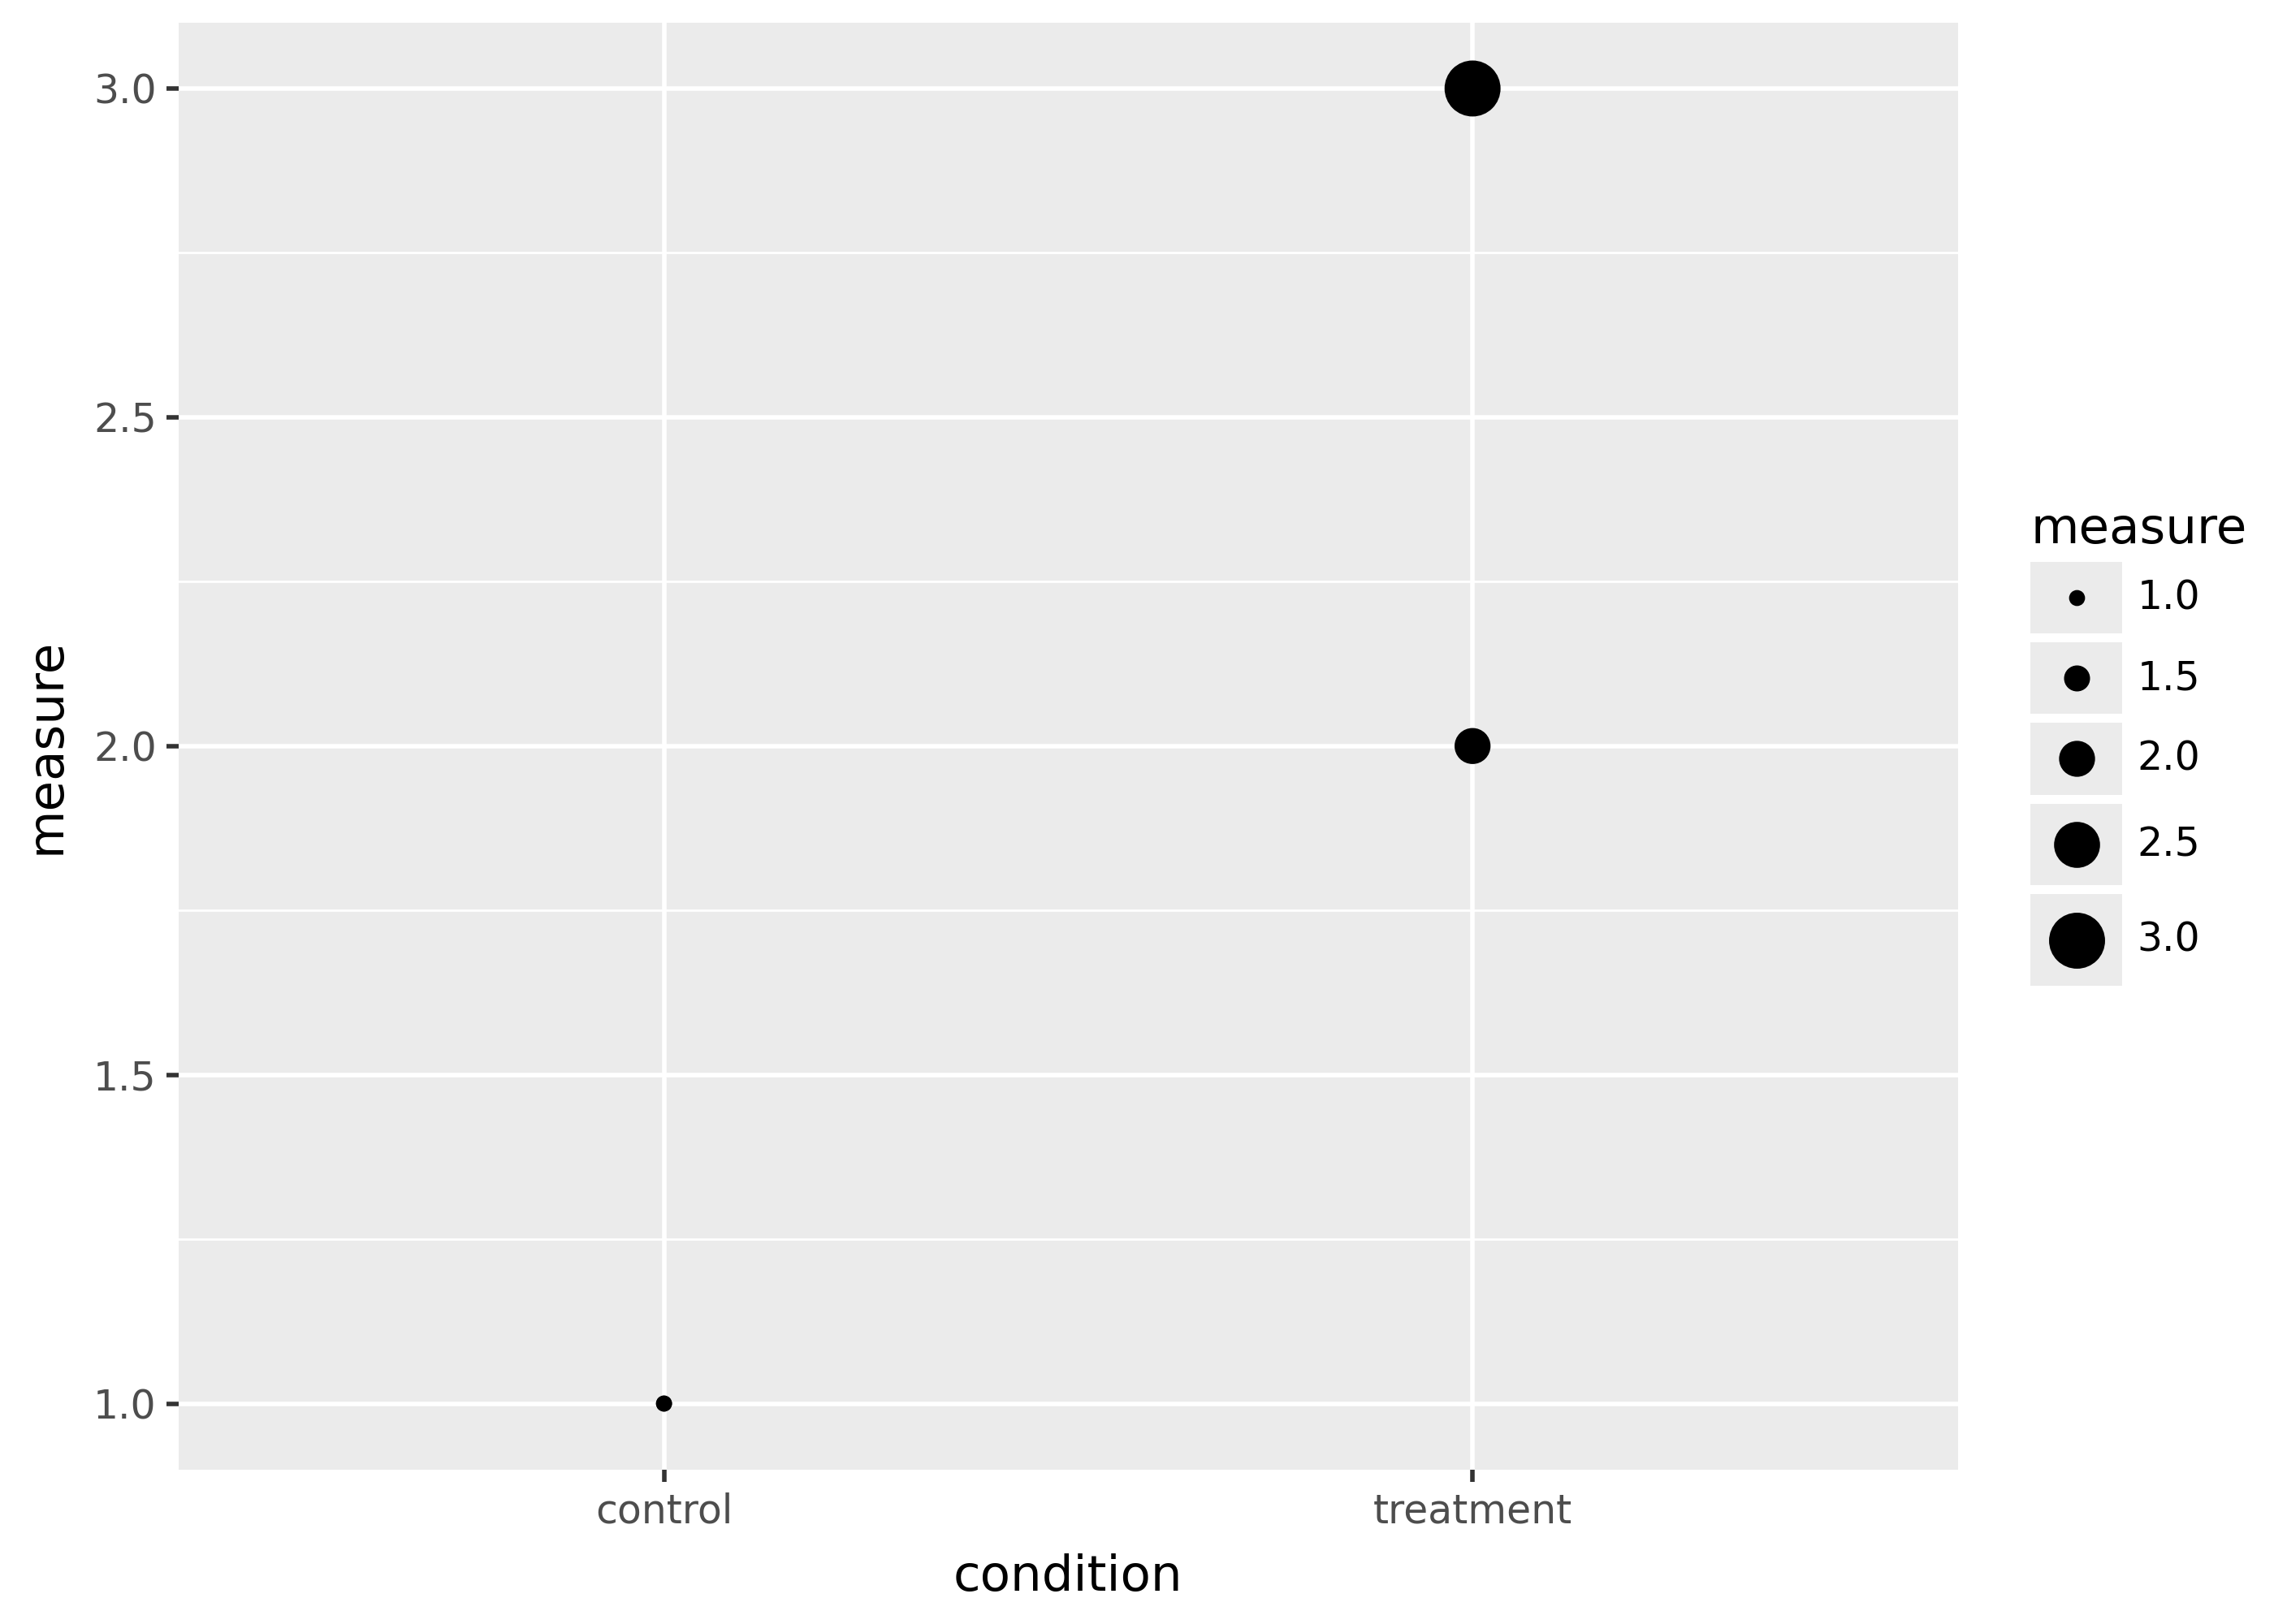
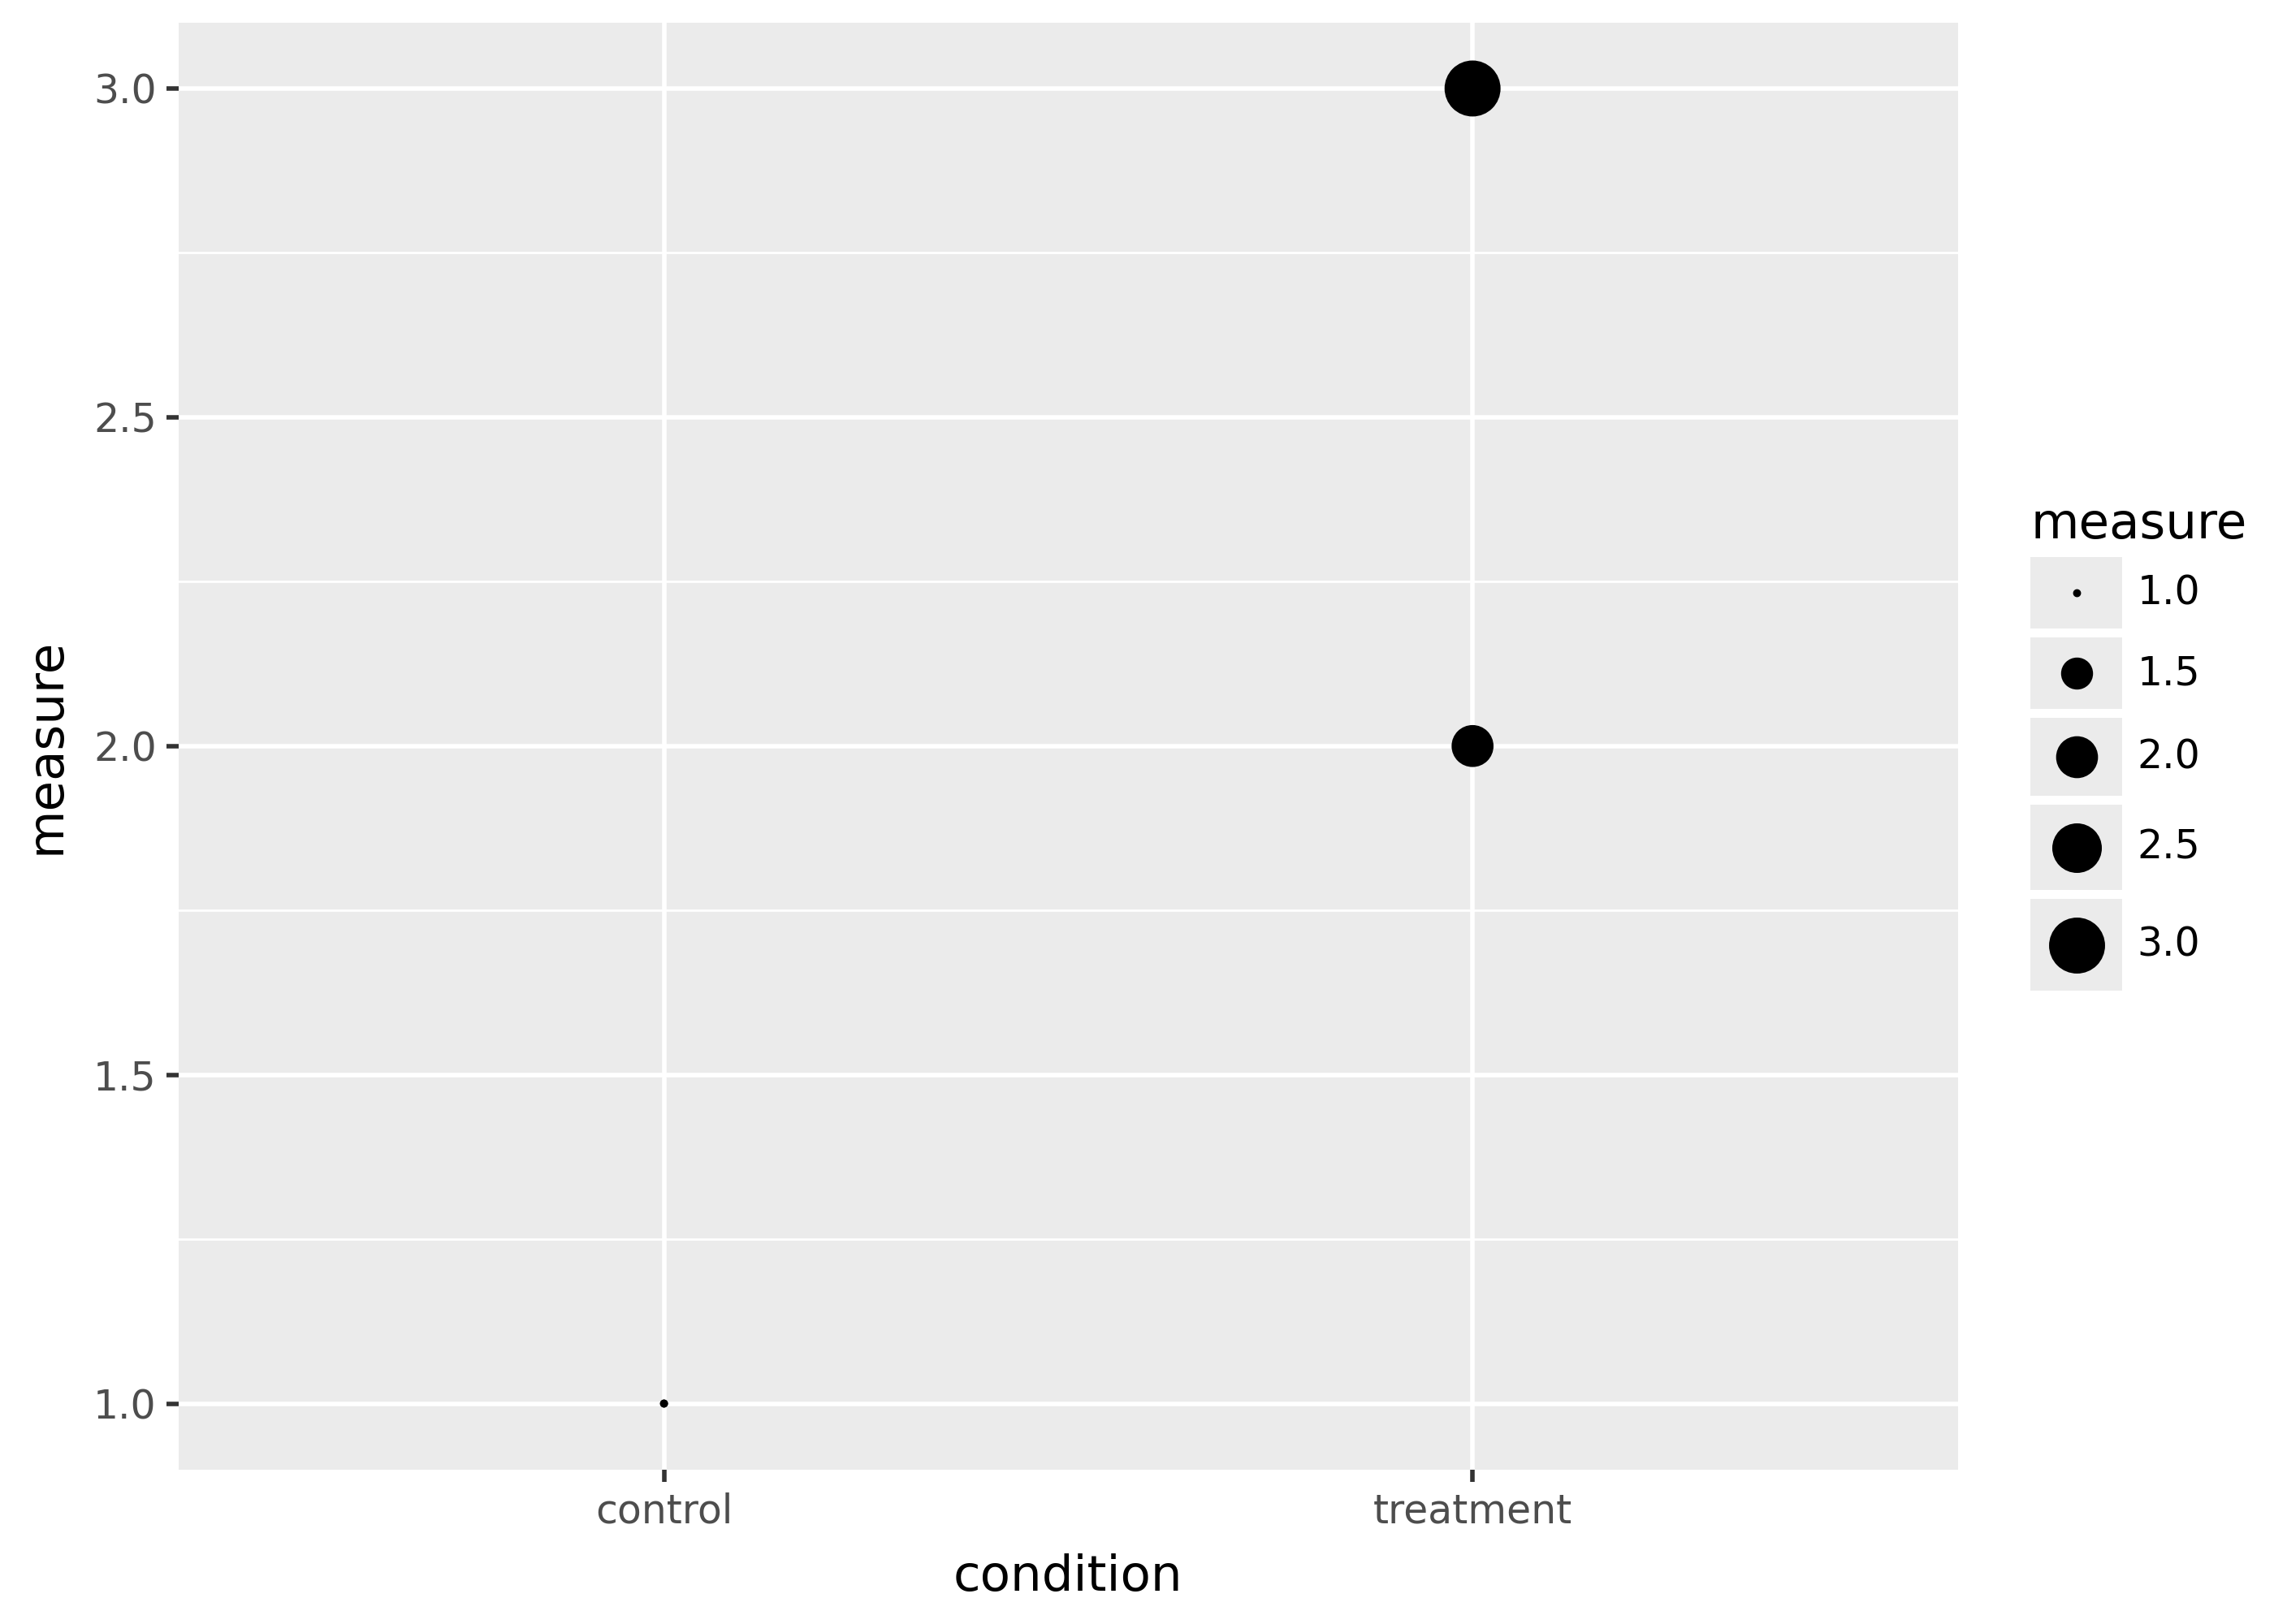
Size: choosing a style
p = (
    ggplot(df, aes("condition", "measure", group="group", size="measure"))
    + geom_point(aes(size="measure"))
)

p + scale_size_radius()
p + scale_size_area()