from plotnine import (
    ggplot,
    aes,
    geom_boxplot,
    geom_violin,
    geom_sina,
    labs,
    element_blank,
    theme,
    theme_xkcd,
    theme_538,
)
from plotnine.composition import Beside
from plotnine.data import mpg
In [1]:
In [2]:
p = ggplot(mpg, aes("factor(year)", "hwy")) + labs(x="year")

p1 = p + geom_boxplot()
p2 = p + geom_violin()
p3 = p + geom_sina()

p1 | p2 | p3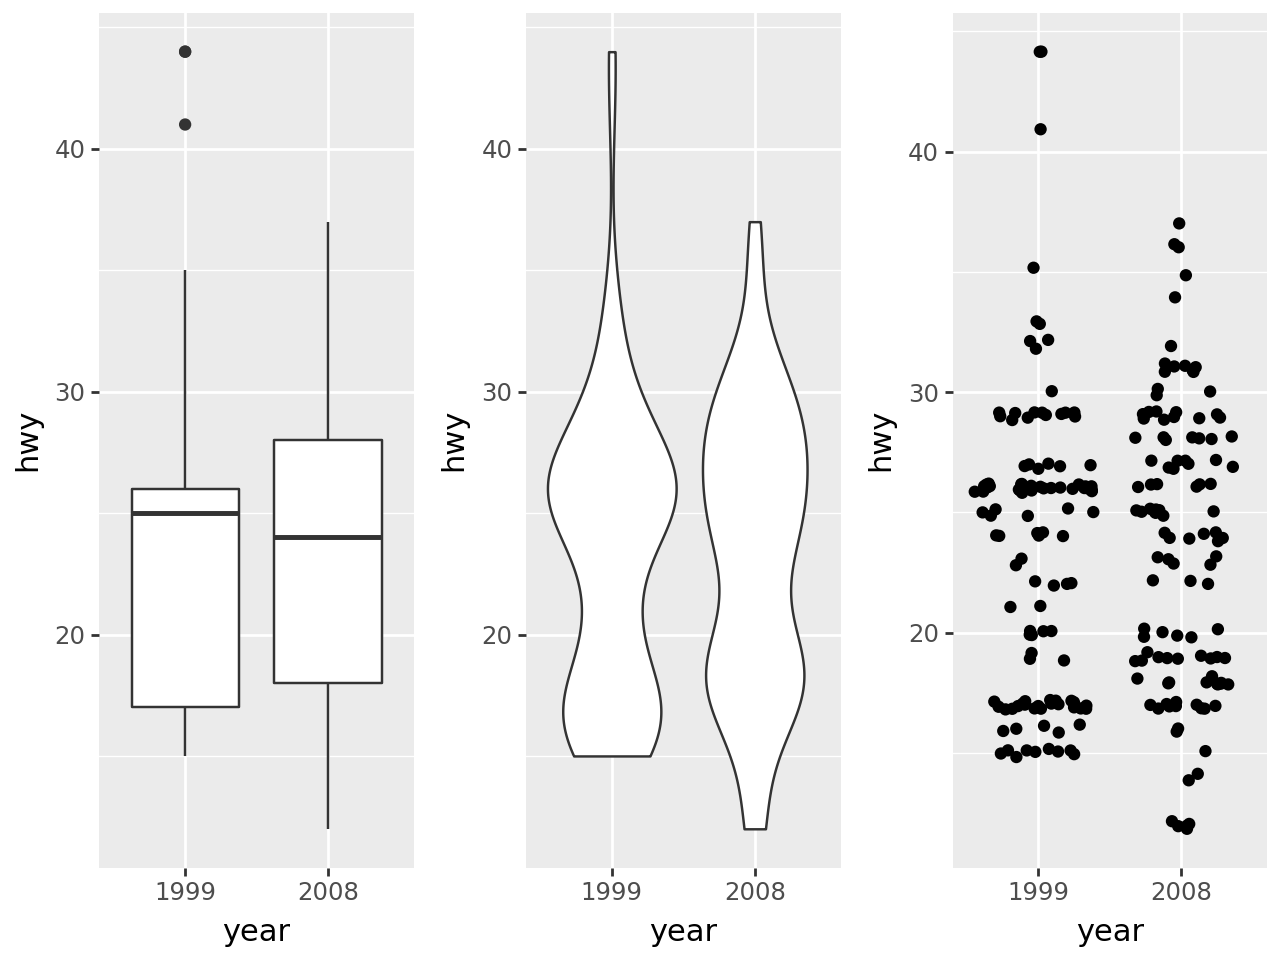
Which is equivalent to
In [3]:
Beside([p1, p2, p3])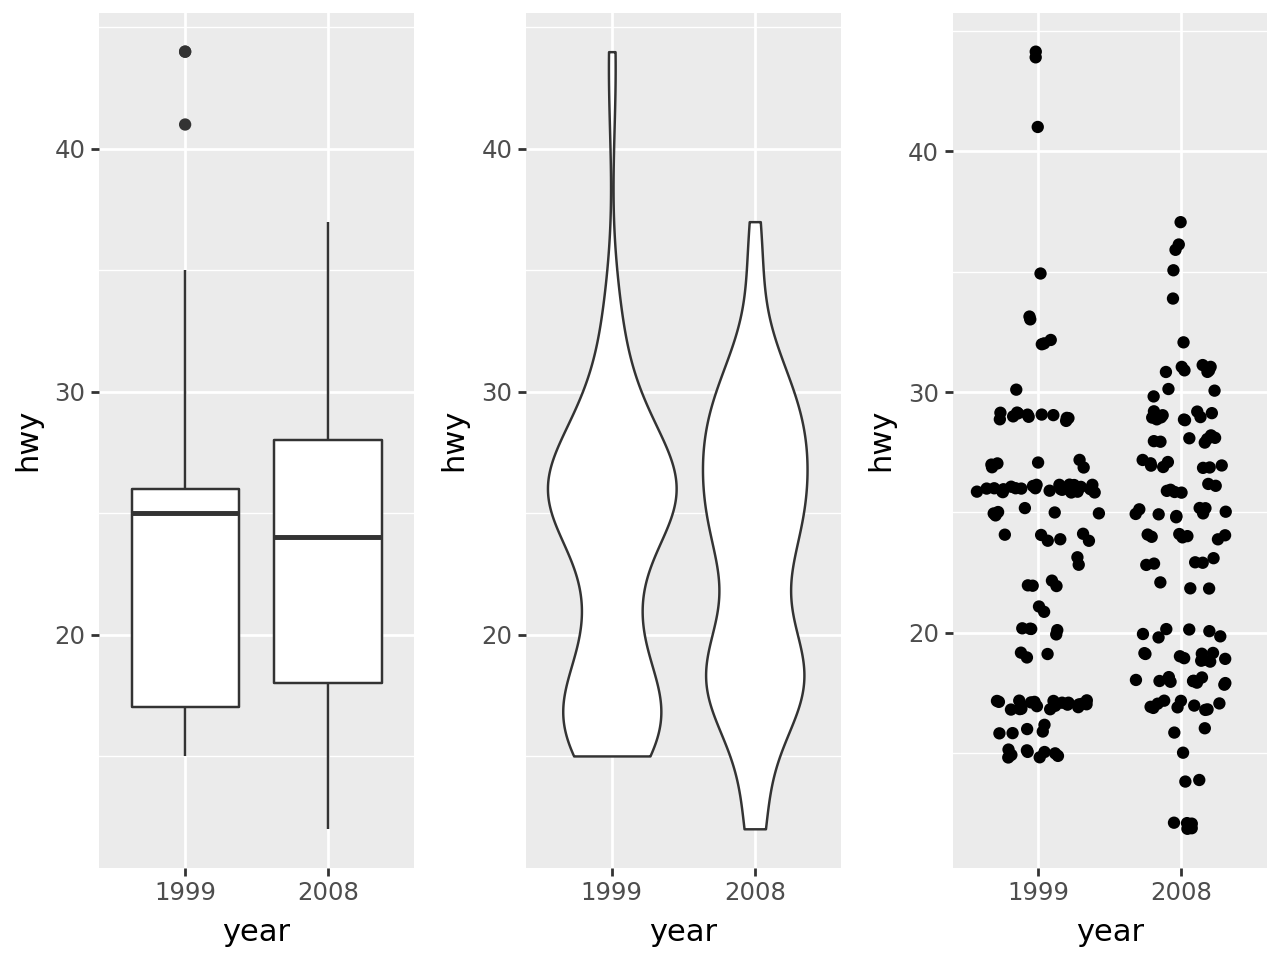
Remove unnecessary breaks and texts.
In [4]:
no_y = theme(
    axis_title_y=element_blank(),
    axis_text_y=element_blank(),
    axis_ticks_y=element_blank()
)
no_title_x = theme(axis_title_x=element_blank())

(p1 + no_title_x) | (p2 + no_y) | (p3 + no_y + no_title_x)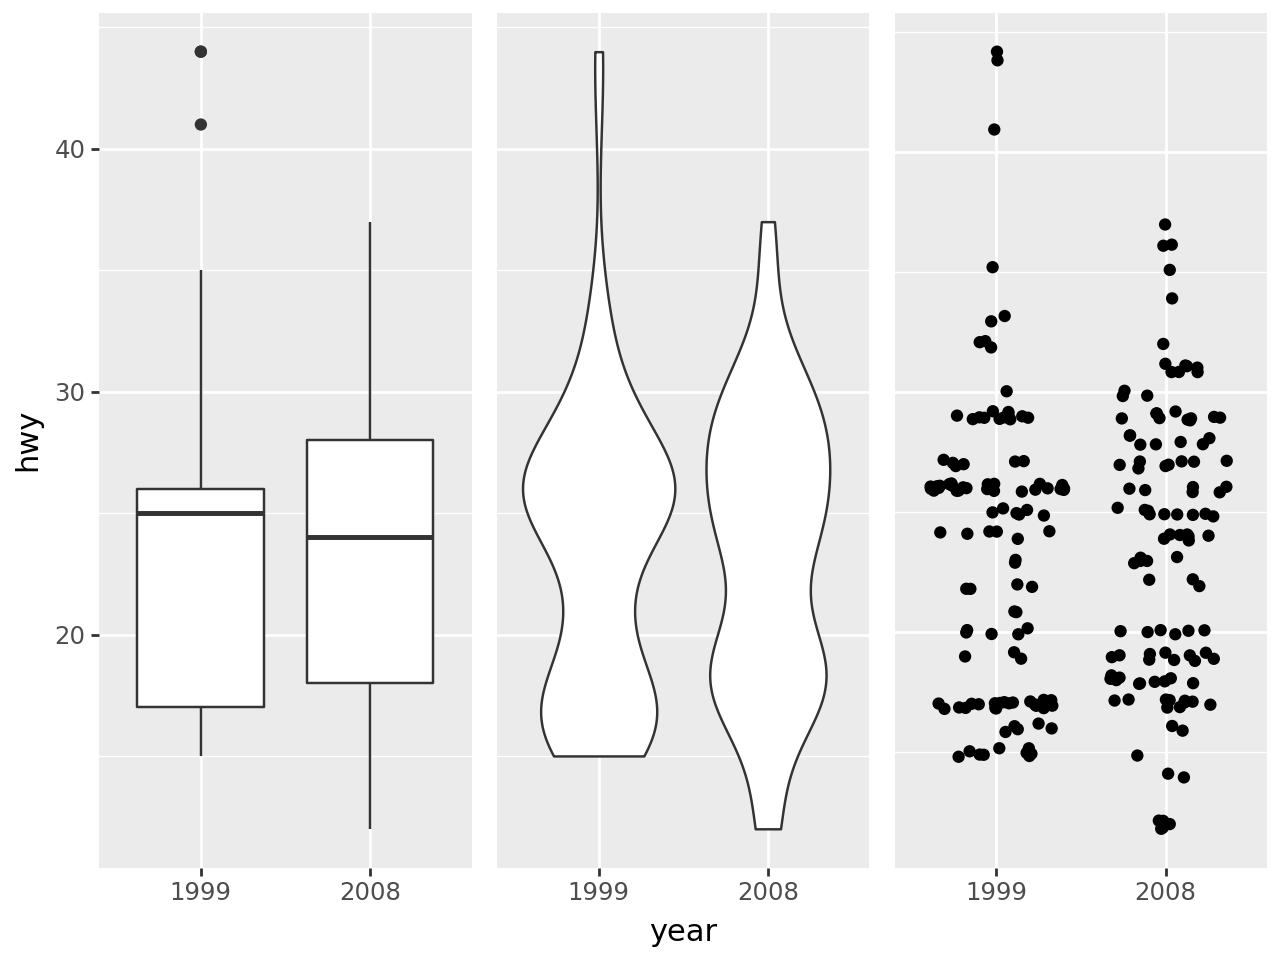
Each plot in the composition can have a completely different theme.
In [5]:
(p1 + theme_xkcd() + no_title_x) | (p2 + no_y) | (p3 + theme_538() + no_y + no_title_x)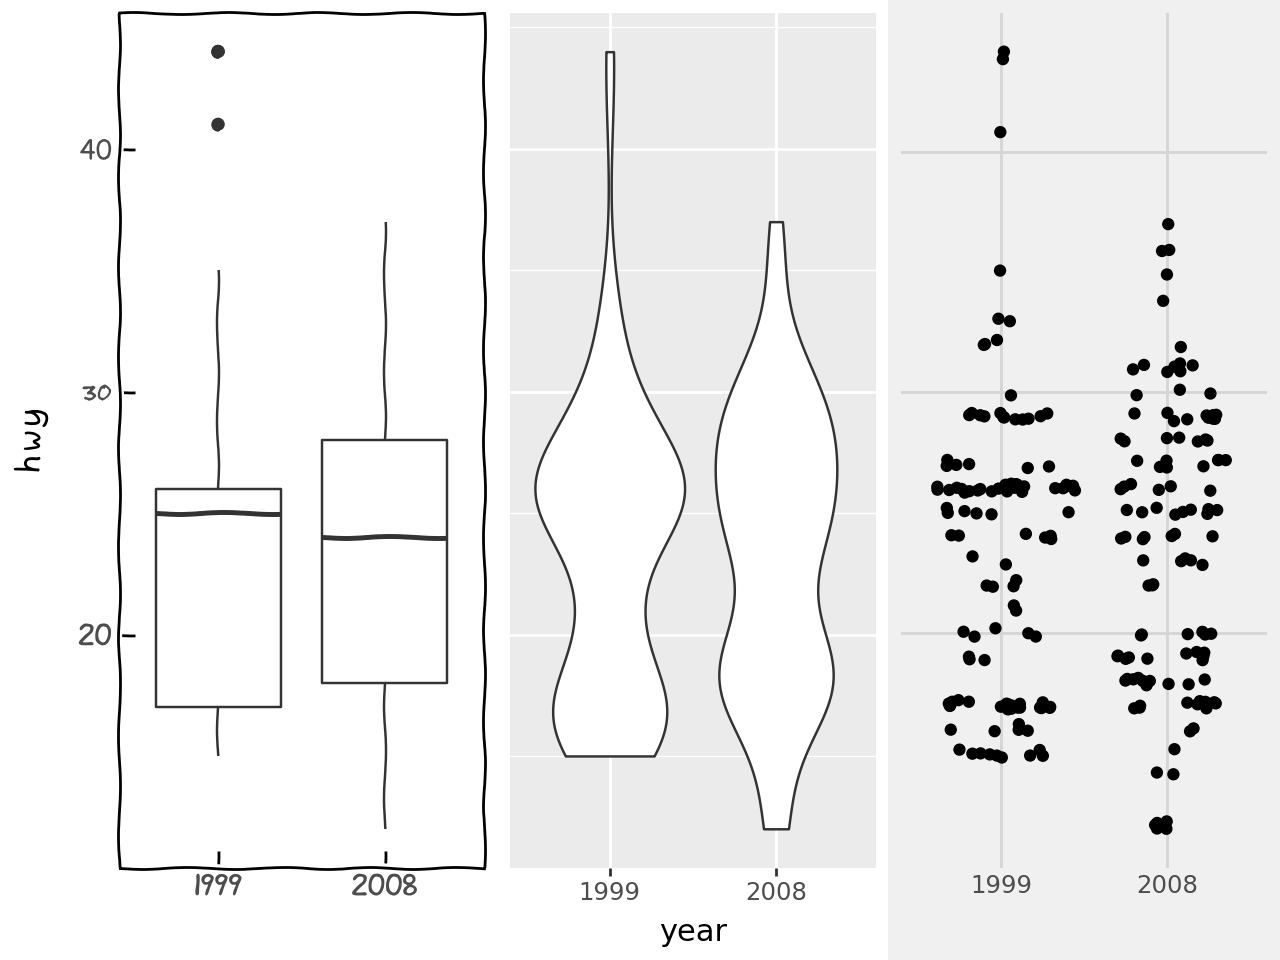
The space taken up by the plots and “sub-compositions” is distributed equally with in the group.
In [6]:
p1 | (p2 | p3)
Which is the same as:
Beside([p1, Beside([p2, p3])])