import pandas as pd
import numpy as np
from plotnine import ggplot, aes, geom_path, theme, theme_void, lims
from plotnine.animation import PlotnineAnimation

# for animation in the notebook
from matplotlib import rc

rc("animation", html="html5")Spiral Animation ###
In [1]:
How to create Animations
The PlotnineAnimation methods takes a sequence of plots and animates them. The best way to create the sequence is to use a function that generates plots.
NOTE: When creating the plots make sure all the plots have scales with the same limits for each aesthetic, including the x and y aesthetics.
In [2]:
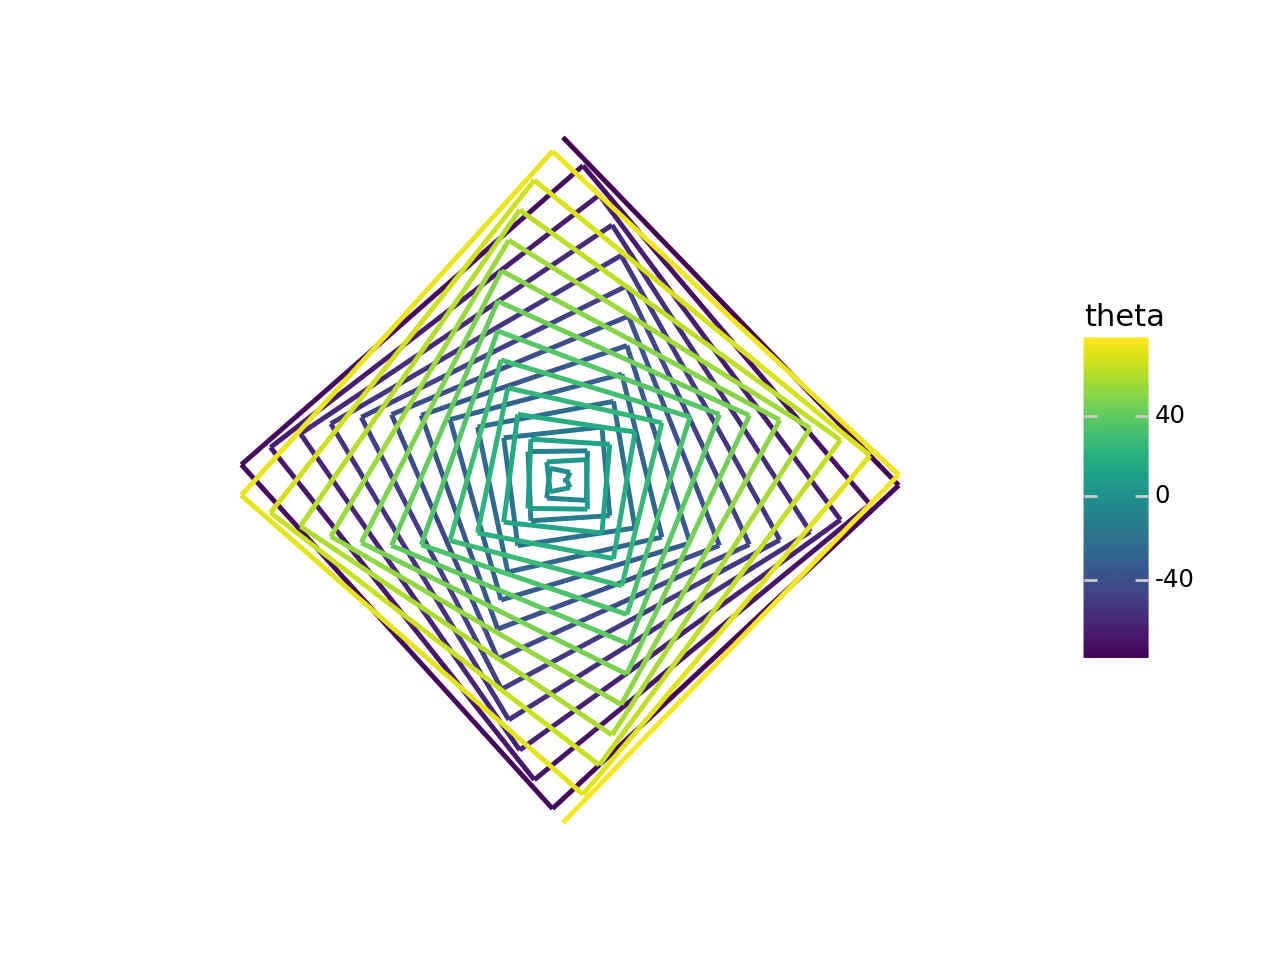
# Parameters used to control the spiral
n = 100
tightness = 1.3
kmin = 1
kmax = 25
num_frames = 25
theta = np.linspace(-np.pi, np.pi, n)


def plot(k):
    # For every plot we change the theta
    _theta = theta * k

    # Polar Equation of each spiral
    r = tightness * _theta

    df = pd.DataFrame({
        "theta": _theta,
        "r": r,
        "x": r * np.sin(_theta),
        "y": r * np.cos(_theta)
    })

    p = (
        ggplot(df)
        + geom_path(aes("x", "y", color="theta"), size=1)
        + lims(
            # All the plots have scales with the same limits
            x=(-130, 130),
            y=(-130, 130),
            color=(-kmax * np.pi, kmax * np.pi),
        )
        + theme_void()
        + theme(aspect_ratio=1)
    )
    return p


# It is better to use a generator instead of a list
plots = (plot(k) for k in np.linspace(kmin, kmax, num_frames))
ani = PlotnineAnimation(plots, interval=100, repeat_delay=500)
# ani.save('/tmp/animation.mp4')
aniThe final image of the spiral
In [3]:
# Gallery Plot

plot(kmax)