import pandas as pd

from plotnine import ggplot, aes, after_scale, geom_bar, theme_classicafter_scale
In [1]:
The bars in geom_bar have two aesthetics that control the coloring; fill for the interior and color for the boundary/edge. Using after_scale we can create a matching combination of these two.
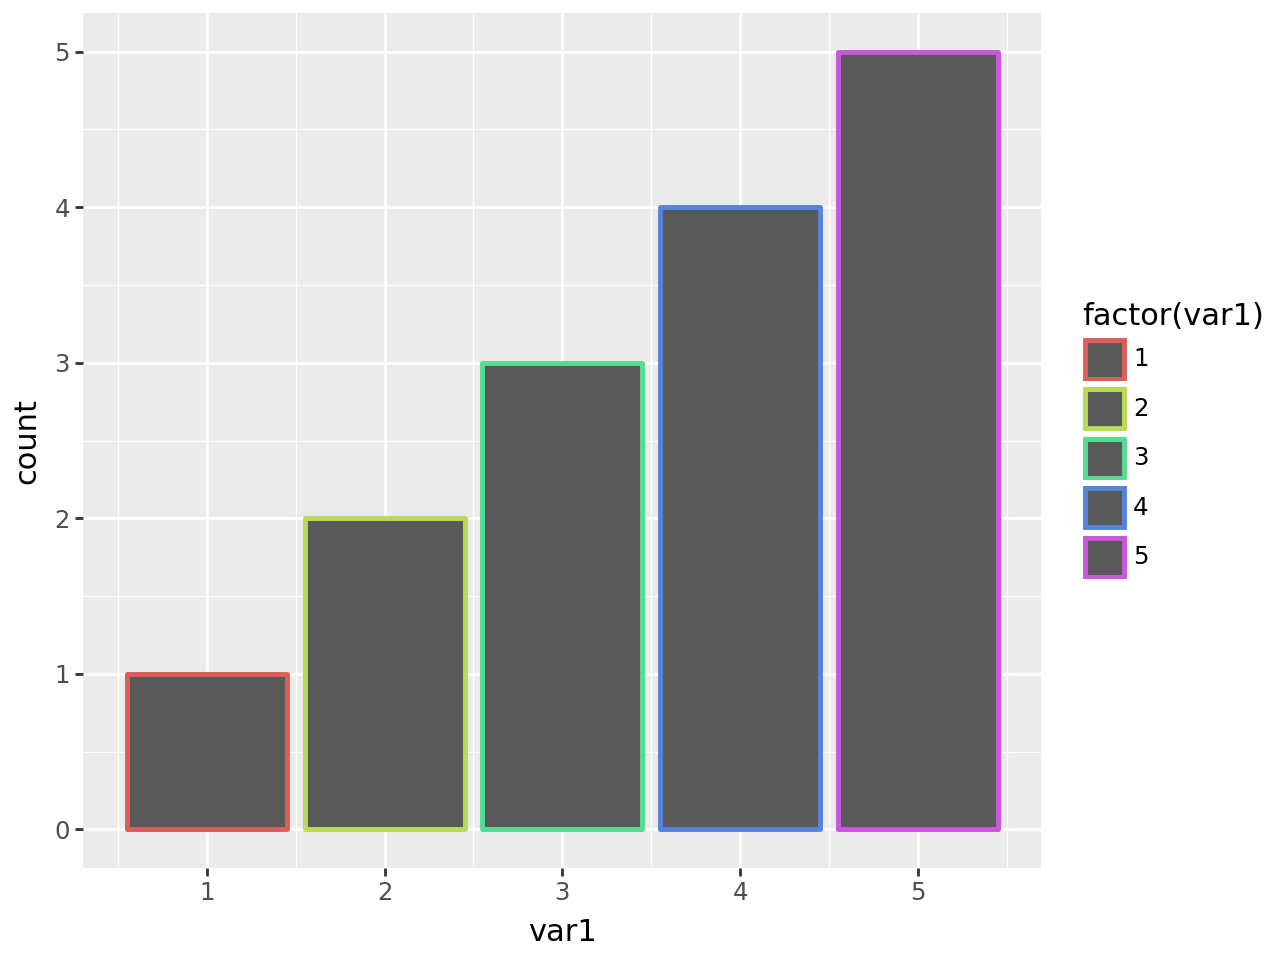
Start off with a mapping to the color.
In [2]:
df = pd.DataFrame({"var1": [1, 2, 2, 3, 3, 3, 4, 4, 4, 4, 5, 5, 5, 5, 5]})

(
    ggplot(df, aes("var1", color="factor(var1)"))
    + geom_bar(size=1)
)
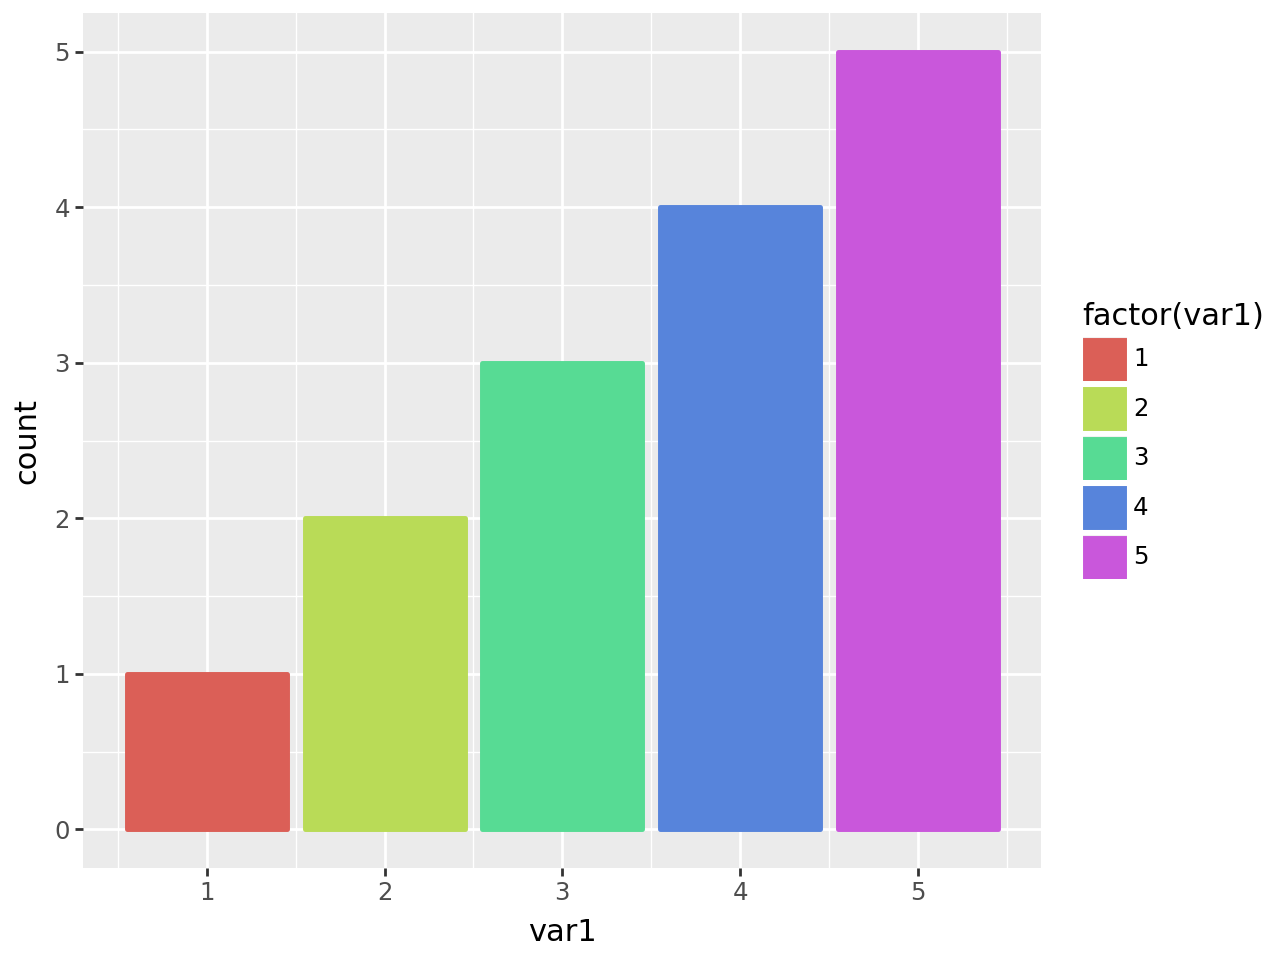
We can match the color with the fill.
In [3]:
(
    ggplot(df, aes("var1", color="factor(var1)"))
    + geom_bar(aes(fill=after_scale("color")), size=1)
)
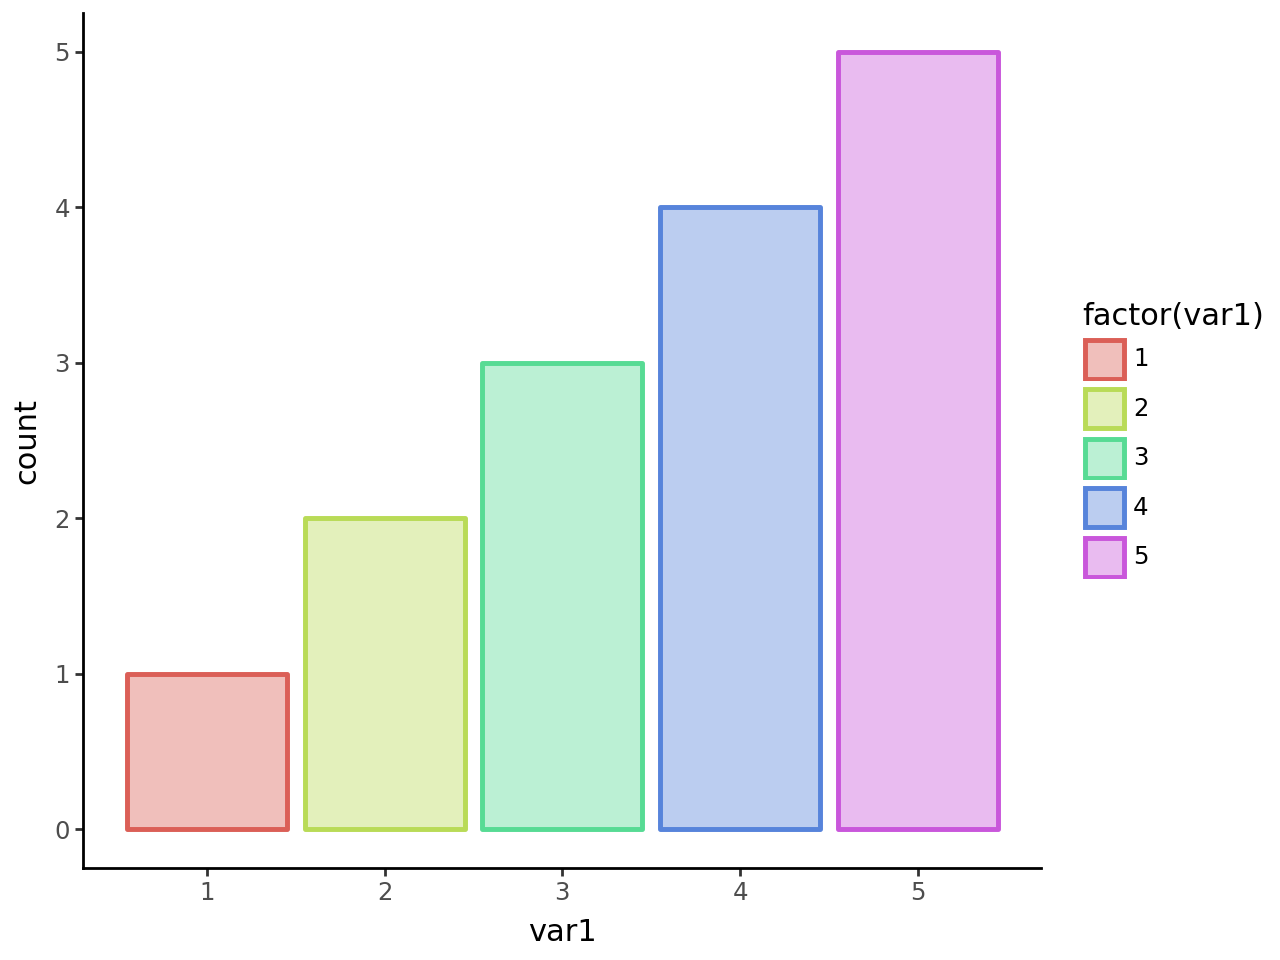
As after_scale takes an expression, for the fill aesthetic we can modify the color by adding to it an alpha channel i.e. '#AABBCC' to '#AABBCC66'.
In [4]:
(
    ggplot(df, aes("var1", color="factor(var1)"))
    + geom_bar(aes(fill=after_scale('color + "66"')), size=1)
)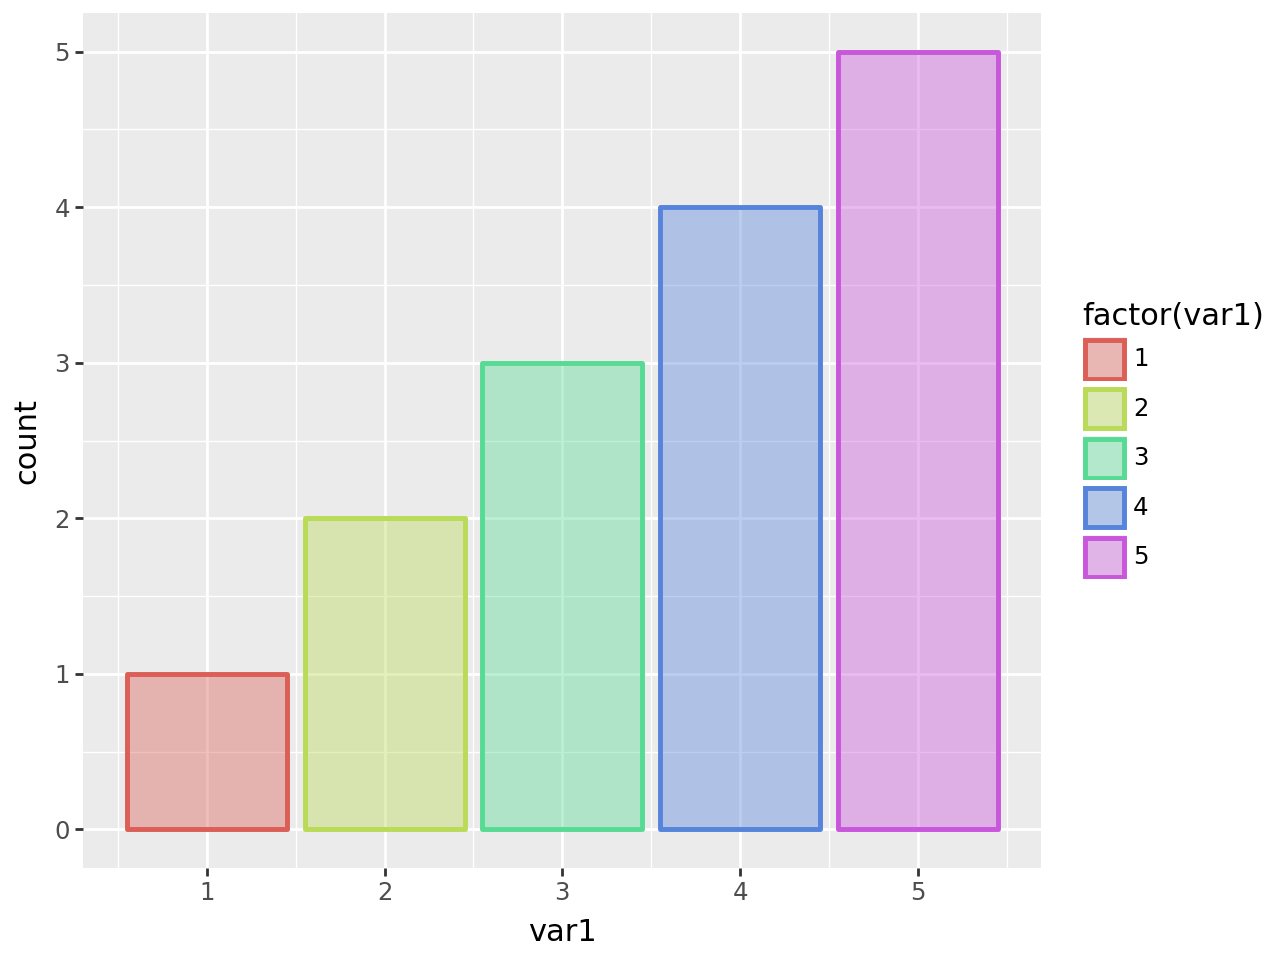
We rely on the fact that you can append a string to all elements of a pandas series
pd.Series(['#AABBCC', '#112233']) + '66' == pd.Series(['#AABBCC66', '#11223366'])With a fitting theme.
In [5]:
(
    ggplot(df, aes("var1", color="factor(var1)"))
    + geom_bar(aes(fill=after_scale('color + "66"')), size=1)
    + theme_classic()
)