from plotnine import ggplot, aes, geom_bar
from plotnine.data import mtcars

ggplot(mtcars, aes(x="factor(cyl)")) + geom_bar()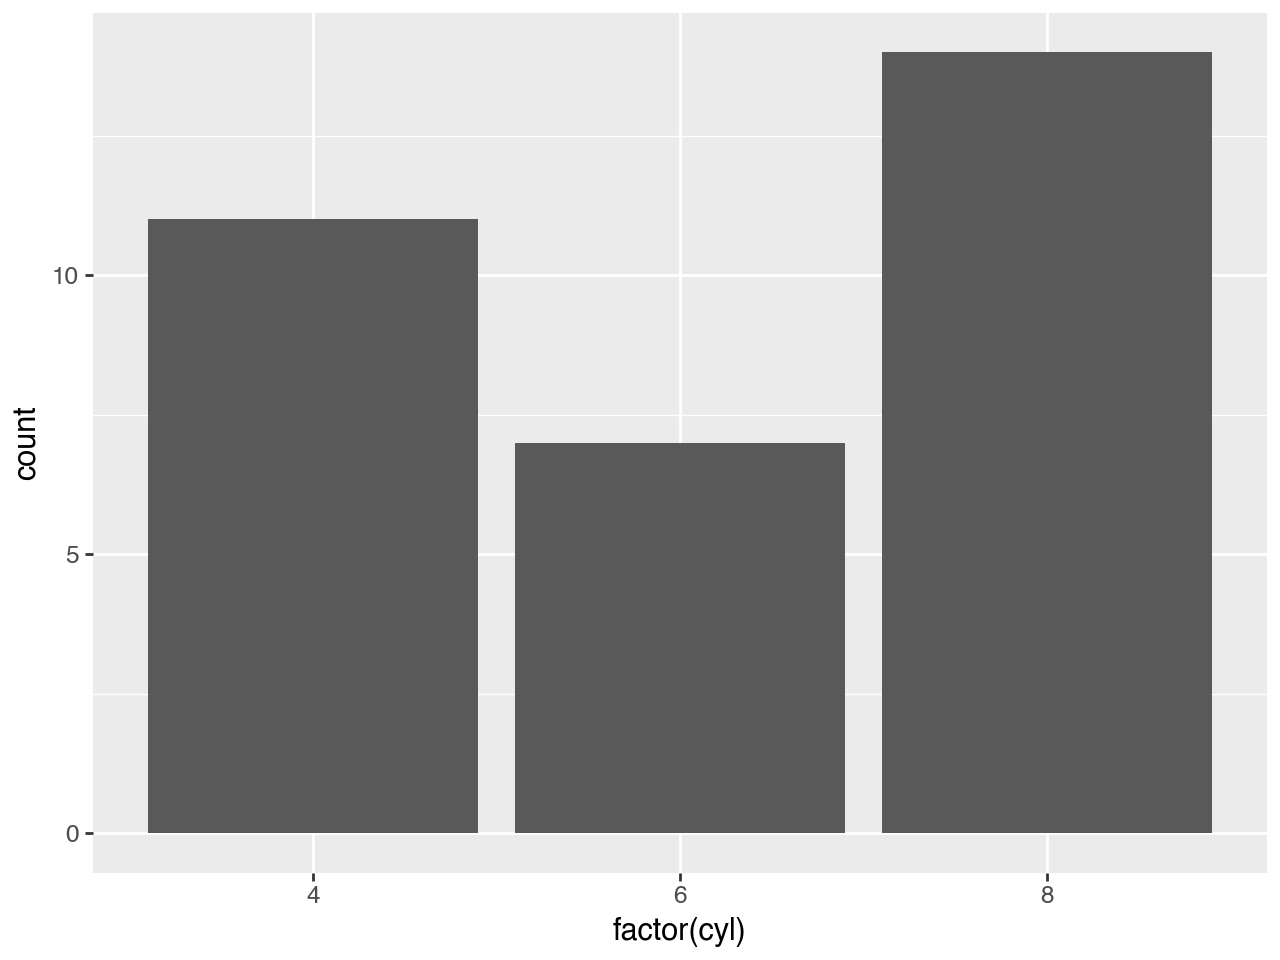
from plotnine import ggplot, aes, geom_bar
from plotnine.data import mtcars
ggplot(mtcars, aes(x="factor(cyl)")) + geom_bar()