from plotnine import ggplot, aes, geom_point, geom_hline, facet_grid, labs
from plotnine.data import mpgHorizontal line
In [1]:
geom_hline() draws a vertical line, and is useful as a guide.
In [2]:
mpg.head()| manufacturer | model | displ | year | cyl | trans | drv | cty | hwy | fl | class | |
|---|---|---|---|---|---|---|---|---|---|---|---|
| 0 | audi | a4 | 1.8 | 1999 | 4 | auto(l5) | f | 18 | 29 | p | compact |
| 1 | audi | a4 | 1.8 | 1999 | 4 | manual(m5) | f | 21 | 29 | p | compact |
| 2 | audi | a4 | 2.0 | 2008 | 4 | manual(m6) | f | 20 | 31 | p | compact |
| 3 | audi | a4 | 2.0 | 2008 | 4 | auto(av) | f | 21 | 30 | p | compact |
| 4 | audi | a4 | 2.8 | 1999 | 6 | auto(l5) | f | 16 | 26 | p | compact |
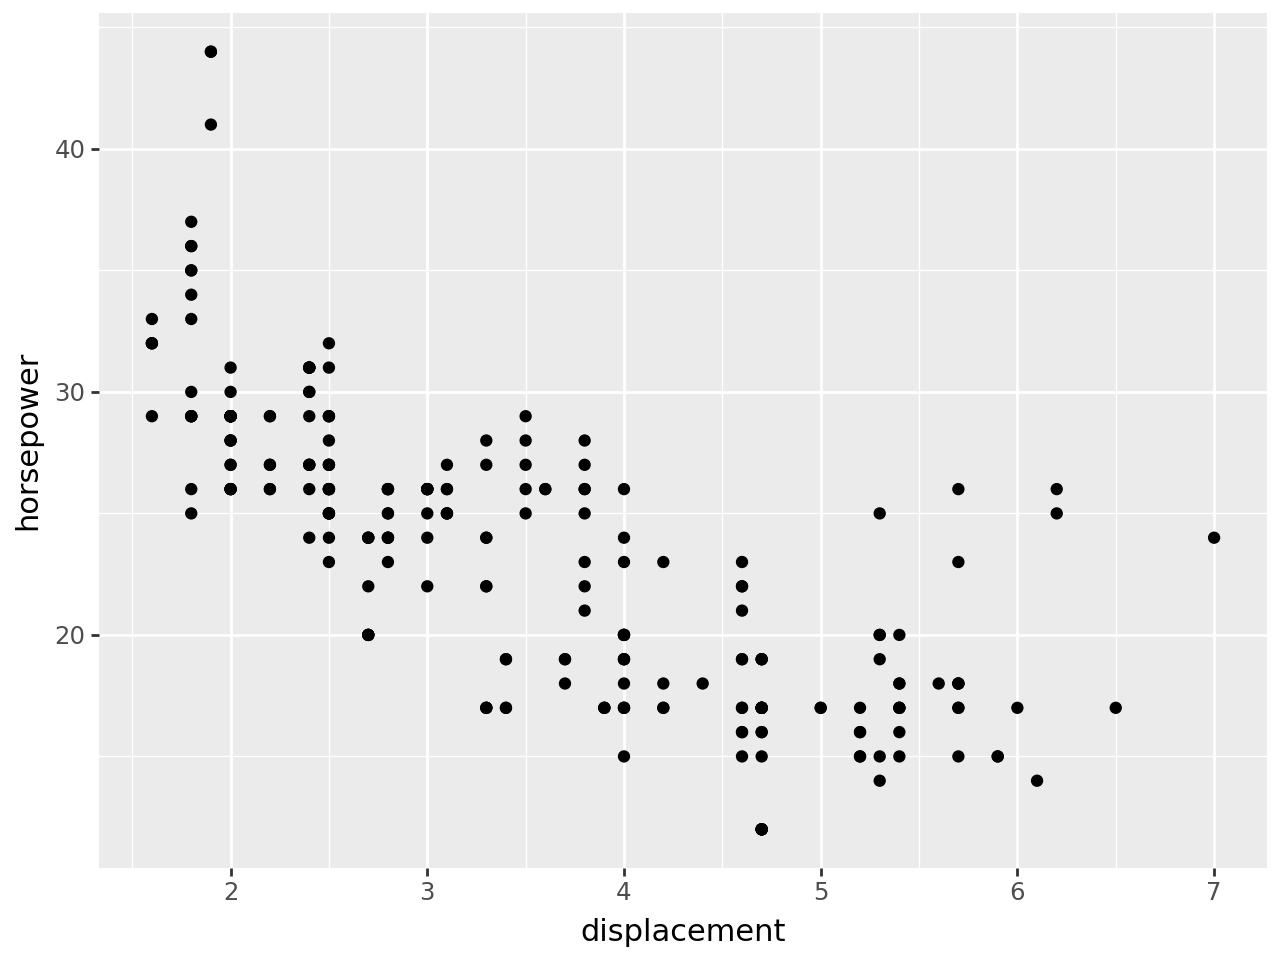
It’s useful to use geom_hline() with some data, so we start with a basic scatter plot:
In [3]:
(
    ggplot(mpg, aes(x="displ", y="hwy"))
    + geom_point()
    + labs(x="displacement", y="horsepower")
)
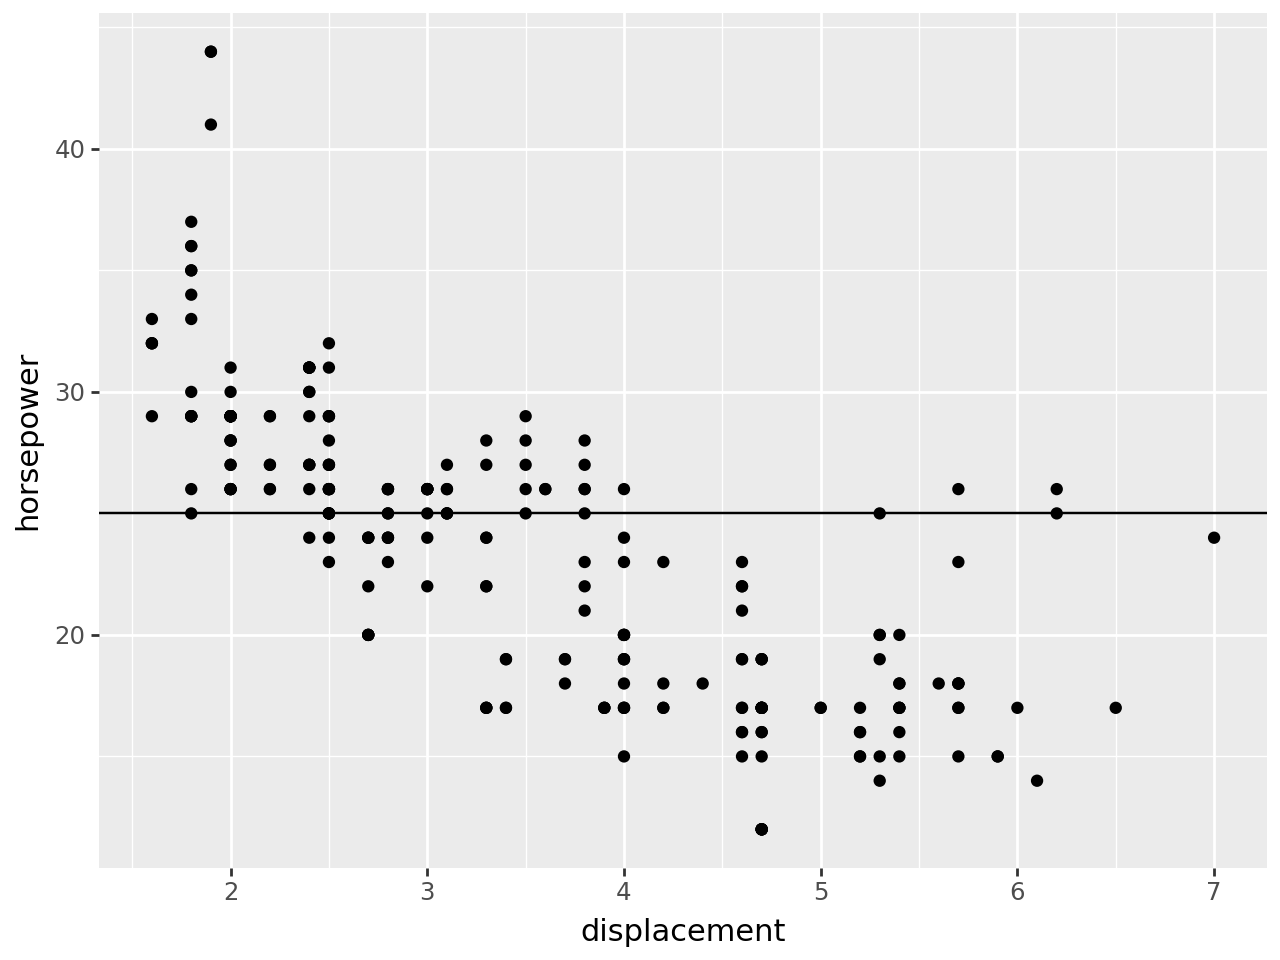
Now add a horizontal line to the scatter plot:
In [4]:
(
    ggplot(mpg, aes(x="displ", y="hwy"))
    + geom_point()
    + geom_hline(yintercept=25)  # add one horizonal line
    + labs(x="displacement", y="horsepower")
)
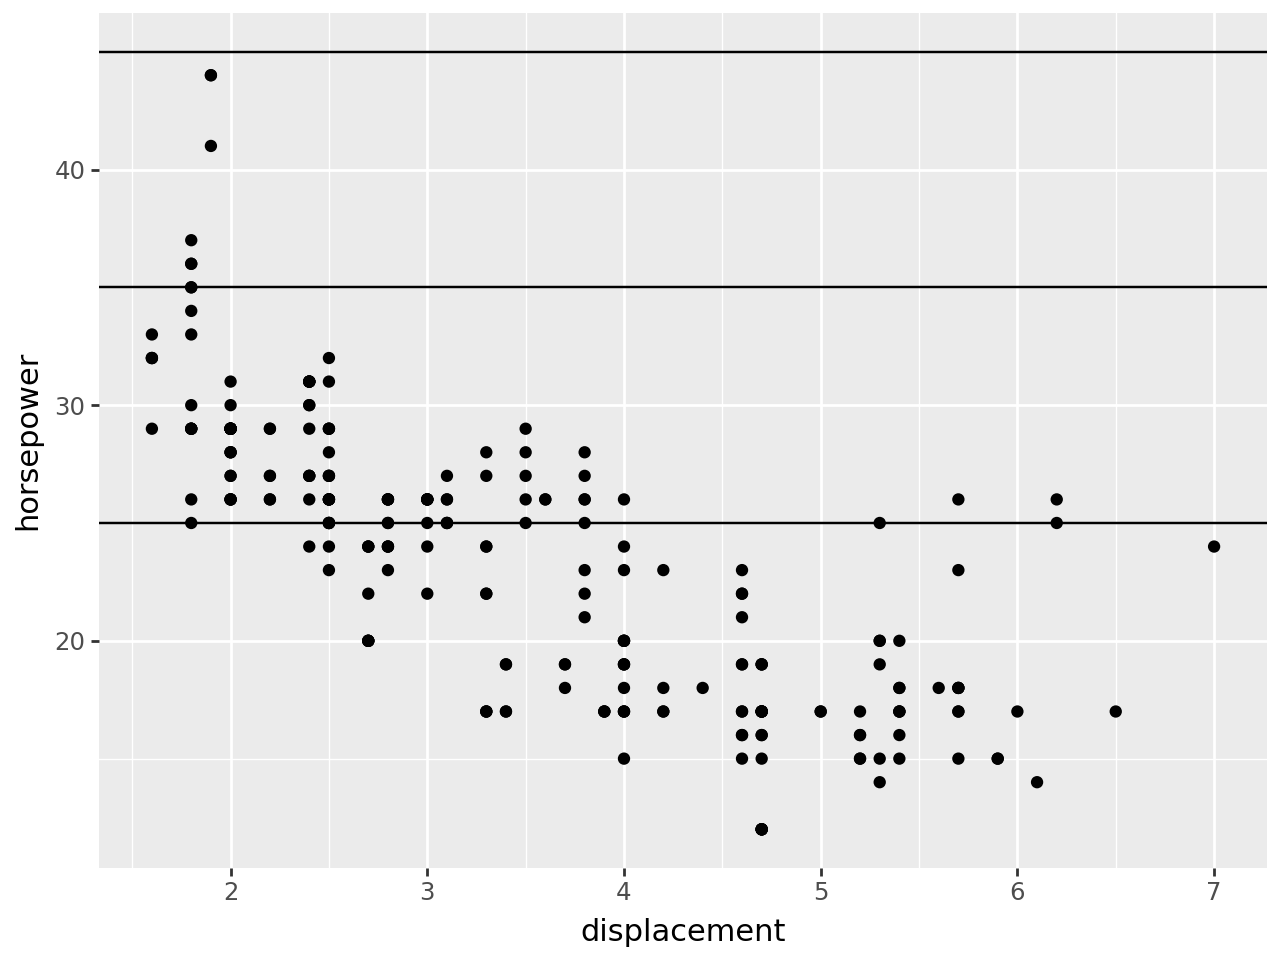
You can add many horizontal lines:
In [5]:
(
    ggplot(mpg, aes(x="displ", y="hwy"))
    + geom_point()
    + geom_hline(yintercept=[25, 35, 45])  # add many horizontal lines using a list
    + labs(x="displacement", y="horsepower")
)
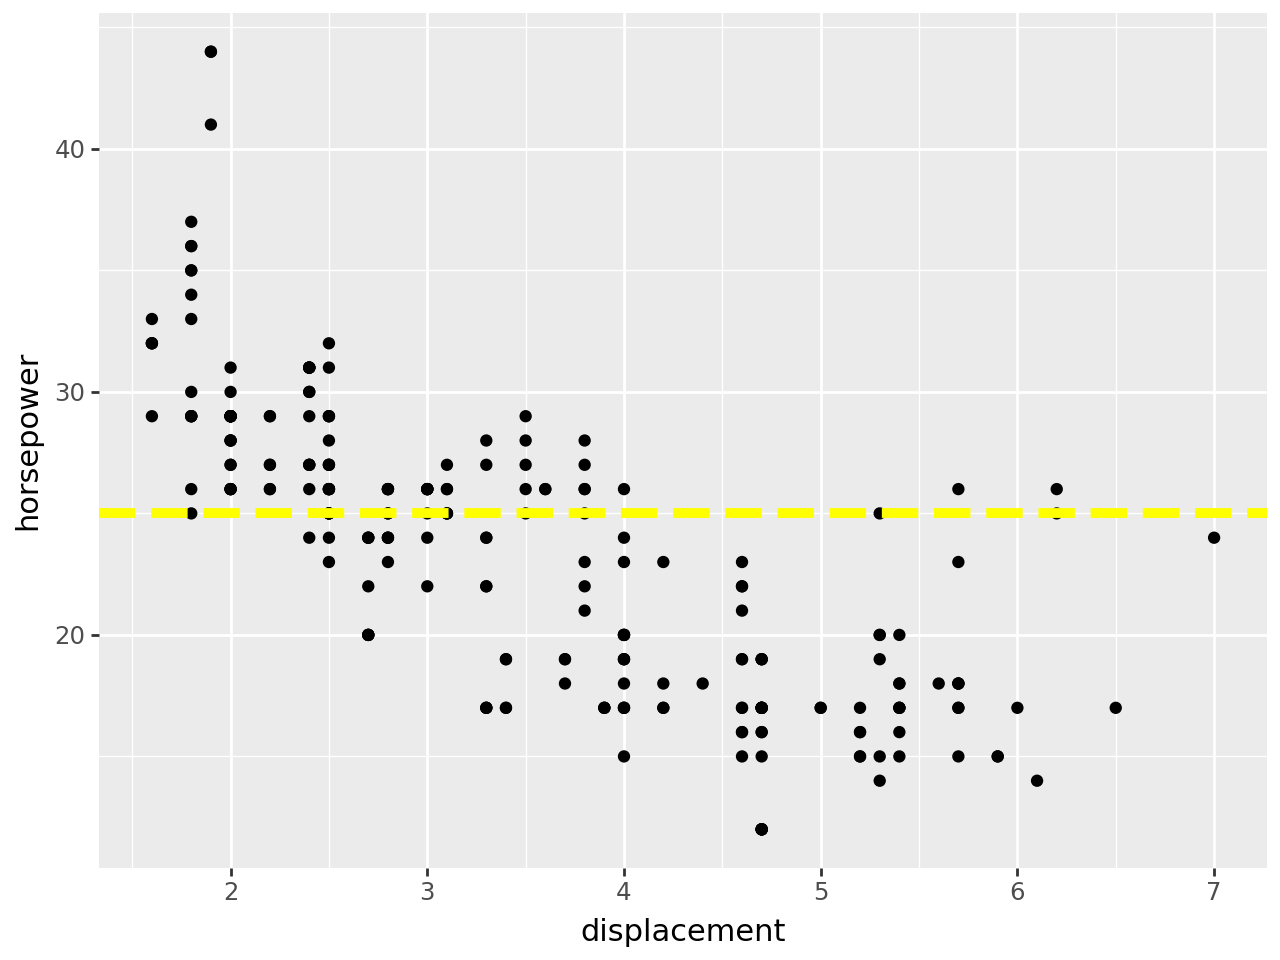
You can change the look of the line:
In [6]:
(
    ggplot(mpg, aes(x="displ", y="hwy"))
    + geom_point()
    + geom_hline(
        yintercept=25,
        color="yellow",  # set line colour
        size=2,  # set line thickness
        linetype="dashed",  # set line type
    )
    + labs(x="displacement", y="horsepower")
)
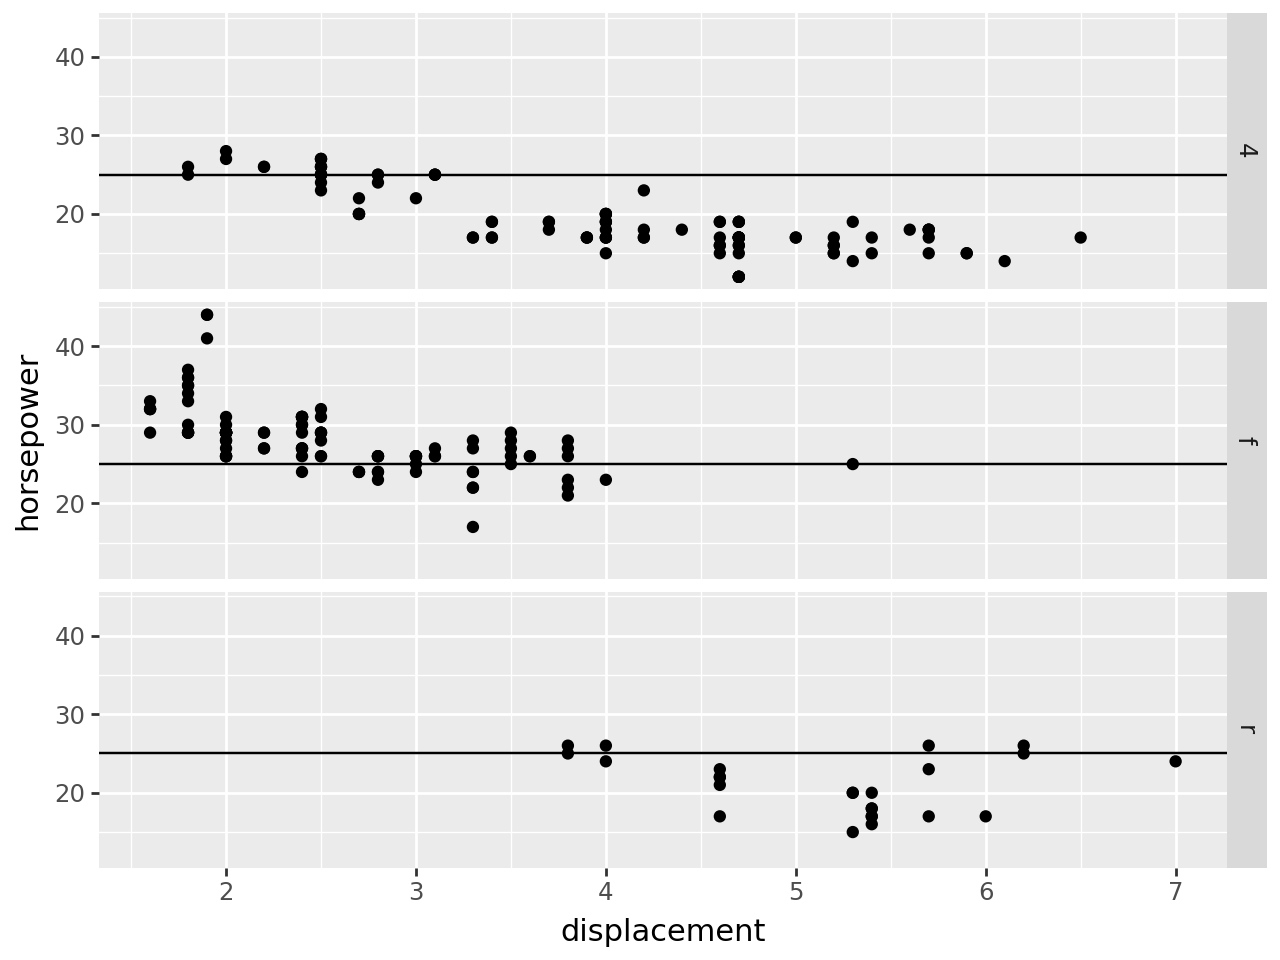
And you can add horizontal lines to a facet plot:
In [7]:
(
    ggplot(mpg, aes(x="displ", y="hwy"))
    + geom_point()
    + geom_hline(yintercept=25)  # add a vertical line...
    + facet_grid("drv")  # ... to a facet plot
    + labs(x="displacement", y="horsepower")
)