import pandas as pd
from plotnine import (
    ggplot,
    aes,
    geom_point,
    geom_line,
    geom_linerange,
    element_blank,
    element_rect,
    theme,
    theme_matplotlib,
    theme_set,
)

# Set default theme
# matplotlib + the background of 538
theme_set(
    theme_matplotlib()
    + theme(
        plot_background=element_rect(fill="#F0F0F0"),
        panel_background=element_rect(fill="#F0F0F0"),
    )
)Upper & Lower Trends
In [1]:
The data
In [2]:
df = pd.DataFrame({
"x": range(0, 6),
"y": [3, 4, 3.5, 4.5, 4, 4]
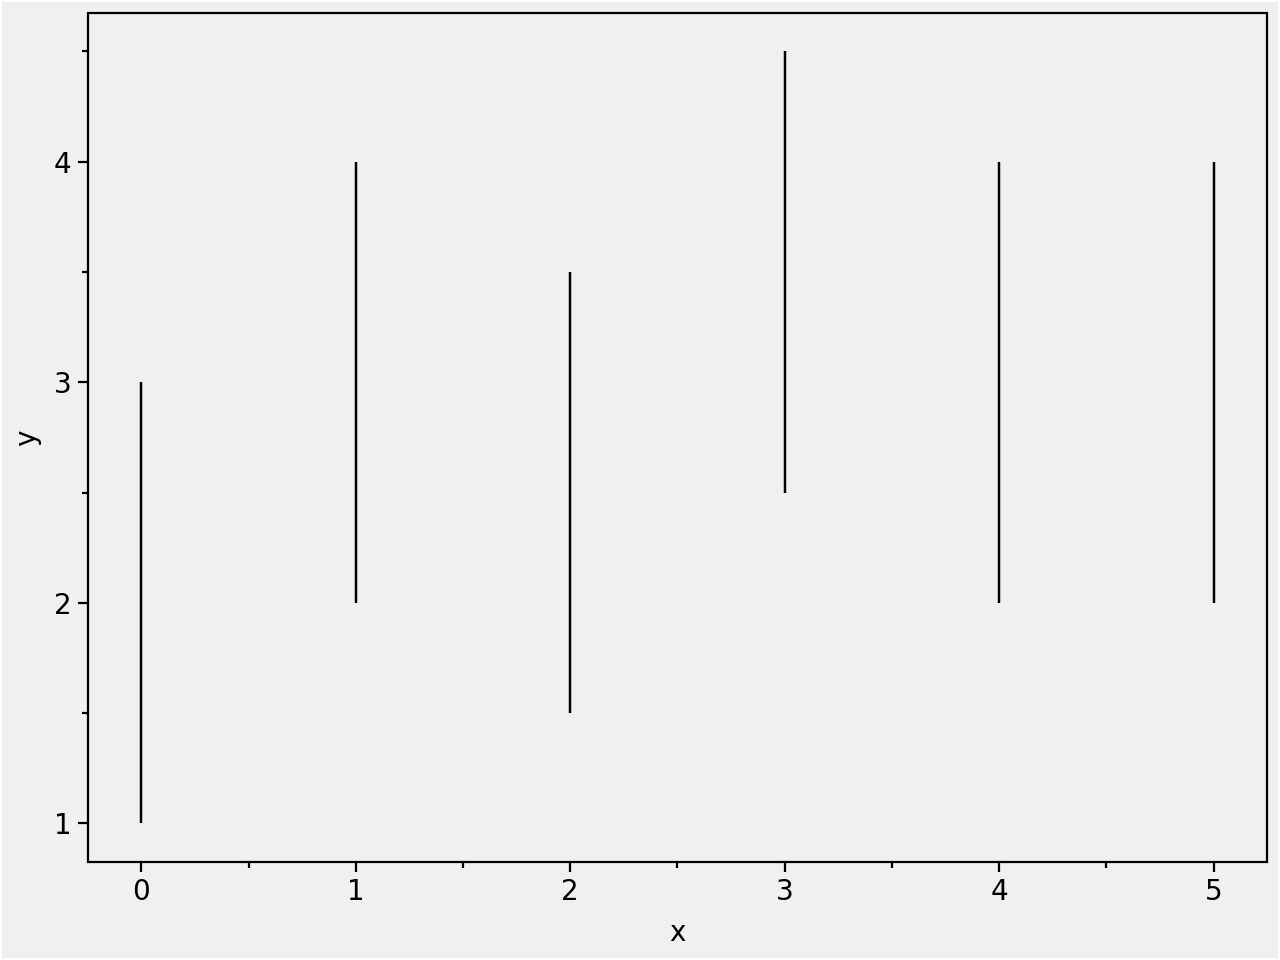
})Create the line ranges
In [3]:
(ggplot(df, aes("x", "y"))
 + geom_linerange(aes(ymin="y-2", ymax="y"))
)
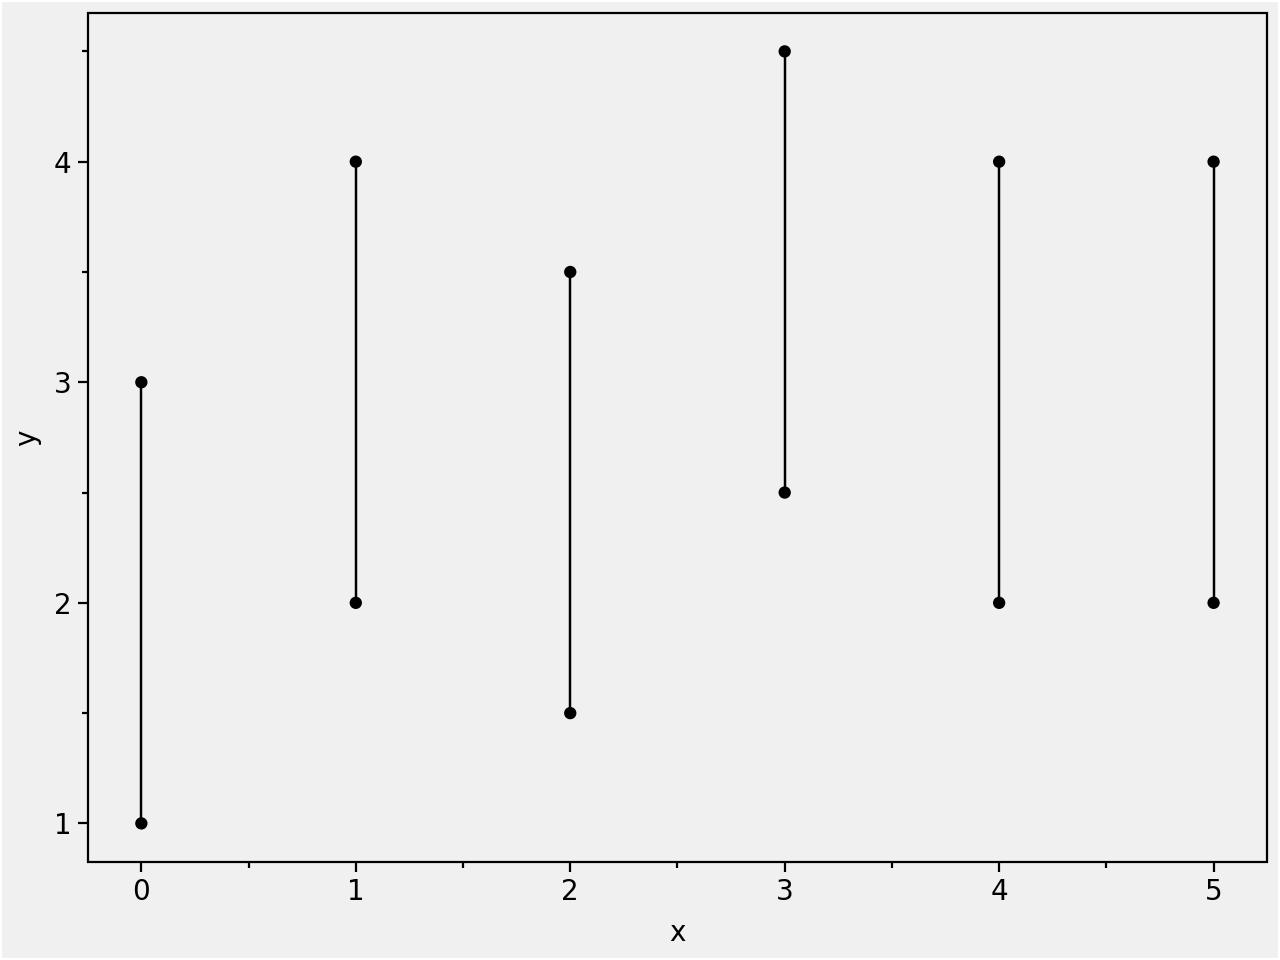
Add points at each end of the ranges.
In [4]:
(ggplot(df, aes("x", "y"))
 + geom_linerange(aes(ymin="y-2", ymax="y"))
 + geom_point()
 + geom_point(aes(y="y-2"))

)
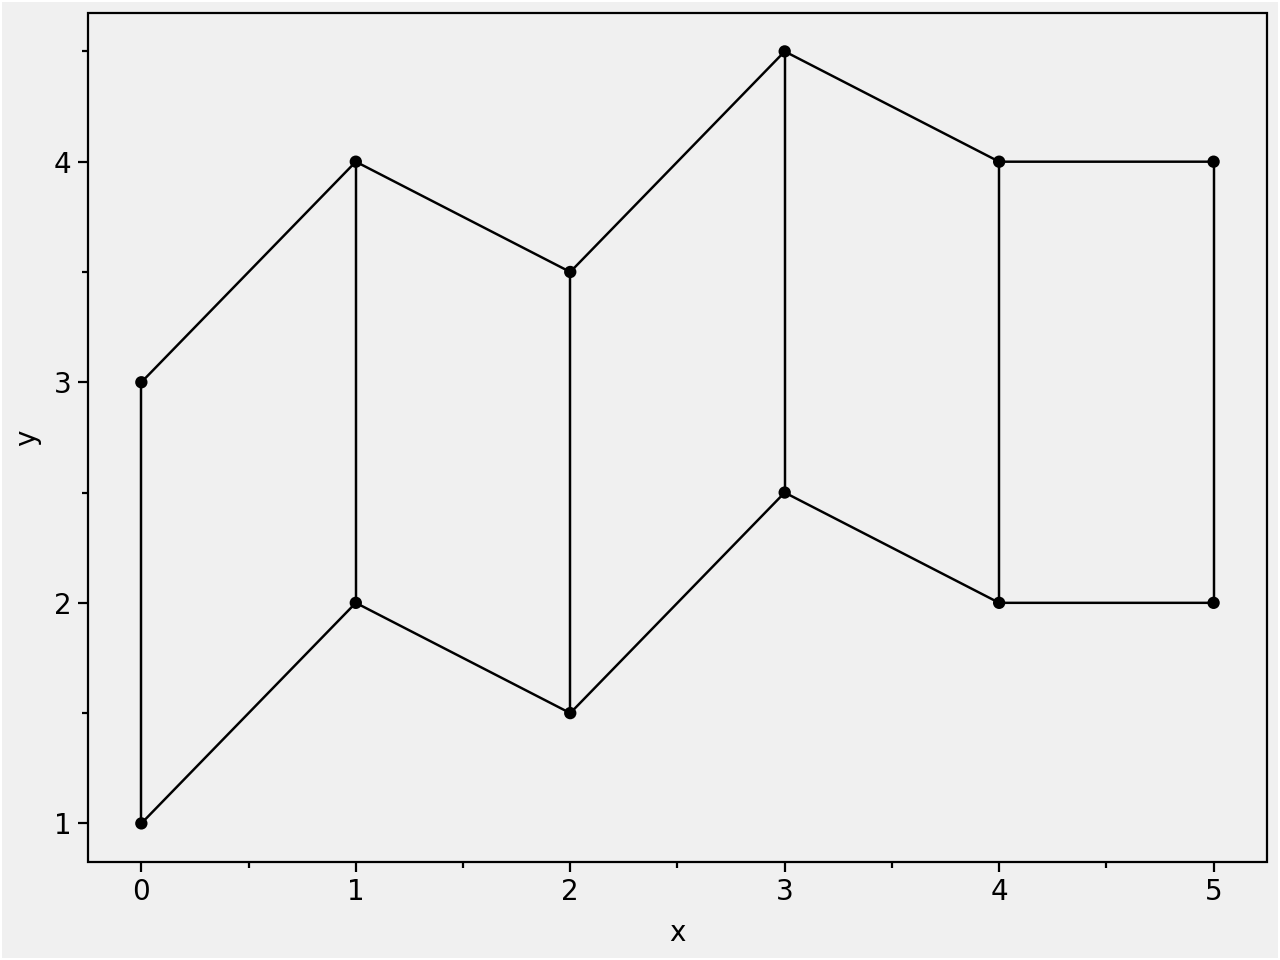
Add a trend-line along the top of the ranges and one along the bottom of the ranges. The line is added before(below) the points.
In [5]:
(ggplot(df, aes("x", "y"))
 + geom_linerange(aes(ymin="y-2", ymax="y"))

 + geom_line()
 + geom_point()

 + geom_line(aes(y="y-2"))
 + geom_point(aes(y="y-2"))

)
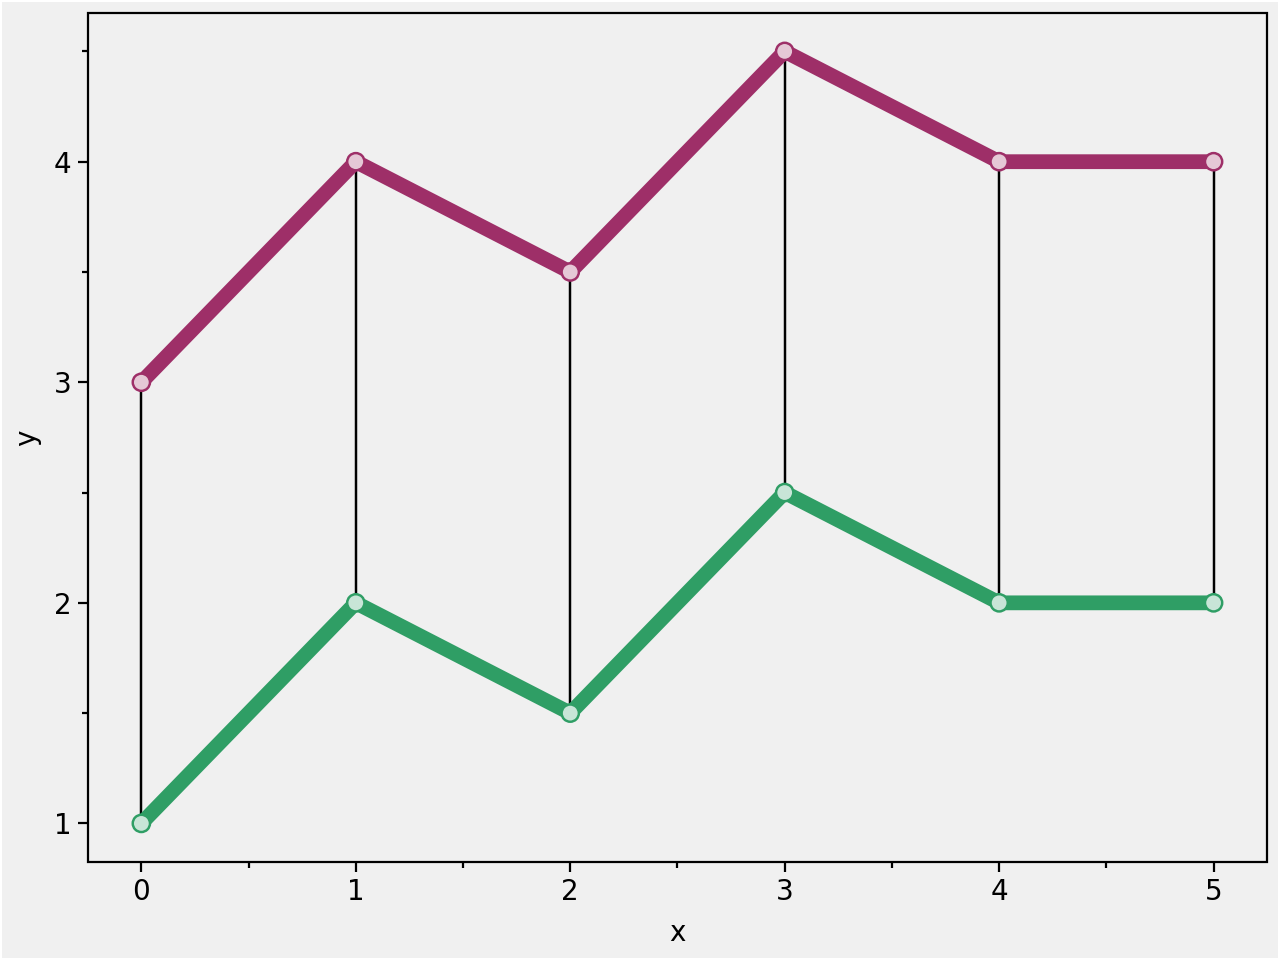
Add some color.
In [6]:
# Gallery, lines
magenta = "#9E2F68"
magenta_light = "#E5C8D6"

sea_green = "#2F9E65"
sea_green_light = "#C8E5D7"

(ggplot(df, aes("x", "y"))
 + geom_linerange(aes(ymin="y-2", ymax="y"))

 + geom_line(color=magenta, size=3)
 + geom_point(color=magenta, fill=magenta_light, size=3, stroke=0.5)

 + geom_line(aes(y="y-2"), color=sea_green, size=3)
 + geom_point(aes(y="y-2"), color=sea_green, fill=sea_green_light, size=3, stroke=0.5)
)