from plotnine import ggplot, aes, geom_step, geom_line, labs, theme, element_text
from plotnine.data import economicsStep plots
In [1]:
geom_step() connects points using ‘steps’ instead of a line.
In [2]:
# inspect the data
economics.head()| date | pce | pop | psavert | uempmed | unemploy | |
|---|---|---|---|---|---|---|
| 0 | 1967-07-01 | 507.4 | 198712 | 12.5 | 4.5 | 2944 |
| 1 | 1967-08-01 | 510.5 | 198911 | 12.5 | 4.7 | 2945 |
| 2 | 1967-09-01 | 516.3 | 199113 | 11.7 | 4.6 | 2958 |
| 3 | 1967-10-01 | 512.9 | 199311 | 12.5 | 4.9 | 3143 |
| 4 | 1967-11-01 | 518.1 | 199498 | 12.5 | 4.7 | 3066 |
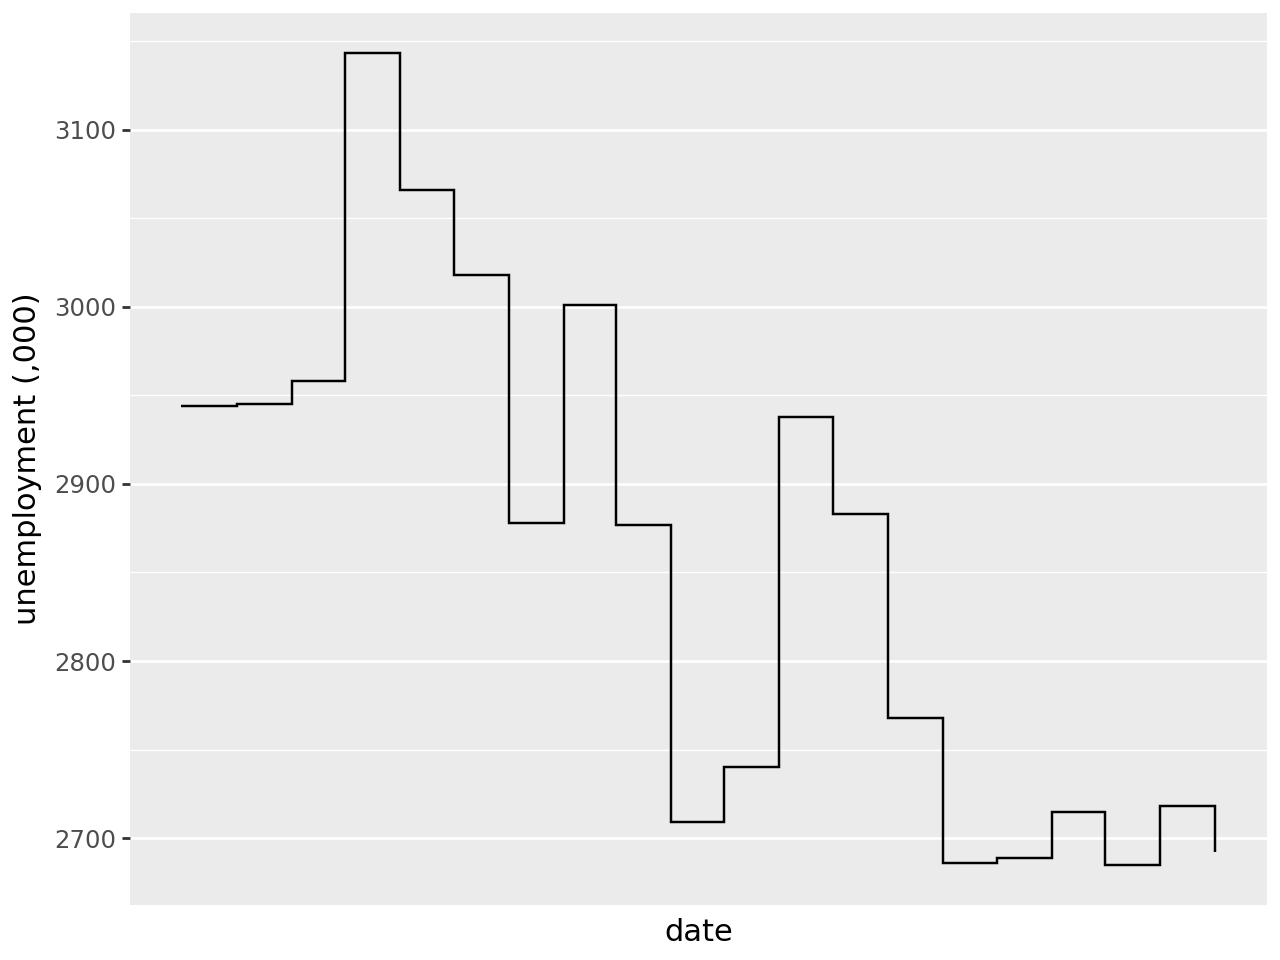
Plot a step plot using geom_plot(). Notice from the first point the line travels vertically then horizontally:
In [3]:
(
    ggplot(
        economics.iloc[:20],  # filter for first twenty rows (dates) to make steps more visible
        aes("date", "unemploy"),
    )
    + geom_step()  # step plot
    + labs(x="date", y="unemployment (,000)")  # label x & y-axis
    + theme(axis_text_x=element_text(angle=45))  # rotate x-axis text for readability
)
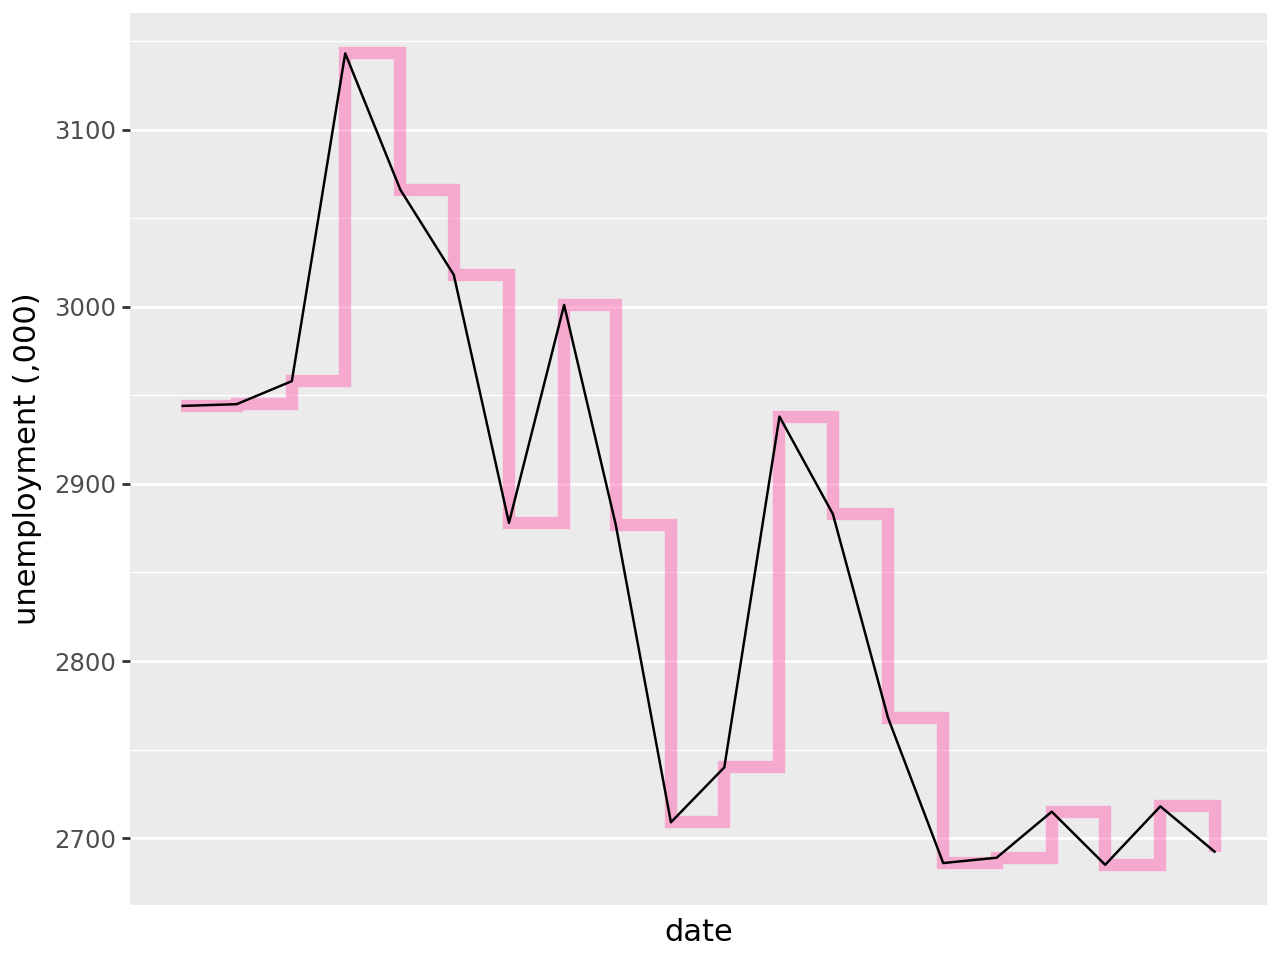
You can see how geom_path() (shown in pink) differs from geom_line() (black):
In [4]:
(
    ggplot(economics.iloc[:20], aes("date", "unemploy"))
    + geom_step(
        colour="#ff69b4",  # plot geom_step as the first layer - colour pink
        alpha=0.5,  # line transparency
        size=2.5,
    )  # line thickness
    + geom_line()  # plot geom_line as the second layer
    + labs(x="date", y="unemployment (,000)")
    + theme(axis_text_x=element_text(angle=45))
)
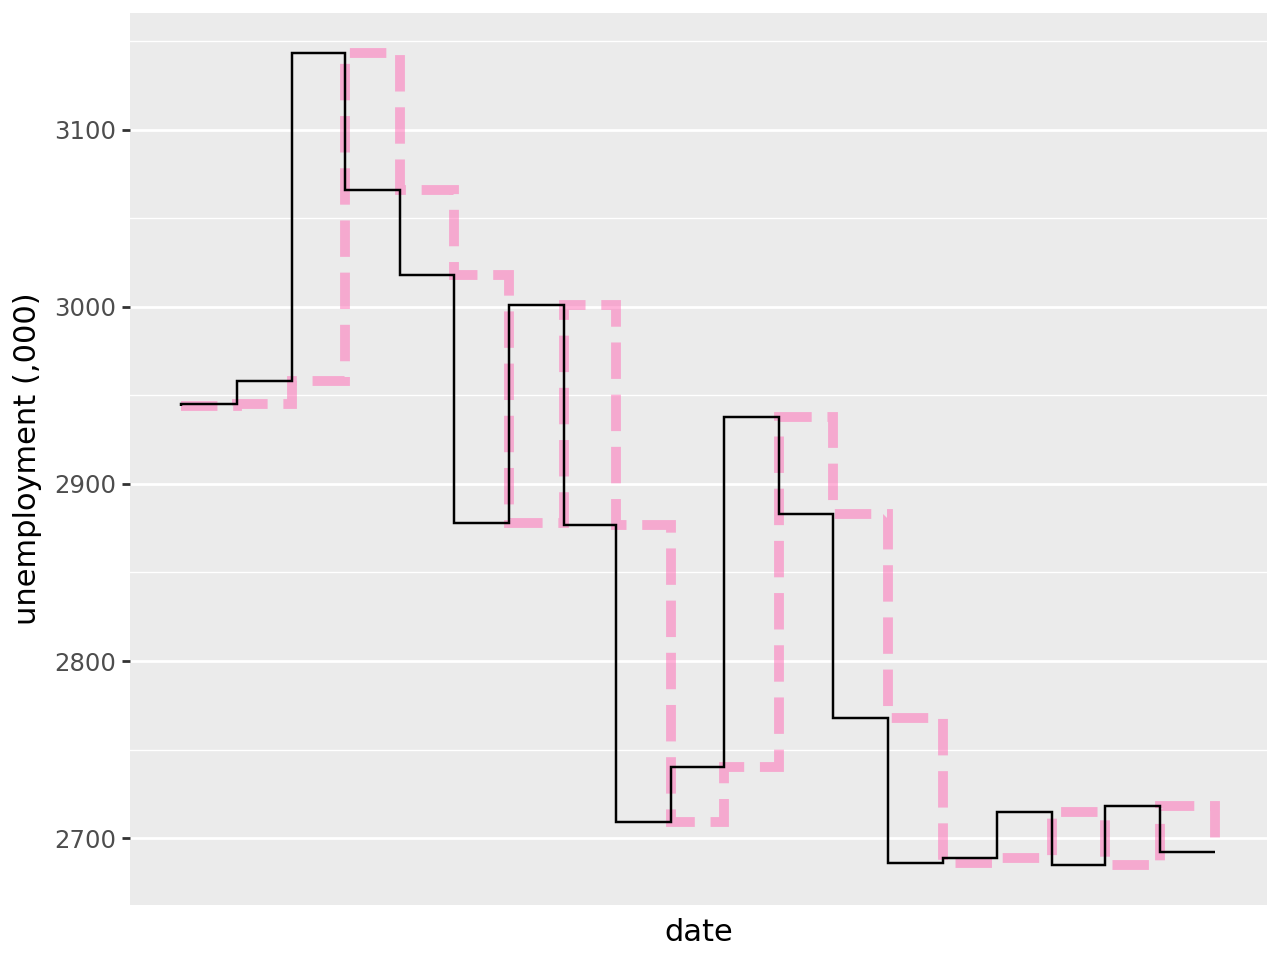
Rather than a line that travels vertically then horizontally, this order can be switched by specifying direction='vh' within geom_step(). Below direction='vh' is shown in black with the default direction='hv' shown in pink:
In [5]:
(
    ggplot(economics.iloc[:20], aes("date", "unemploy"))
    + geom_step(
        colour="#ff69b4",  # plot geom_path with default direction as the first layer - colour pink
        linetype="dashed",  # line type
        size=2,  # line thickness
        alpha=0.5,
    )  # line transparency
    + geom_step(direction="vh")  # plot geom_path with step order reversed
    + labs(x="date", y="unemployment (,000)")
    + theme(axis_text_x=element_text(angle=45))
)