from plotnine import (
    ggplot,
    aes,
    geom_point,
    facet_grid,
    labs,
    guide_legend,
    guides,
    theme,
    element_text,
    element_line,
    element_rect,
    theme_set,
    theme_void,
)
from plotnine.data import mtcars

# We use theme_void as the base theme so that the modifications
# we make in the code are transparent in the output
theme_set(theme_void())
In [1]:
In [2]:
mtcars.head()| name | mpg | cyl | disp | hp | drat | wt | qsec | vs | am | gear | carb | |
|---|---|---|---|---|---|---|---|---|---|---|---|---|
| 0 | Mazda RX4 | 21.0 | 6 | 160.0 | 110 | 3.90 | 2.620 | 16.46 | 0 | 1 | 4 | 4 |
| 1 | Mazda RX4 Wag | 21.0 | 6 | 160.0 | 110 | 3.90 | 2.875 | 17.02 | 0 | 1 | 4 | 4 |
| 2 | Datsun 710 | 22.8 | 4 | 108.0 | 93 | 3.85 | 2.320 | 18.61 | 1 | 1 | 4 | 1 |
| 3 | Hornet 4 Drive | 21.4 | 6 | 258.0 | 110 | 3.08 | 3.215 | 19.44 | 1 | 0 | 3 | 1 |
| 4 | Hornet Sportabout | 18.7 | 8 | 360.0 | 175 | 3.15 | 3.440 | 17.02 | 0 | 0 | 3 | 2 |
The base plots we will use for the demonstation and some colors.
In [3]:
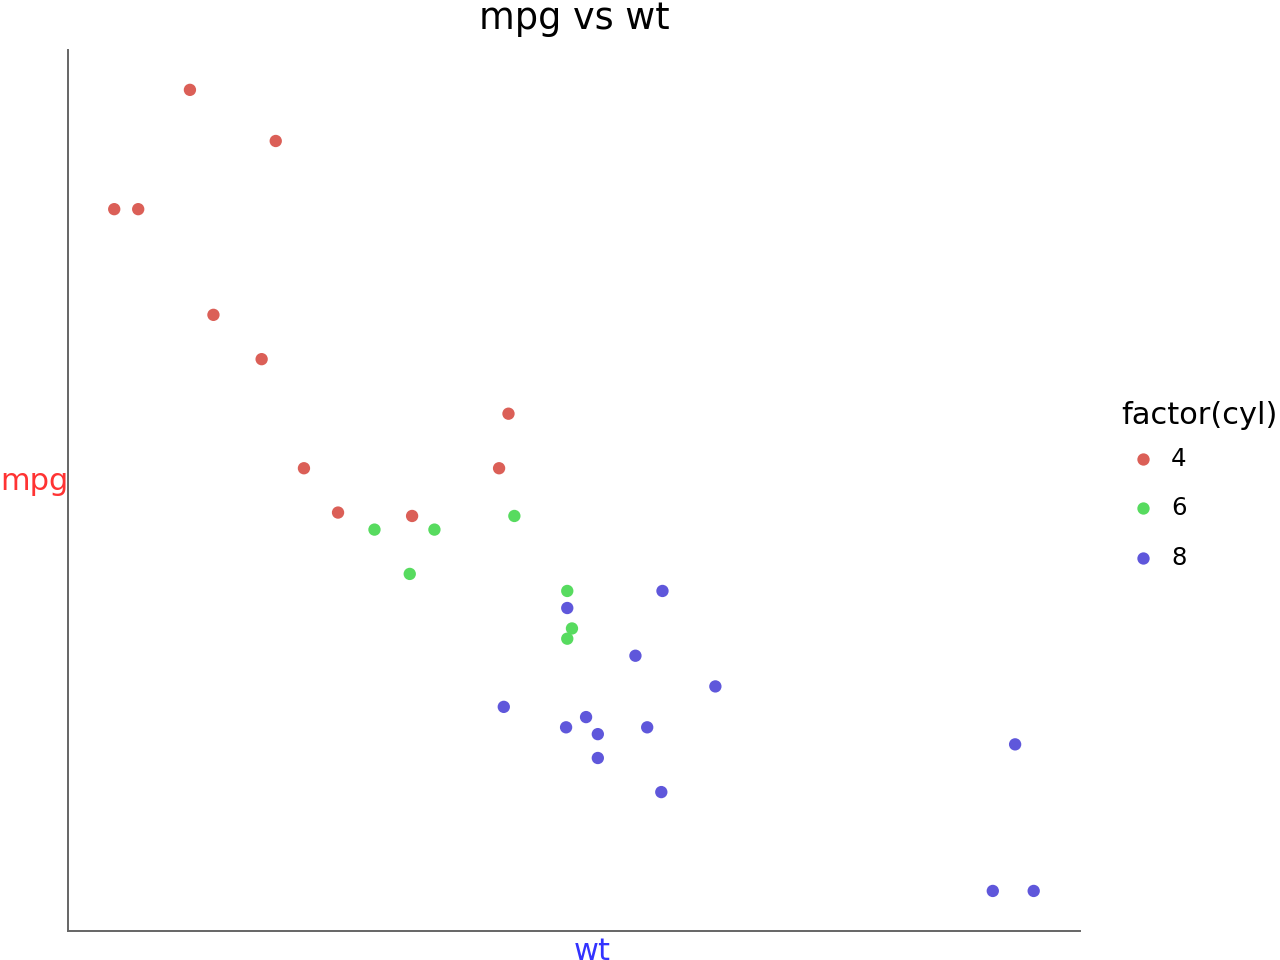
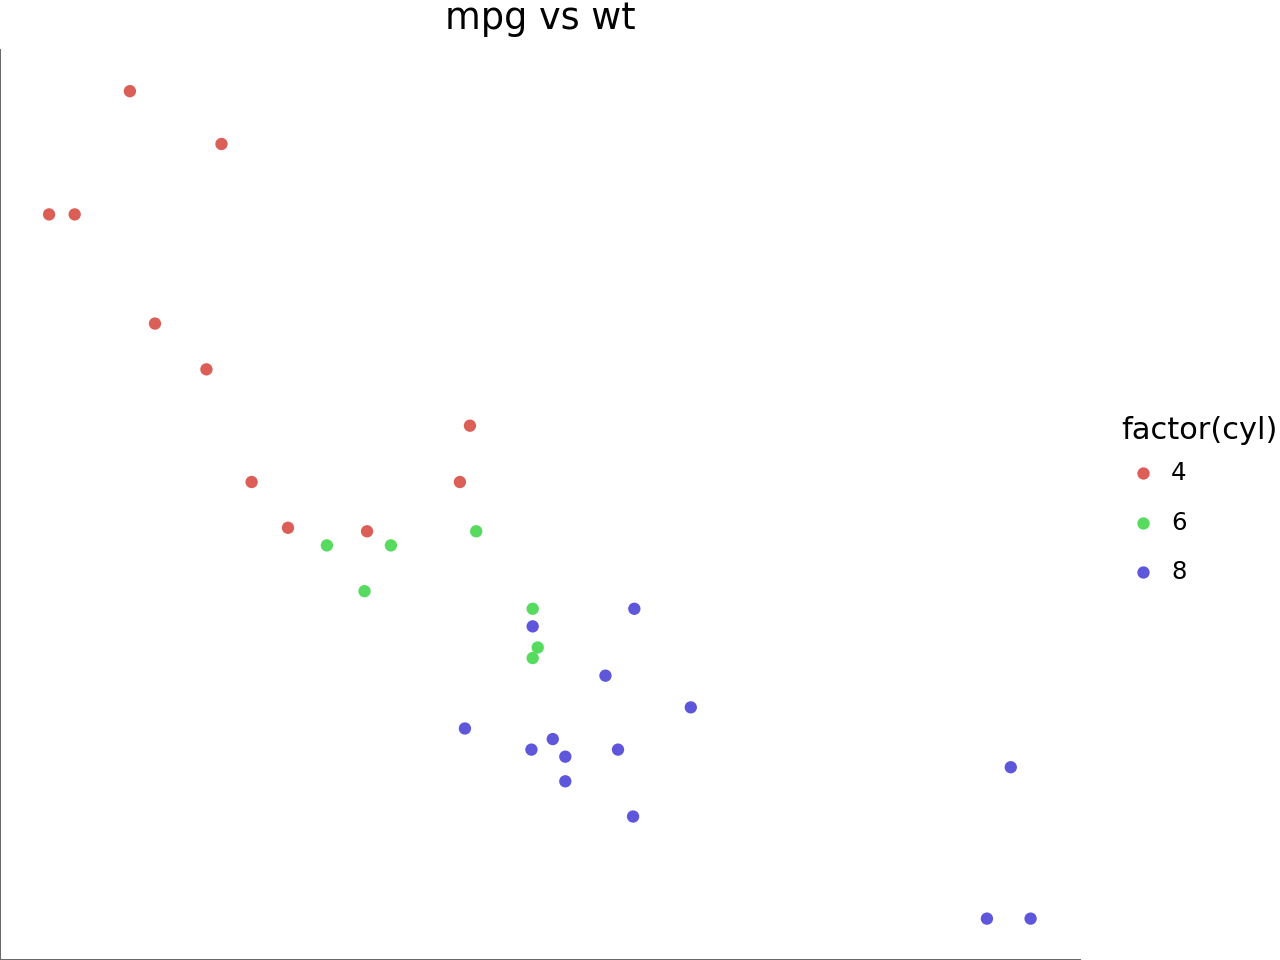
p1 = (
ggplot(mtcars, aes("wt", "mpg", color="factor(cyl)"))
+ geom_point()
+ labs(title="mpg vs wt")
)
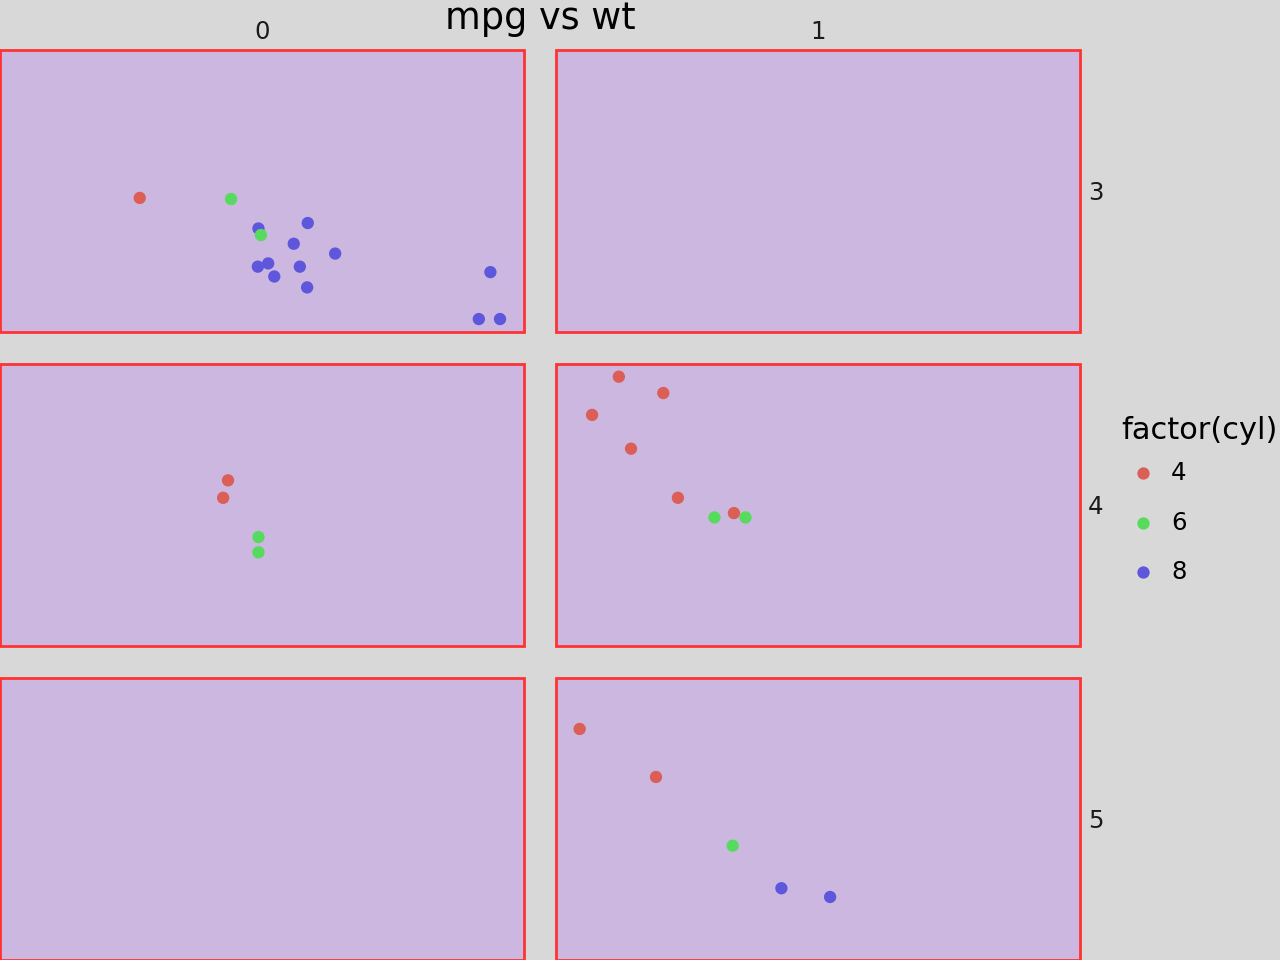
p2 = p1 + facet_grid("gear", "am")
black = "#222222"
gray = "#666666"
red = "#FF3333"
green = "#66CC00"
blue = "#3333FF"
purple = "#9933FF"
orange = "#FF8000"
yellow = "#FFFF33"What the plots look like unmodified (unthemed).
In [4]:
p1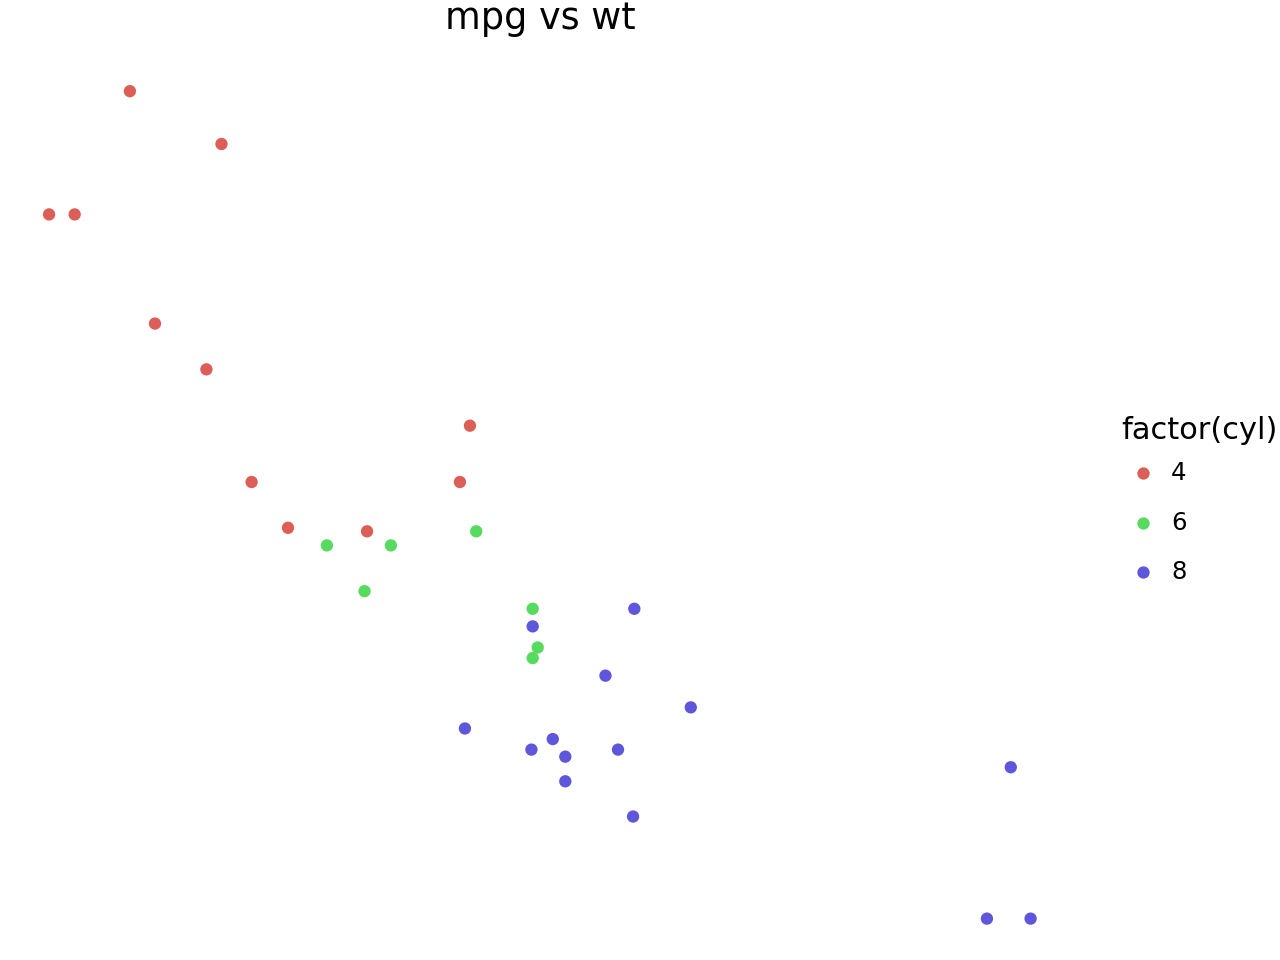
In [5]:
p2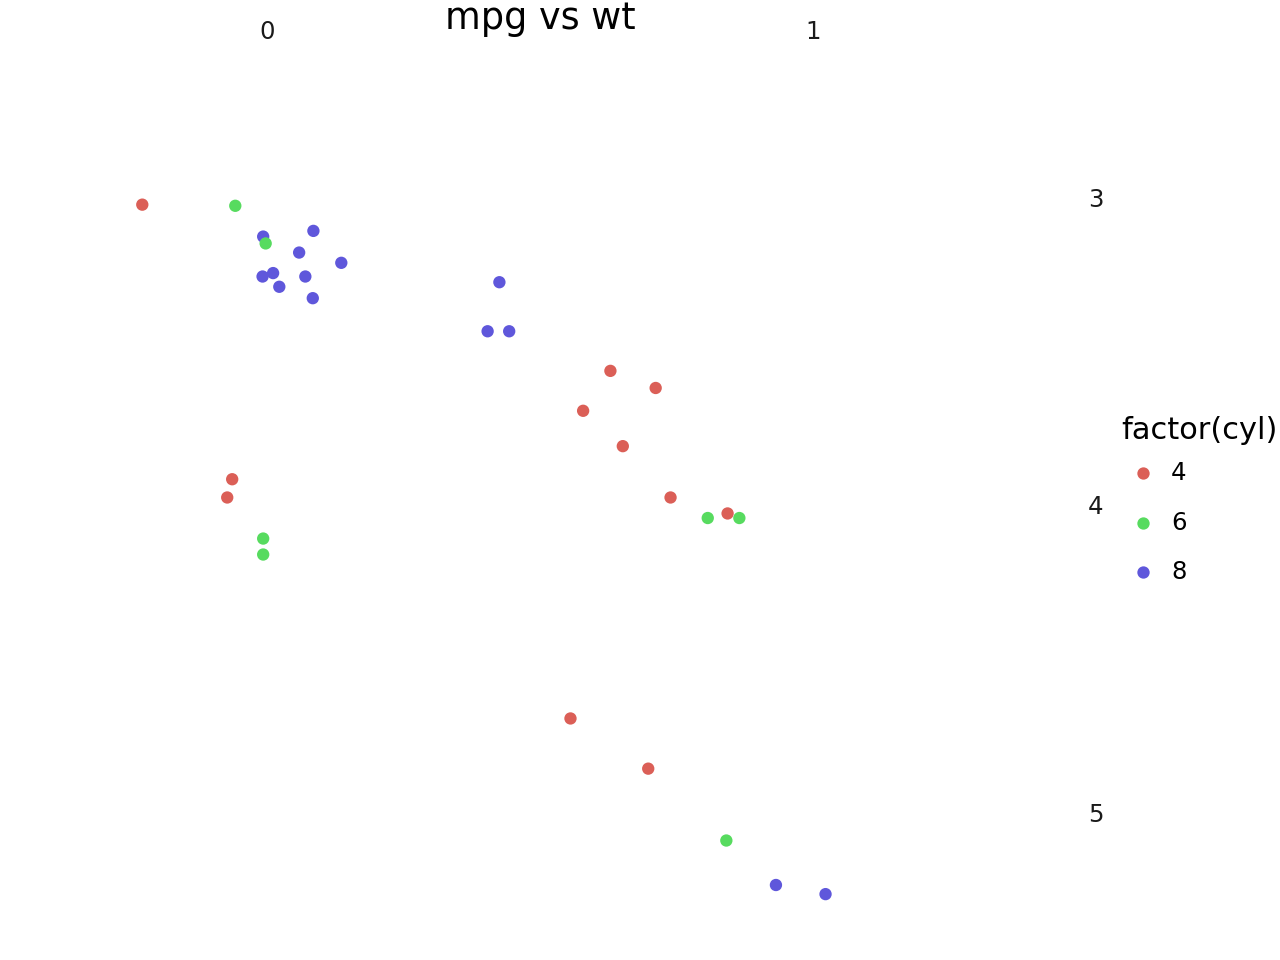
There are 3 main top level theming elements:
text- controls all the text elements in the figure.rect- controls all the rectangles in the figure.line- controls all the lines in the figure.
Note that none of the themeables control/modify the plotted data. e.g You cannot use text to change the appearance of objects plotted with geom_text.
text
In [6]:
p1 + theme(text=element_text(color=purple))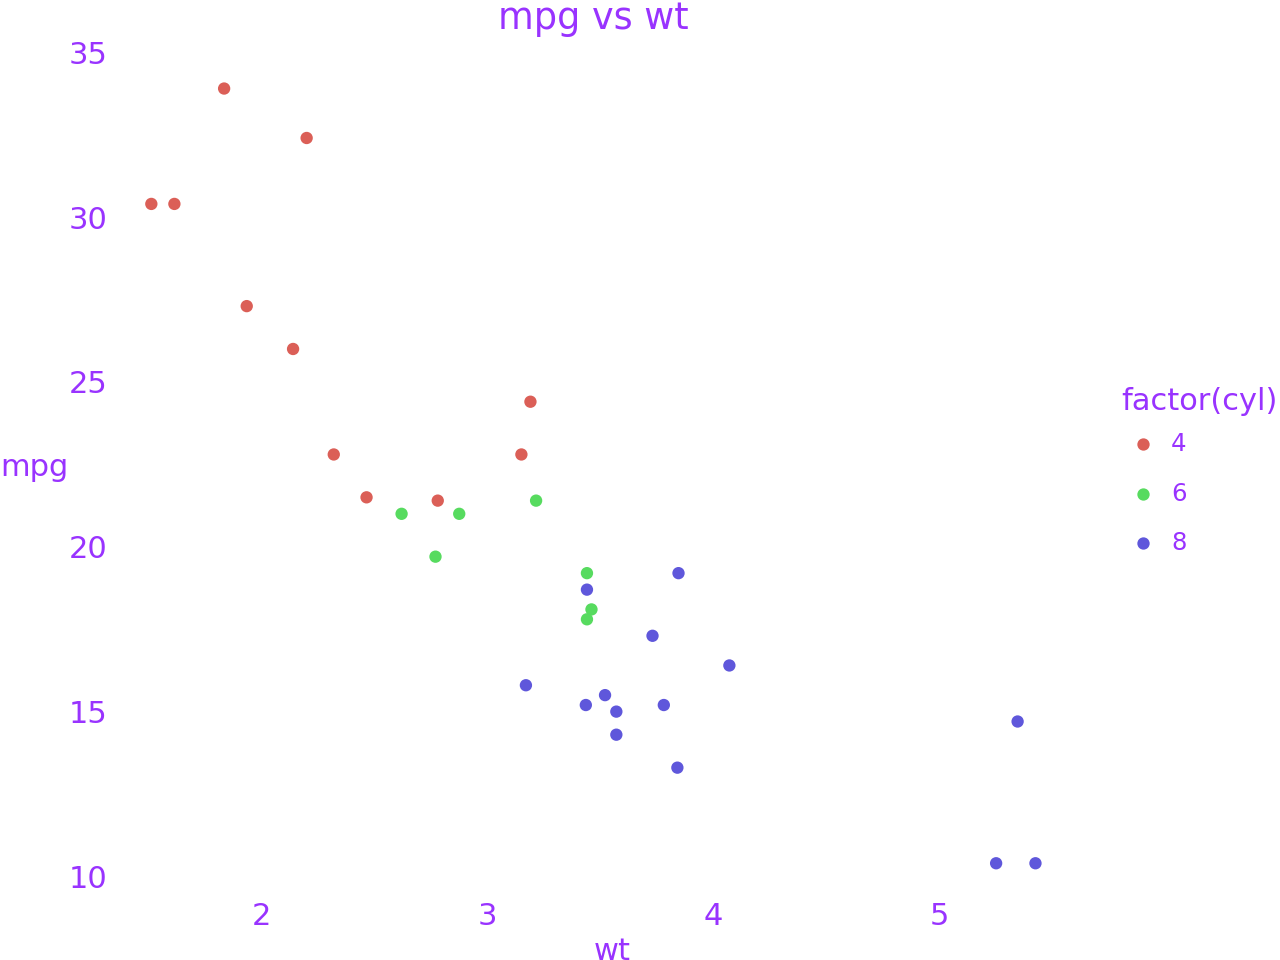
rect
In [7]:
p1 + theme(rect=element_rect(color=black, size=3, fill="#EEBB0050"))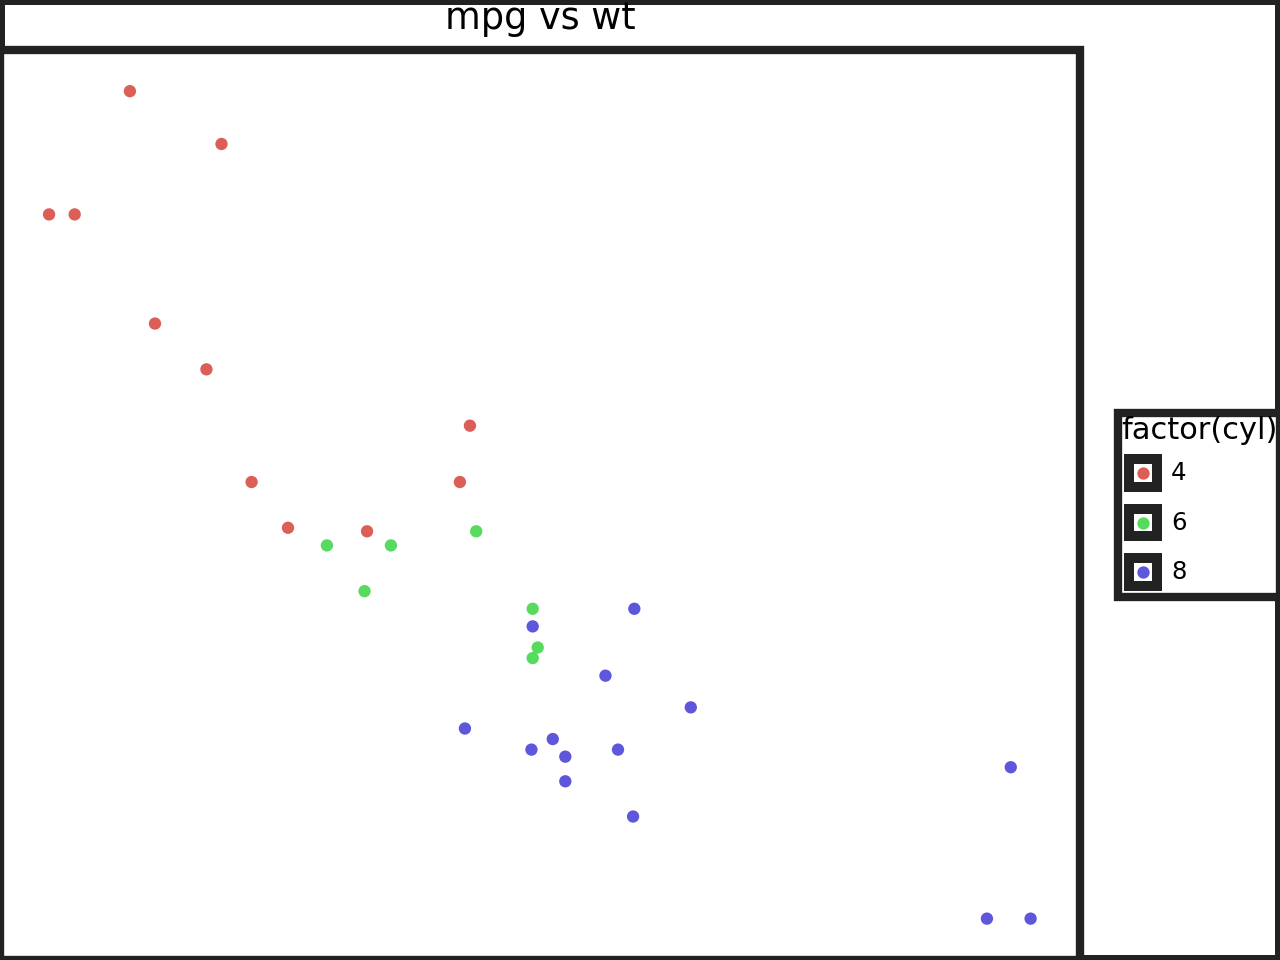
line
In [8]:
p1 + theme(line=element_line(color=black))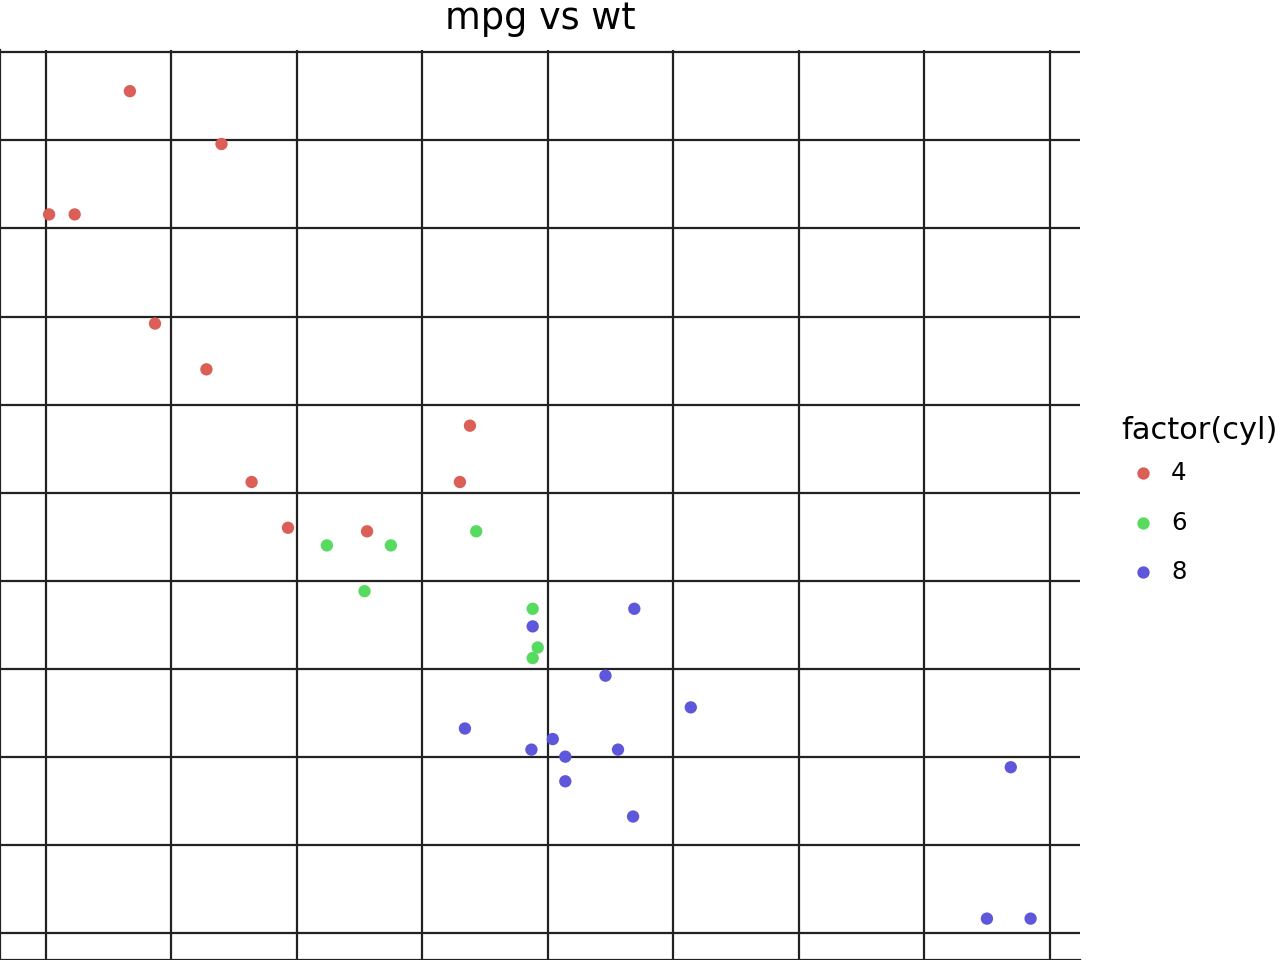
Theming specific items
axis_line and axis_text
In [9]:
p1 + theme(
    axis_line=element_line(size=2),
    axis_line_x=element_line(color=red),
    axis_line_y=element_line(color=blue),
    axis_text=element_text(margin={"t": 5, "r": 5}),
    axis_text_x=element_text(color=black),
    axis_text_y=element_text(color=purple),
)
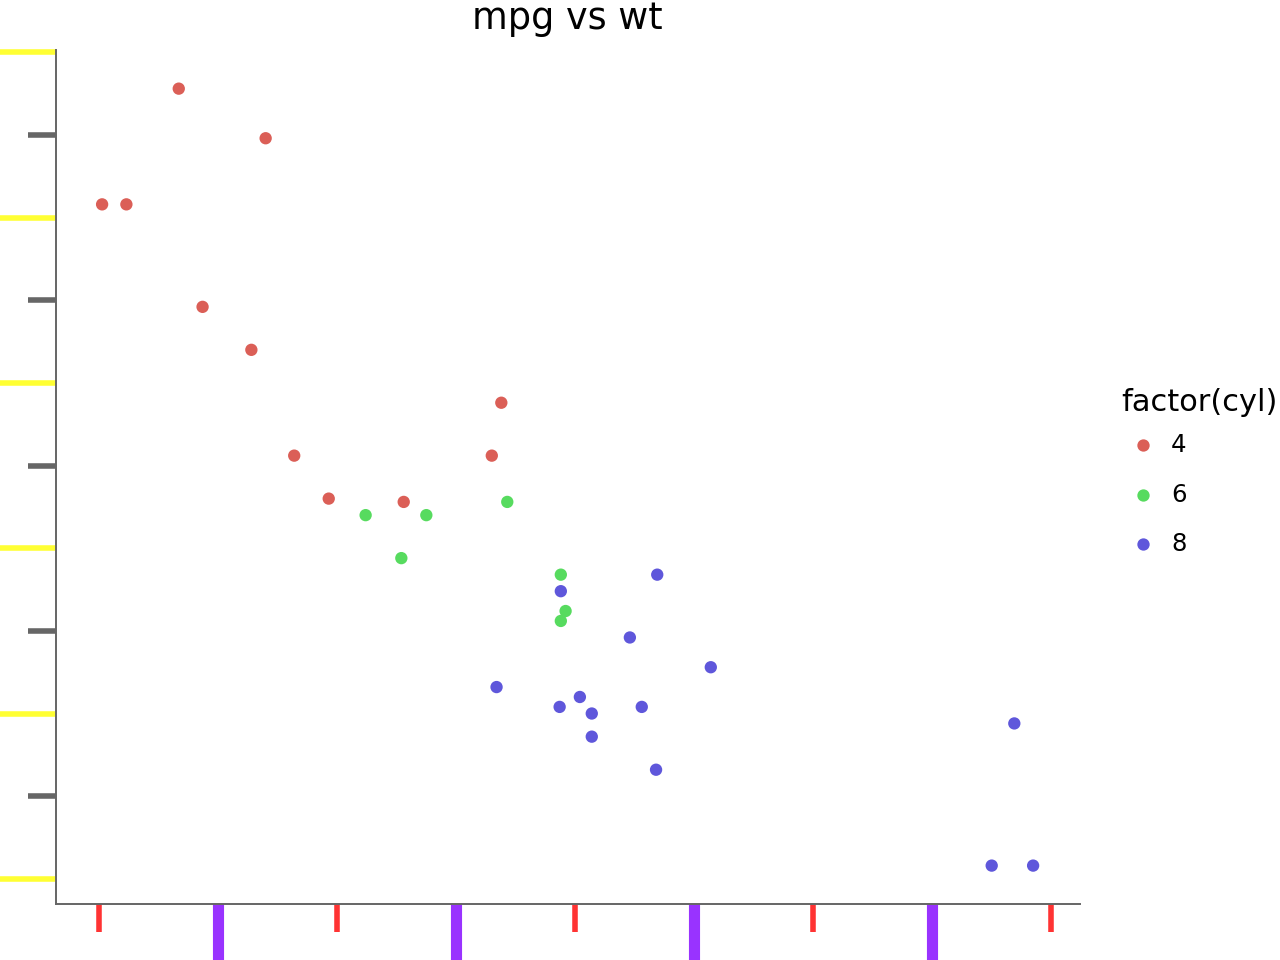
In [10]:
p1 + theme(
    axis_line=element_line(size=0.7, color=gray),
    # We are focusing on the ticks, make them long
    axis_ticks_length=20,
    axis_ticks_length_minor=10,
    axis_ticks_length_major=20,
    axis_ticks=element_line(size=2),
    axis_ticks_major=element_line(color=purple),
    axis_ticks_major_x=element_line(size=4),  # override size=2
    axis_ticks_major_y=element_line(color=yellow),  # override color=purple
    axis_ticks_minor=element_line(color=red),
    axis_ticks_minor_x=element_line(),  # do not override anything
    axis_ticks_minor_y=element_line(color=gray),  # override color=red
)
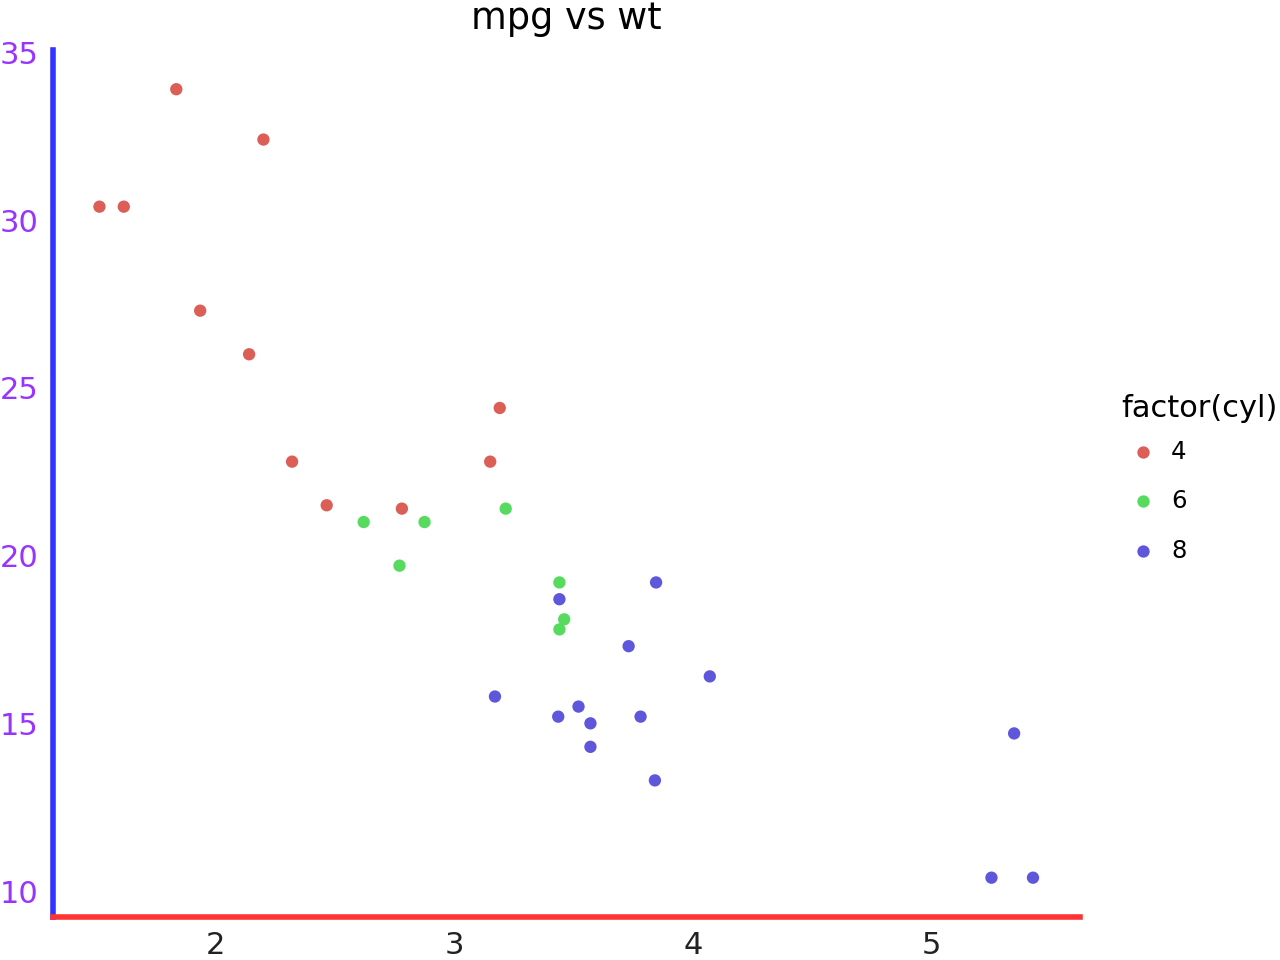
axis_title and axis_ticks_pad
In [11]:
p1 + theme(
    axis_line=element_line(size=0.7, color=gray),
    axis_ticks=element_line(),
    axis_title=element_text(),
    axis_title_x=element_text(color=blue),
    axis_title_y=element_text(color=red),
    # The gap between the title and the ticks
    axis_ticks_pad=20,
    axis_ticks_pad_major=20,
    axis_ticks_pad_minor=20,
)
axis_ticks_direction
In [12]:
p1 + theme(
    axis_line=element_line(size=0.7, color=gray),
    axis_ticks=element_line(),
    axis_ticks_direction="in",
    axis_ticks_direction_x="in",
    axis_ticks_direction_y="out",
)
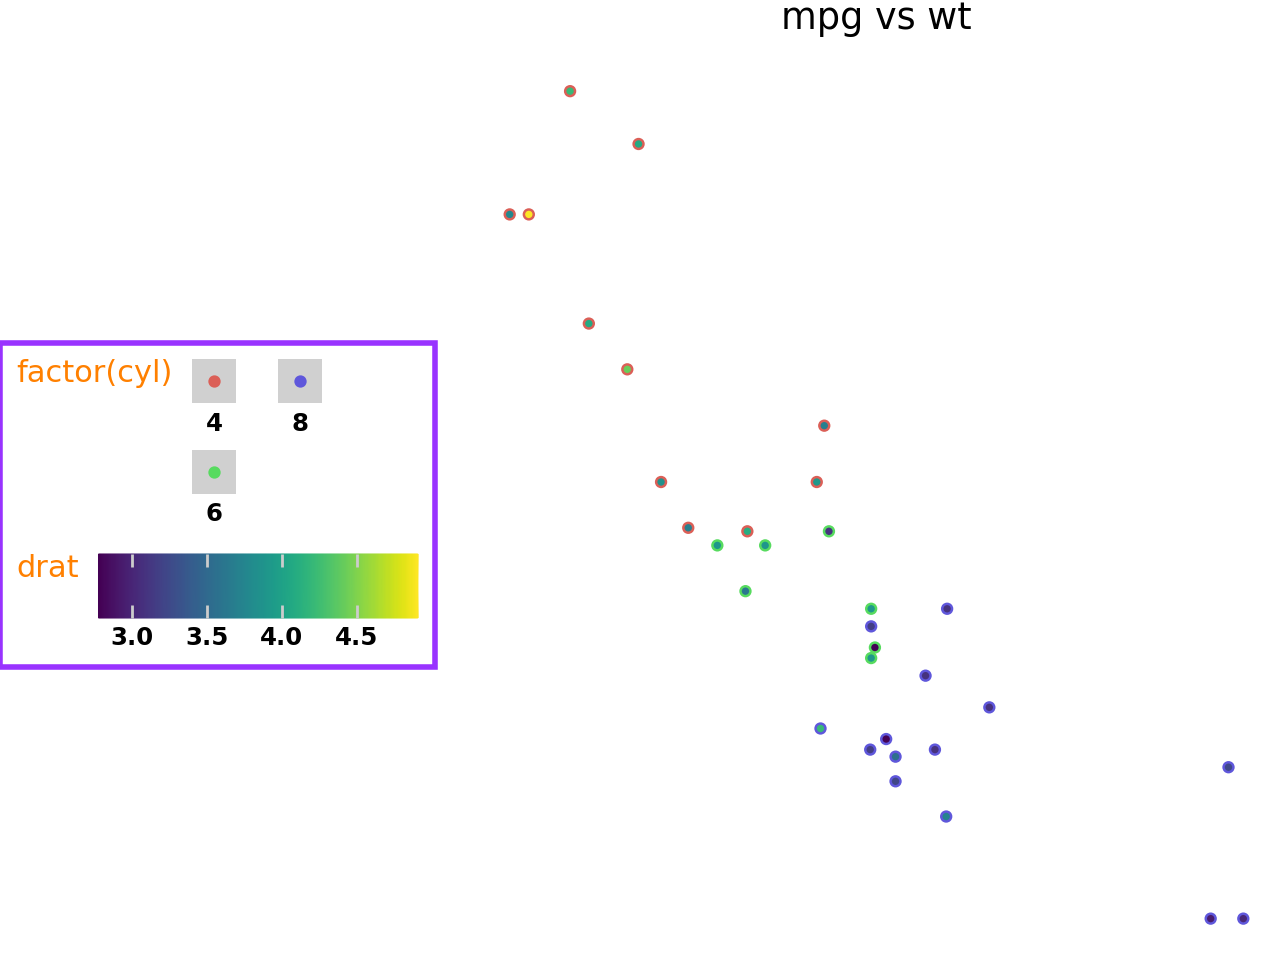
Legend_box
Not all themeables that affect the legend box are demonstrated
In [13]:
(
    p1
    + aes(fill="drat")
    + theme(
        legend_position="left",
        legend_direction="horizontal",  # affected by the ncol=2
        legend_box_margin=5,
        legend_background=element_rect(color=purple, size=2, fill="white"),
        legend_box="vertical",
        legend_key=element_rect(fill=gray, alpha=0.3),
        legend_title=element_text(color=orange, va="top"),
        legend_text=element_text(weight="bold"),
        legend_key_spacing=10,  # overridden
        legend_key_spacing_x=15,
        legend_key_spacing_y=5,
    )
    # so we can see legend_entry_spacing in action
    + guides(color=guide_legend(ncol=2))
)
plot_background, panel_background and panel_border
In [14]:
p2 + theme(
    plot_background=element_rect(fill="gray", alpha=0.3),
    panel_background=element_rect(fill=purple, alpha=0.2),
    panel_border=element_rect(color=red, size=1),
    panel_spacing=0.025,
)
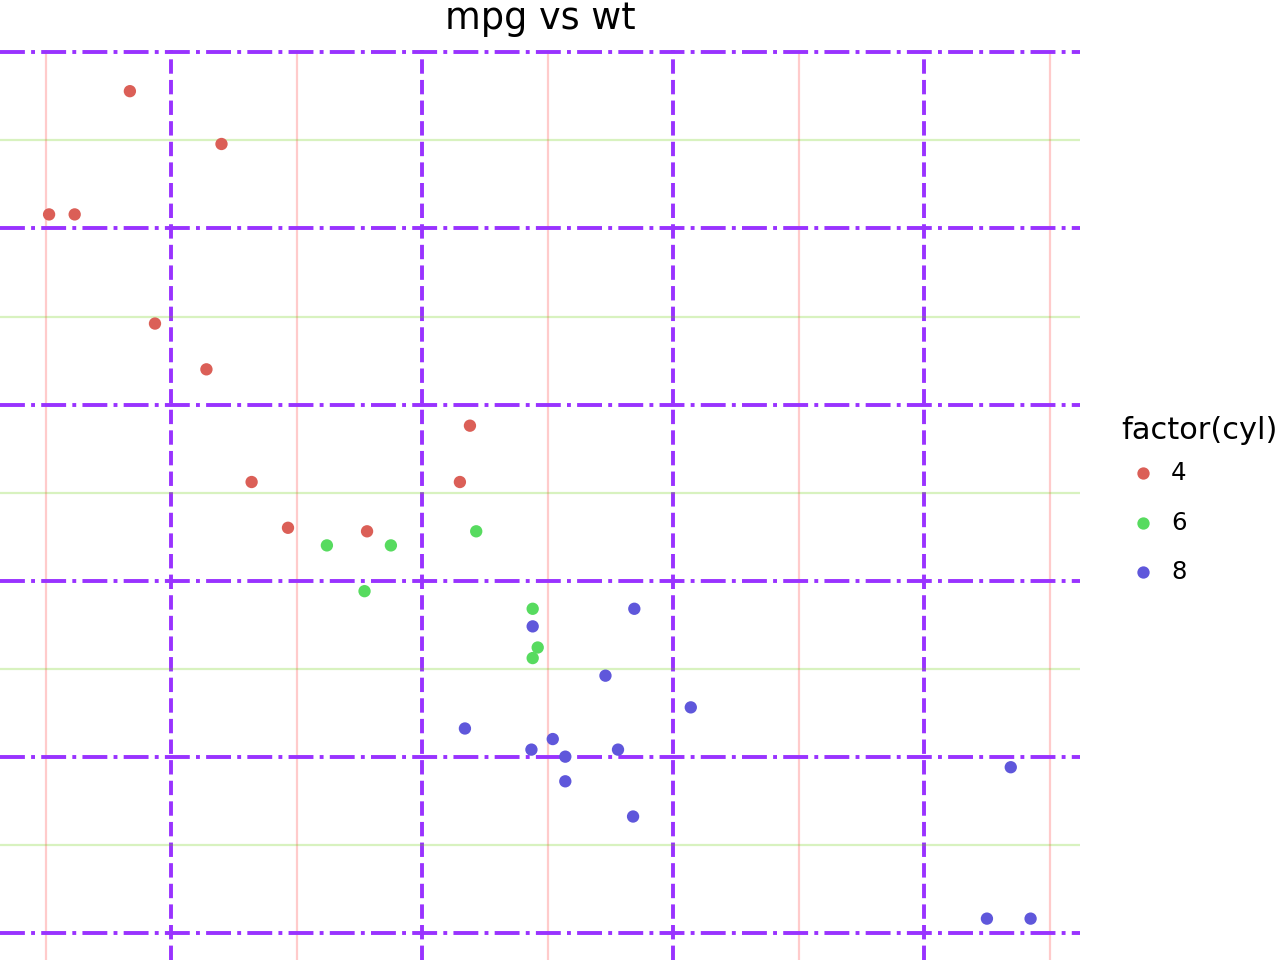
panel_grid
In [15]:
p1 + theme(
    panel_grid=element_line(color=purple),
    panel_grid_major=element_line(size=1.4, alpha=1),
    panel_grid_major_x=element_line(linetype="dashed"),
    panel_grid_major_y=element_line(linetype="dashdot"),
    panel_grid_minor=element_line(alpha=0.25),
    panel_grid_minor_x=element_line(color=red),
    panel_grid_minor_y=element_line(color=green),
    panel_ontop=False,  # puts the points behind the grid
)
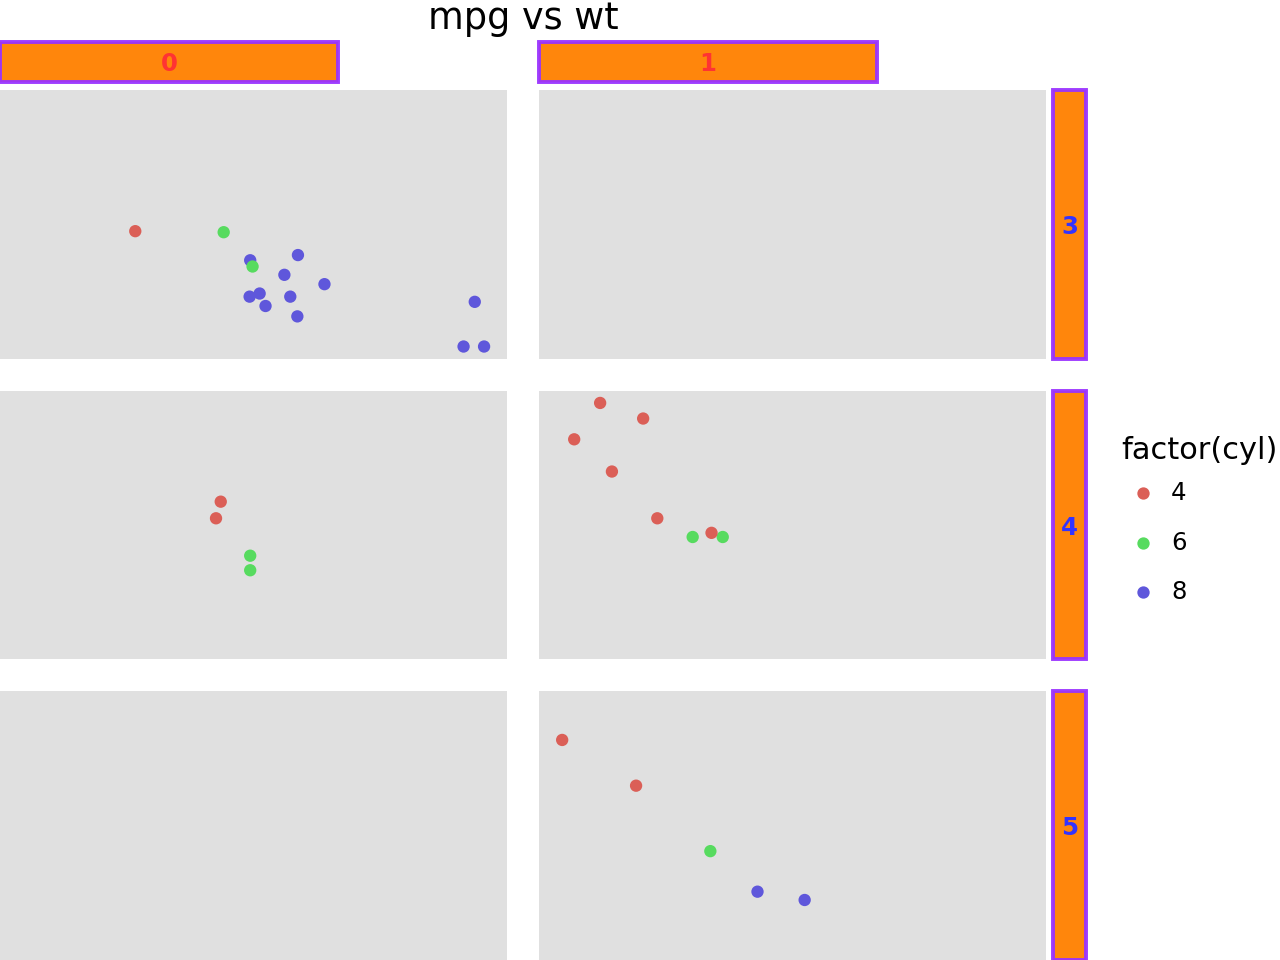
strip_background, strip_align and strip_text
In [16]:
p2 + theme(
    panel_spacing=0.025,
    panel_background=element_rect(fill=gray, alpha=0.2),
    strip_background=element_rect(color=purple, fill=orange, size=1.4, alpha=0.95),
    strip_background_x=element_rect(x=1 / 6, width=2 / 3),  # you can get really crazy
    strip_background_y=element_rect(),
    strip_align=0,
    strip_align_x=0.2,
    strip_align_y=0.2,
    strip_text=element_text(weight="bold"),
    strip_text_x=element_text(color=red),
    strip_text_y=element_text(color=blue),
)
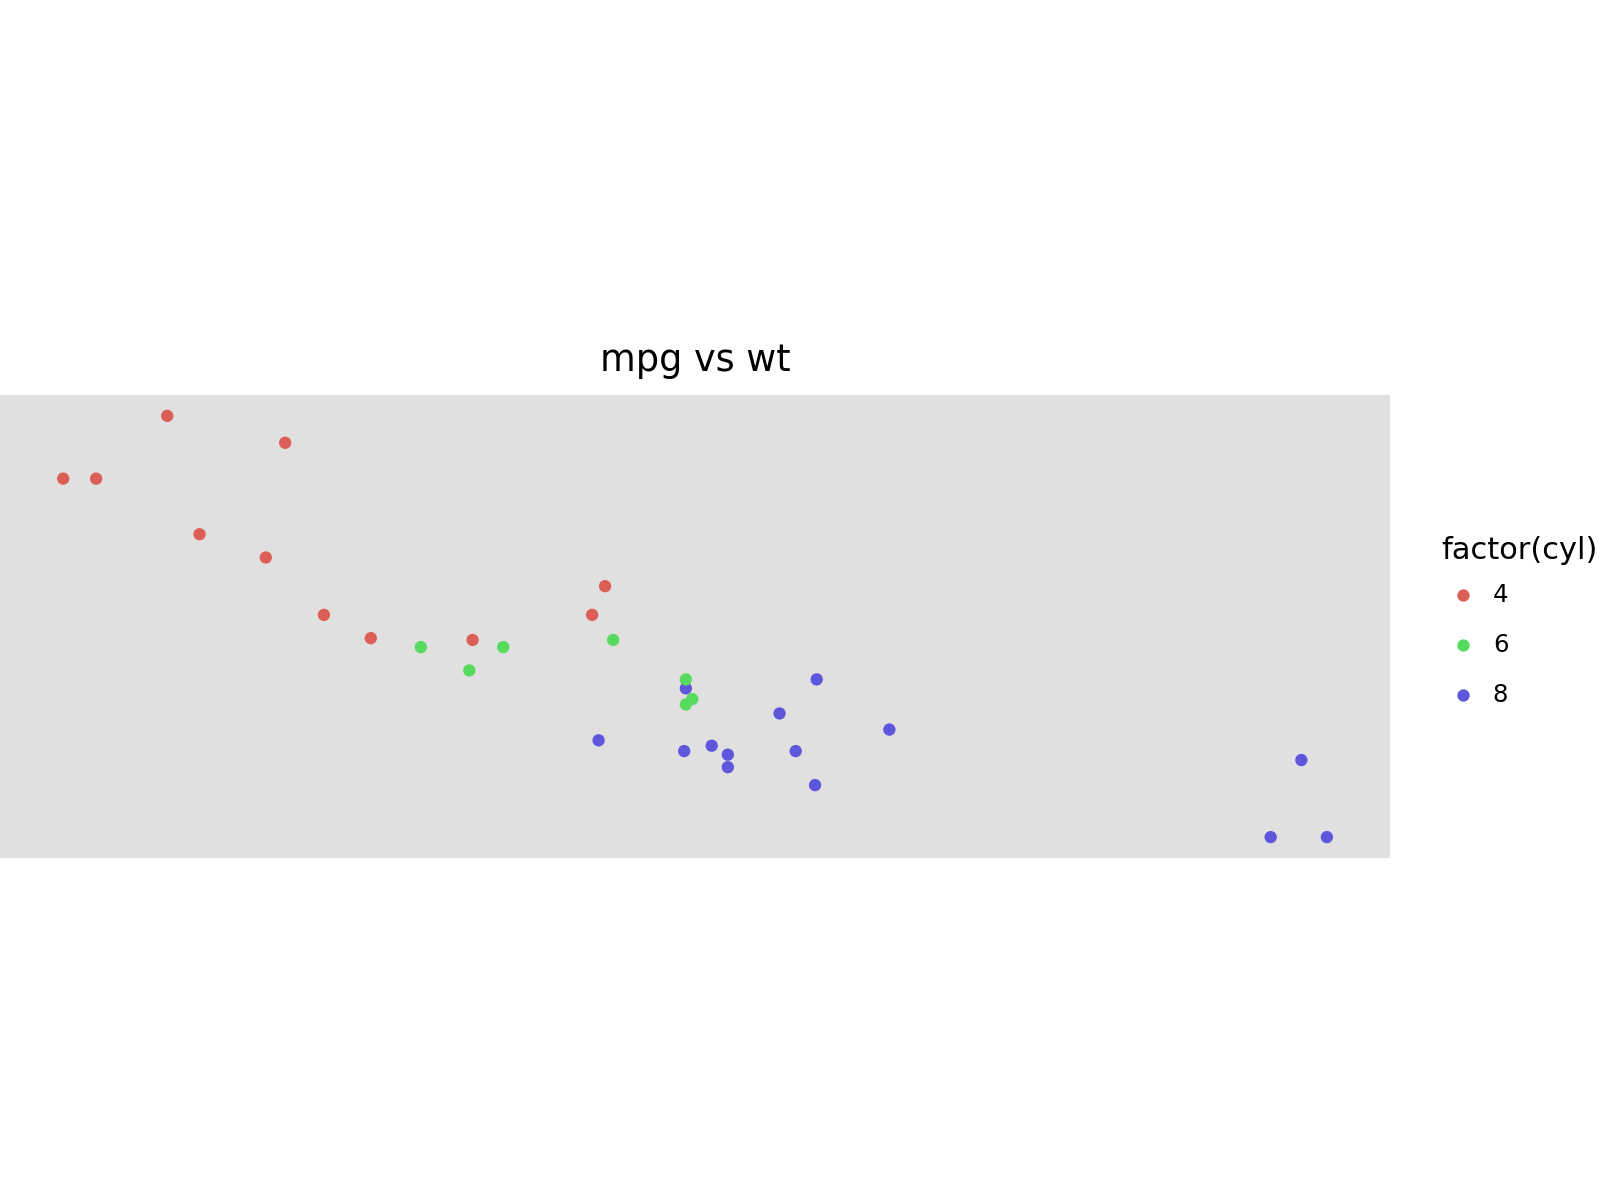
aspect_ratio and figure_size
The aspect_ratio takes precedence over the figure_size, and it modifies the height. The effective width and height are:
width = figure_size[0]
height = figure_size[0] * aspect_ratio
In [17]:
p1 + theme(
    panel_background=element_rect(fill=gray, alpha=0.2),
    figure_size=(8, 6),  # inches
    aspect_ratio=1 / 3,  # height:width
)