from plotnine import (
    ggplot,
    aes,
    theme_matplotlib,
    theme_set,
    geom_tile,
    scale_fill_continuous,
    coord_cartesian
)

from plotnine.data import faithfuld

# Set default theme for all the plots
theme_set(theme_matplotlib())Simple heatmap
In [1]:
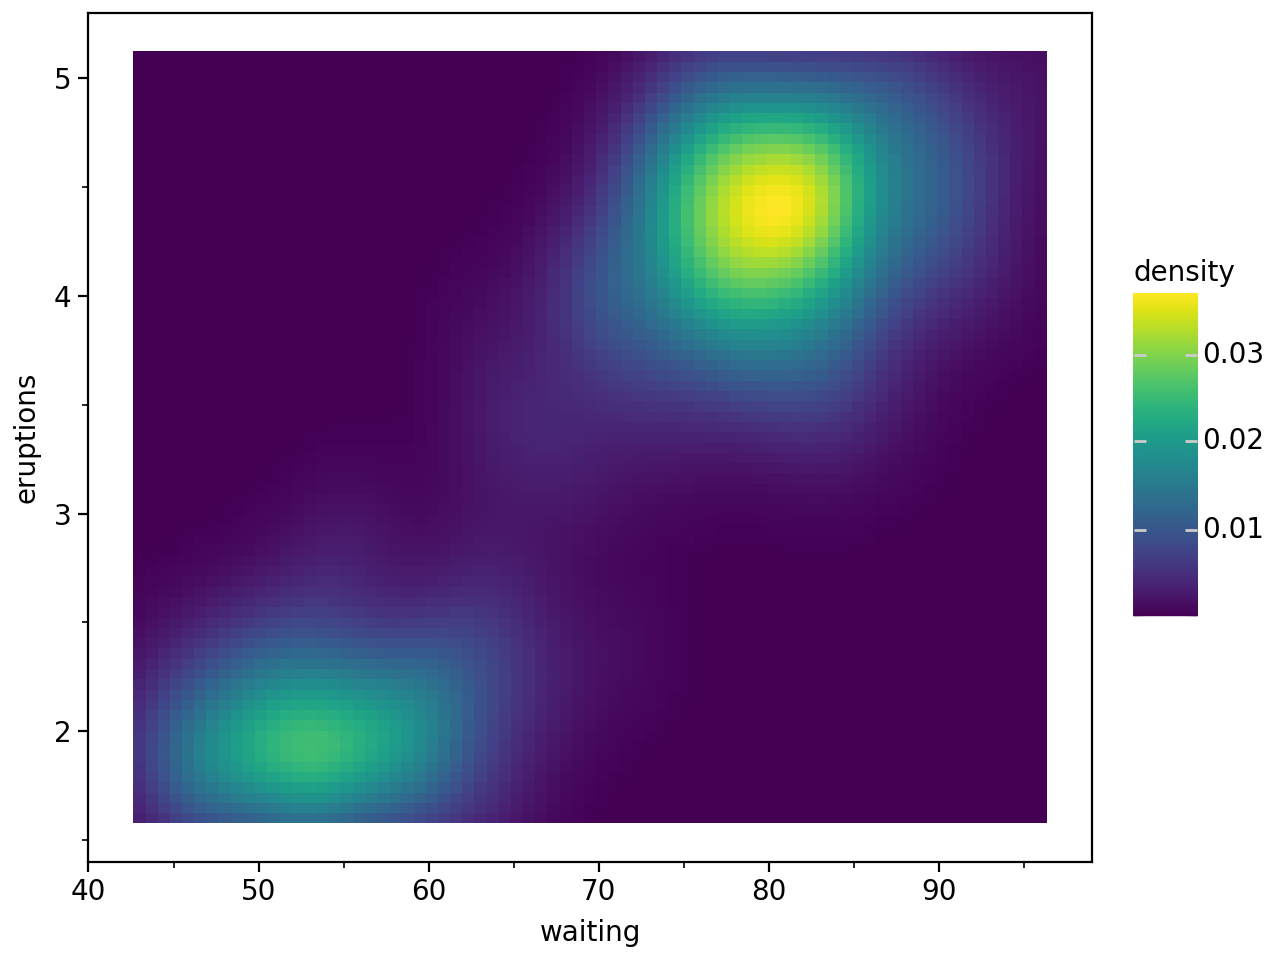
Map data to color gradient
Without specifically calling scale_fill_continuous(), a default scale is applied to geom_tile().
In [2]:
faithfuld.head()| eruptions | waiting | density | |
|---|---|---|---|
| 0 | 1.600000 | 43.0 | 0.003216 |
| 1 | 1.647297 | 43.0 | 0.003835 |
| 2 | 1.694595 | 43.0 | 0.004436 |
| 3 | 1.741892 | 43.0 | 0.004978 |
| 4 | 1.789189 | 43.0 | 0.005424 |
In [3]:
(
    ggplot(faithfuld, aes("waiting", "eruptions", fill="density"))
    + geom_tile()
)
Notice that adding scale_fill_continuous() will not change the default plot.
In [4]:
(
    ggplot(faithfuld, aes("waiting", "eruptions", fill="density"))
    + geom_tile()
    + scale_fill_continuous()
)
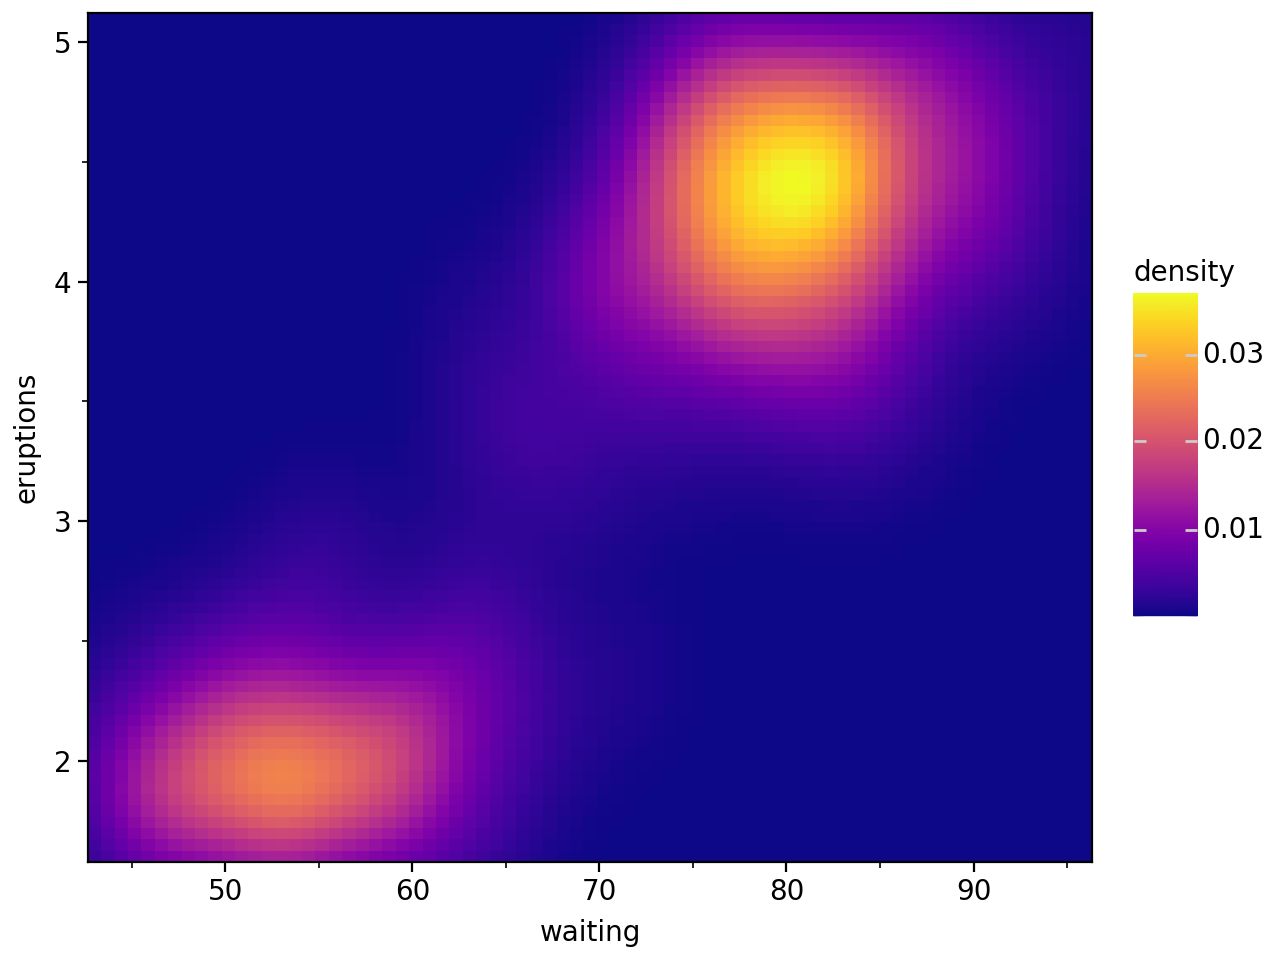
The scale aesthetics can be edited to other color maps. Use the cmap_name argument to specify an alternative palette. Find other available color maps in the matplotlib documentation.
In [5]:
# Gallery, tiles

(
    ggplot(faithfuld, aes("waiting", "eruptions", fill="density"))
    + geom_tile()
    + scale_fill_continuous(cmap_name="plasma")
    + coord_cartesian(expand=False)
)