from plotnine import ggplot, geom_point, aes, labs, theme_bw
from plotnine.data import mtcarsBlack & White
In [1]:
In [2]:
# Gallery, themes
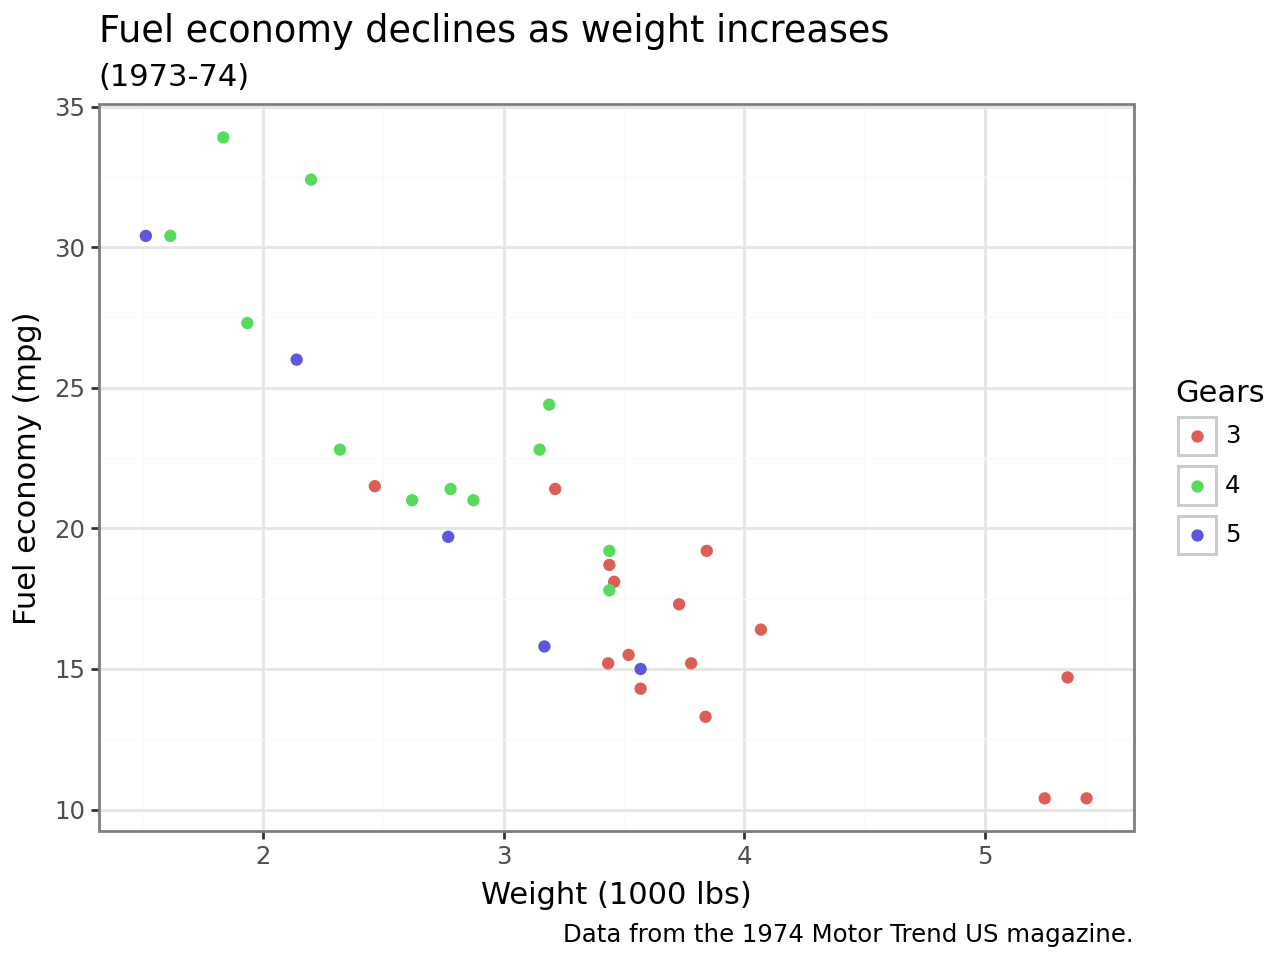
(
ggplot(mtcars, aes(x="wt", y="mpg", colour="factor(gear)"))
+ geom_point()
+ labs(
title= "Fuel economy declines as weight increases",
subtitle="(1973-74)",
caption="Data from the 1974 Motor Trend US magazine.",
x="Weight (1000 lbs)",
y="Fuel economy (mpg)",
colour="Gears"
)
+ theme_bw()
)