from plotnine import (
    ggplot,
    aes,
    geom_area,
    geom_line,
    scale_x_date,
    scale_y_continuous,
    theme_linedraw,
    theme_set,
)
from plotnine.data import economics

# Set default theme
theme_set(theme_linedraw())
geom_area(mapping=None, data=None, **kwargs)Area plot
{usage}
An area plot is a special case of geom_ribbon, where the minimum of the range is fixed to 0, and the position adjustment defaults to ‘stack’.
See Also
Examples
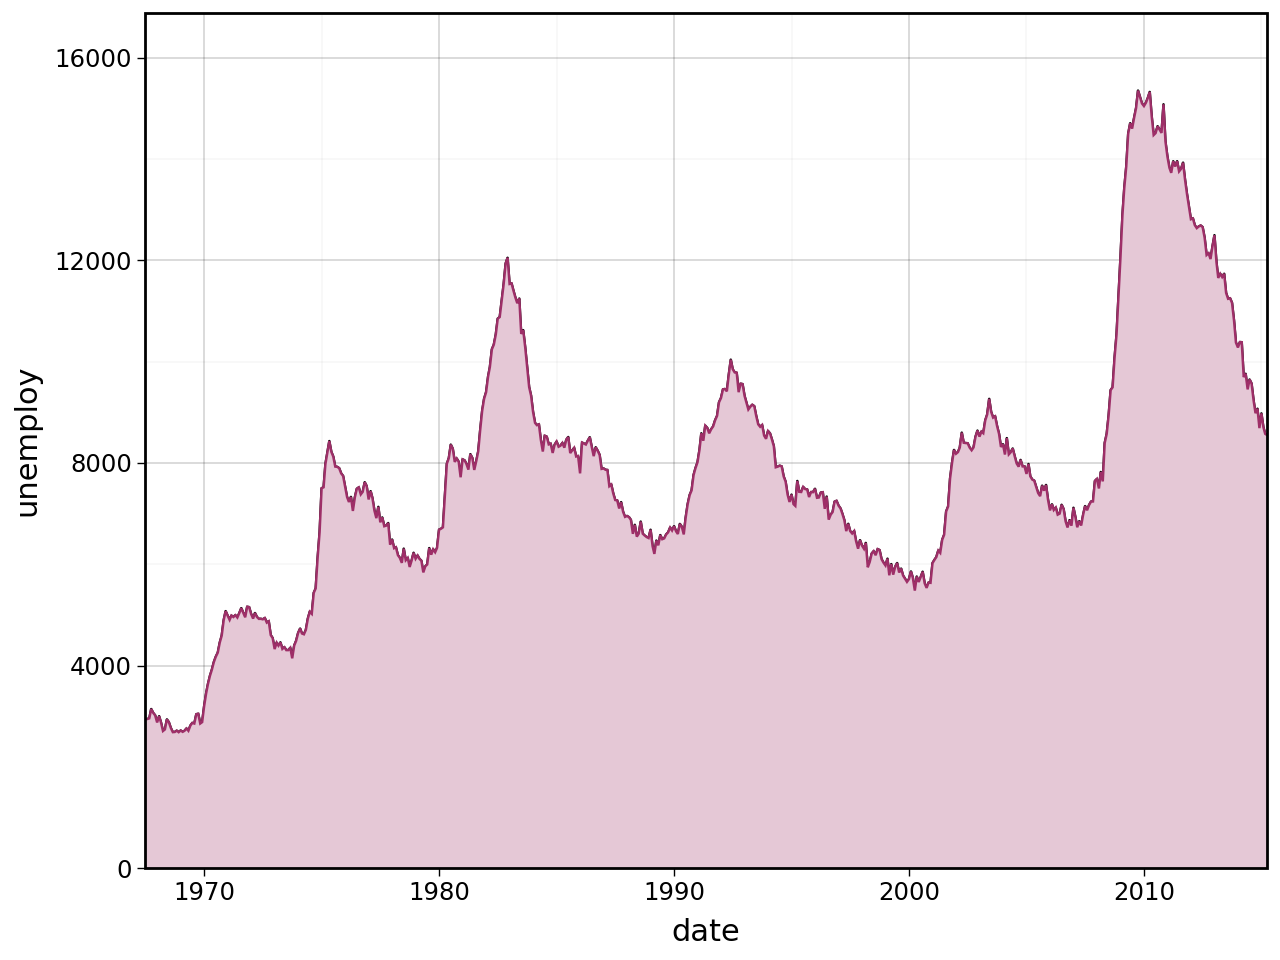
Area Under Line
# Gallery, areas
(
    ggplot(economics, aes(x="date", y="unemploy"))
    + geom_line()
    + geom_area(fill="#e5c8d6", color="#9e2f68")
    + scale_x_date(expand=(0, 0), date_labels="%Y")
    + scale_y_continuous(expand=(0, 0, 0.1, 0))
    + theme_linedraw()
)