We are proud to announce the winners of the 2024 plotnine Plotting Contest!
A translation of the visualisation chapters from “R for Data Science” to Python using Plotnine and Pandas. This is a comprehensive introduction on the Grammar of Graphics with plotnine.
The Plotnine Contest starts today. This event isn’t so much a contest, as a celebration of great data visualizations made with plotnine. We are excited to see what you share with the community.
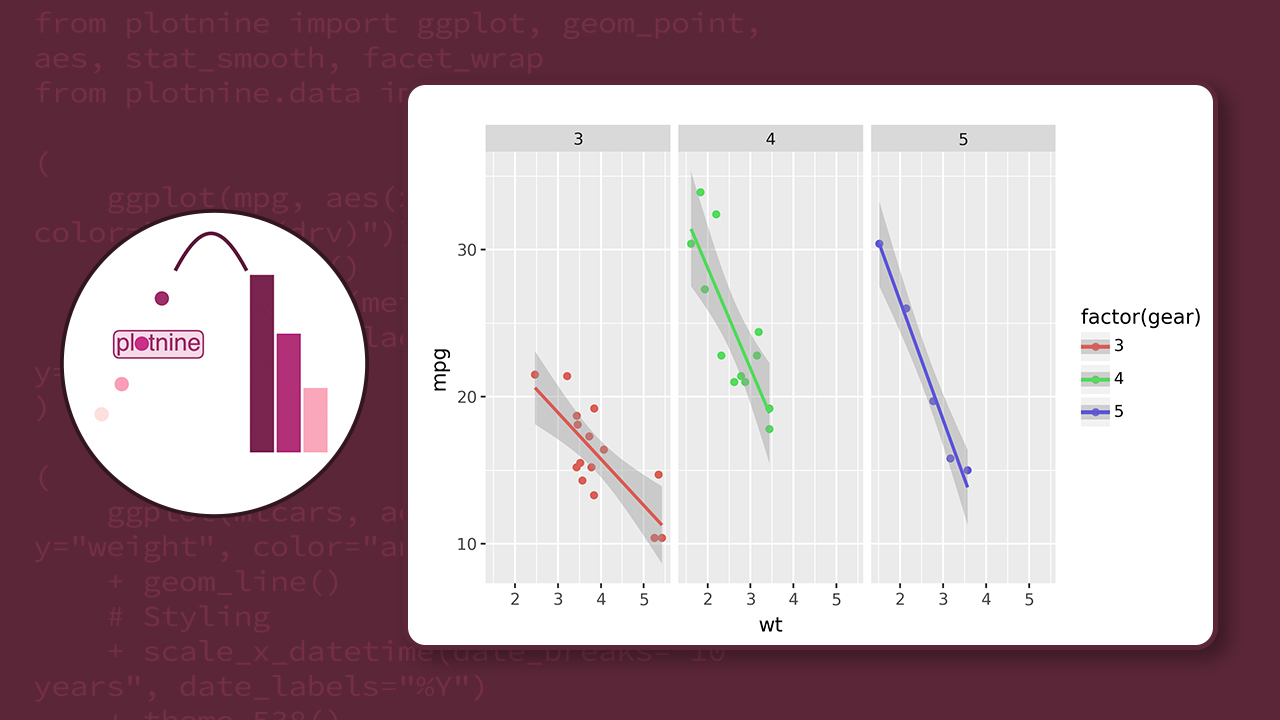
plotnine implements the Layered Grammar of Graphics in Python. In plotnine 0.12, we added a custom layout manager for producing well-arranged graphics.
An introduction to “grammar of graphics”, and how to use plotnine. This is part of the Data Analysis and Visualization in Python for Ecologists course from Data Carpentry. It is actively maintained.