import numpy as np
import pandas as pd
from plotnine import (
    ggplot,
    aes,
    geom_point,
    theme_matplotlib,
    theme_set,
)

# Set default theme for all the plots
theme_set(theme_matplotlib())Oh My Bubbles
scatter plot

np.random.seed(123)
n = 150

df = pd.DataFrame({
    "x": np.random.randint(0, 101, n),
    "y": np.random.randint(0, 101, n),
    "var1": np.random.randint(1, 6, n),
    "var2": np.random.randint(0, 11, n)
})
(
ggplot(df, aes("x", "y"))
+ geom_point()
)
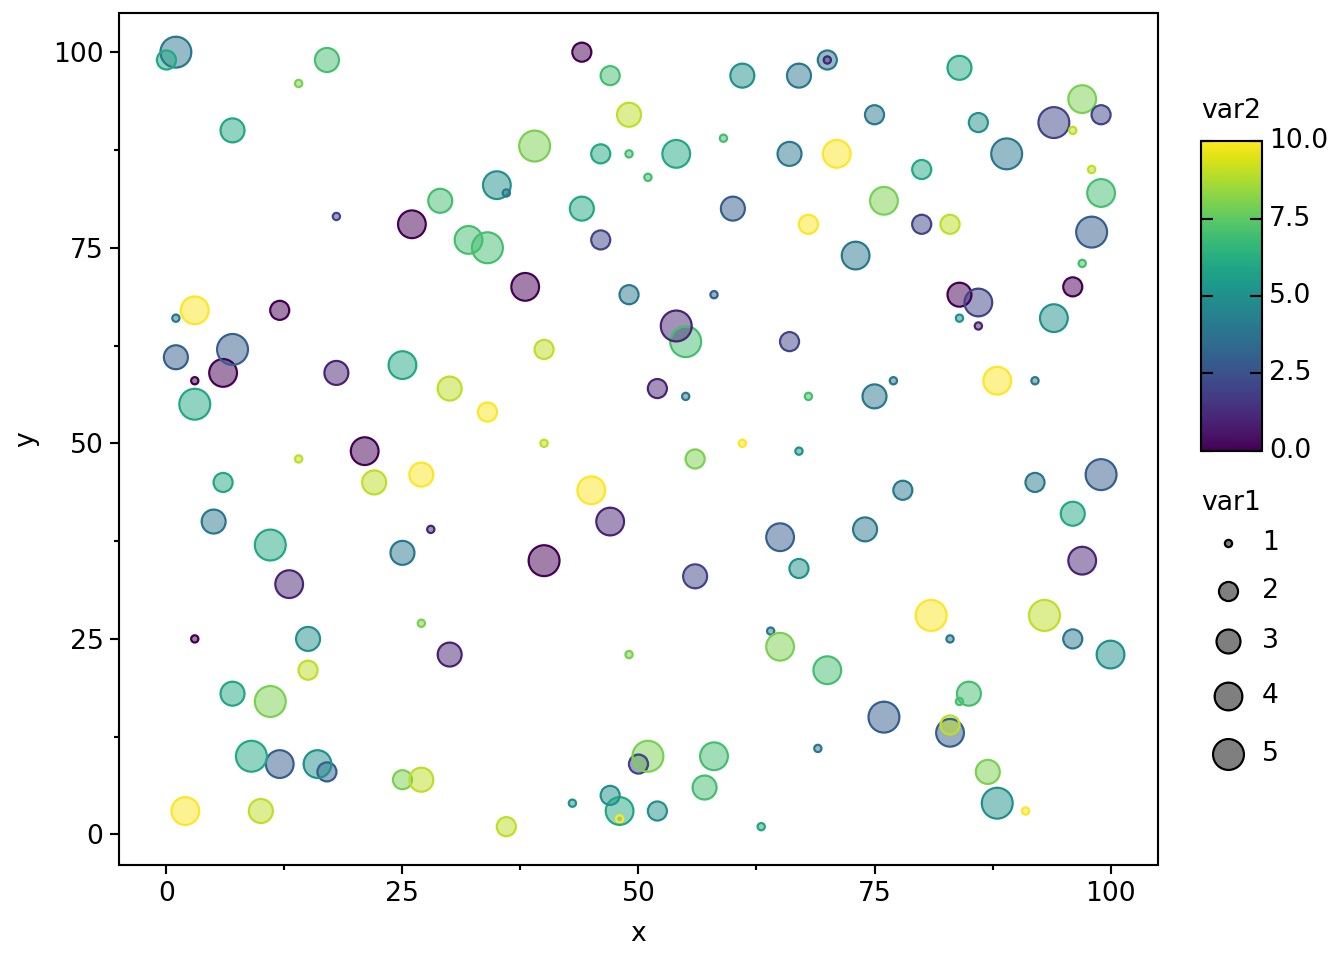
Coloured Point Bubbles
(
    ggplot(df, aes("x", "y", size="var1"))
    + geom_point(aes(color="var2"))
)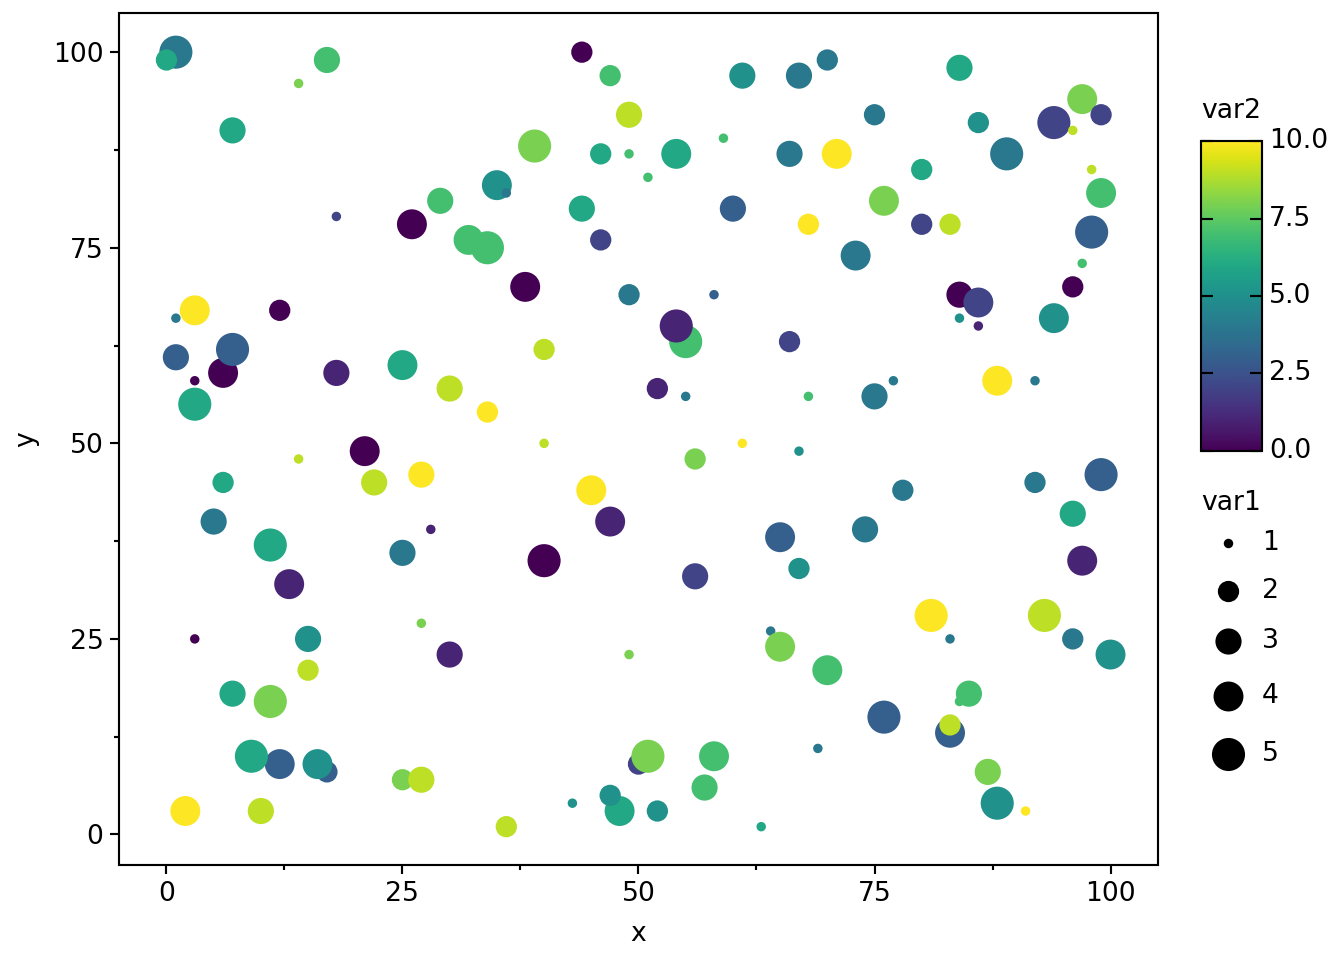
(
    ggplot(df, aes("x", "y", size="var1"))
    + geom_point(aes(fill="var2"), stroke=0, alpha=0.5)
    + geom_point(aes(color="var2"), fill="none")
)