from plotnine import (
    ggplot,
    aes,
    geom_point,
    geom_boxplot,
    stat_smooth,
    facet_wrap,
    labs,
    scale_color_manual,
    element_text,
    element_rect,
    element_line,
    element_blank,
    theme_gray,
    theme_set,
    theme,
)

from plotnine.data import penguins
penguins = penguins.dropna()The Plots that Want to be Together
plot composition
theme
smooth
box plot

For a common look & feel, change the default theme that will apply to all plots in the composition.
c1, c2 = "#5B4F41", "#FCF9F4"

theme_set(
    theme_gray()
    + theme(
        figure_size=(8, 6),
        text=element_text(color=c1),
        legend_position="none",
        panel_background=element_rect(fill=c2),
        panel_grid_major=element_line(color=c1, linetype="dashdot", alpha=0.1),
        panel_grid_minor=element_blank(),
        panel_border=element_rect(color=c1),
        axis_text=element_text(size=8),
        strip_text=element_text(color="white"),
        strip_background=element_rect(fill=c1, color=c1)
    )
)

# Use the same scale for the color and fill aesthetics
scale_color_and_fill = scale_color_manual(
    values=["#DB735C", "#2A91A2", "#F8B75A"],
    aesthetics=("fill", "color")
)
Create the plots and compose them into a single graphic
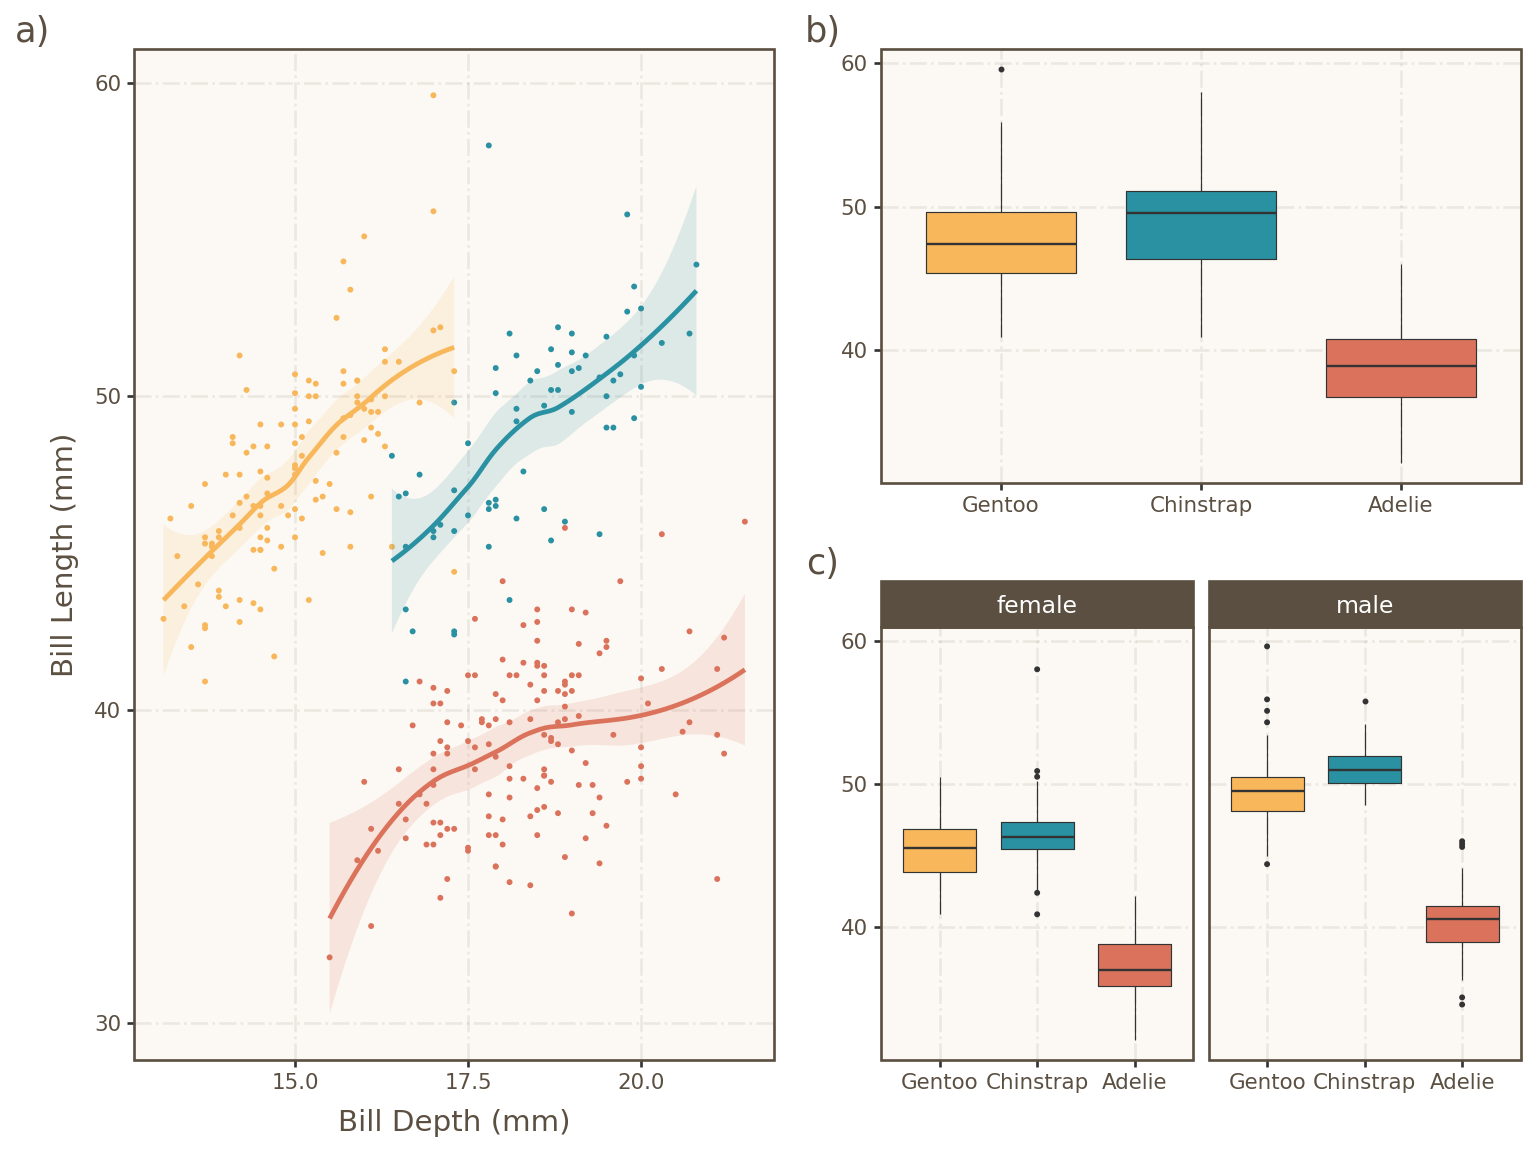
p1 = (
    ggplot(penguins, aes("bill_depth_mm", "bill_length_mm", color="species"))
    + geom_point(size=0.25)
    + stat_smooth(aes(fill="species"), alpha=0.15)
    + labs(x="Bill Depth (mm)", y="Bill Length (mm)", tag="a)")
    + scale_color_and_fill
)

# We reorder the species along the x-axis so that they match up with the apparent
# order in plot p1
p2 = (
    ggplot(penguins, aes("reorder(species, bill_depth_mm, 'max')", "bill_length_mm", fill="species"))
    + geom_boxplot(size=0.25, outlier_size=0.25)
    + labs(x="Species", y="Bill Length (mm)", tag="b)")
    + scale_color_and_fill
    + theme(axis_title=element_blank())
)

p3 = (
    p2
    + facet_wrap("sex")
    + labs(tag="c)")
    + theme(axis_title=element_blank())
)

p1 | p2 / p3