import pandas as pd
from plotnine import ggplot, aes, geom_col

df = pd.DataFrame({
    "x": ["b", "d", "c", "a"],
    "y": [1, 2, 3, 4]
})

ggplot(df, aes("reorder(x, y)", "y")) + geom_col()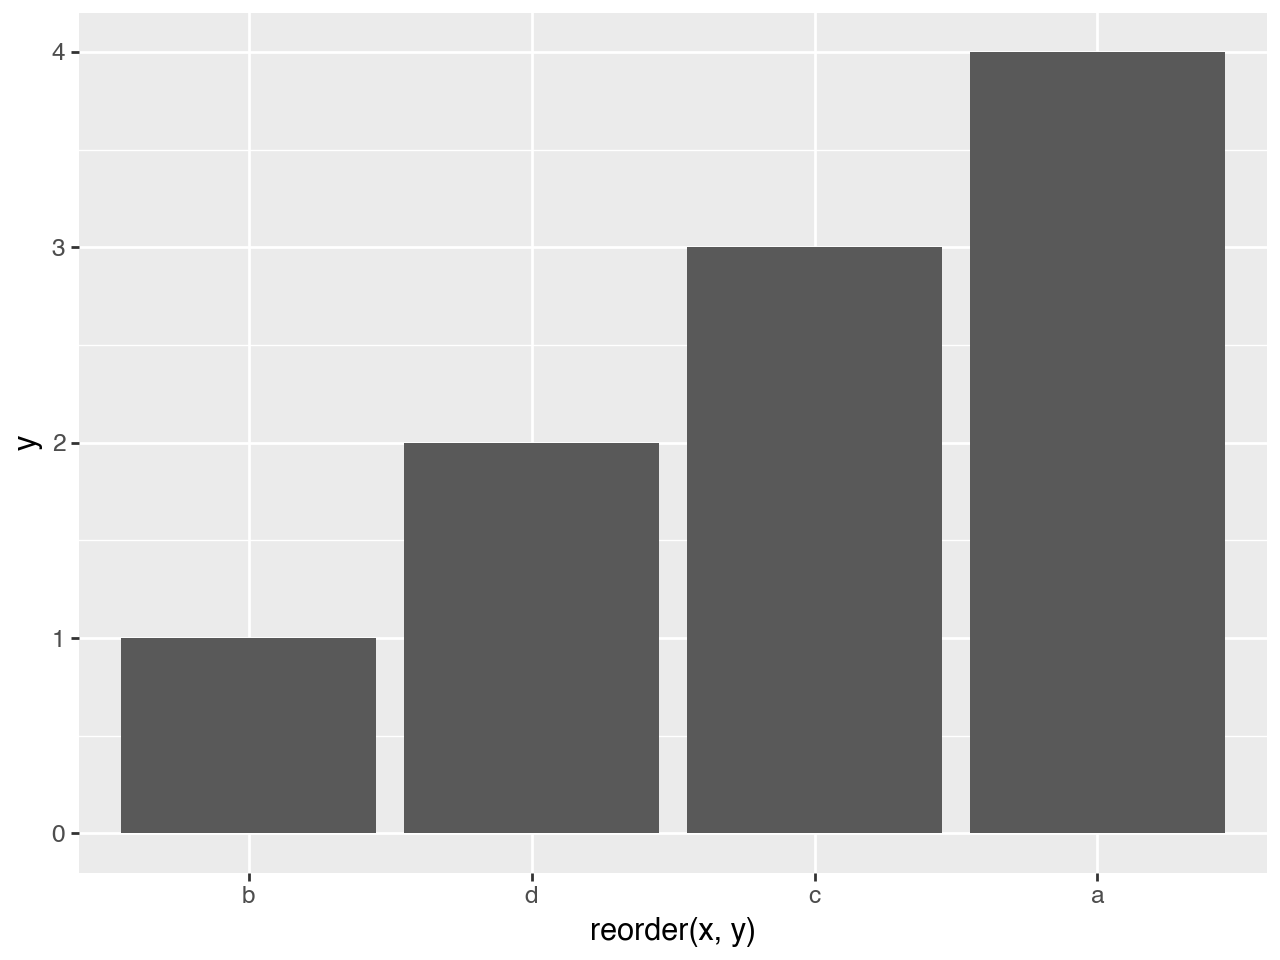
reorder(x, y, fun=np.median, ascending=True)Reorder categorical by sorting along another variable
It is the order of the categories that changes. Values in x are grouped by categories and summarised to determine the new order.
Credit: Copied from plydata
import pandas as pd
from plotnine import ggplot, aes, geom_col
df = pd.DataFrame({
"x": ["b", "d", "c", "a"],
"y": [1, 2, 3, 4]
})
ggplot(df, aes("reorder(x, y)", "y")) + geom_col()