from plotnine import ggplot, aes, geom_count, scale_size_continuous
from plotnine.data import diamondsCategorized Data Plot
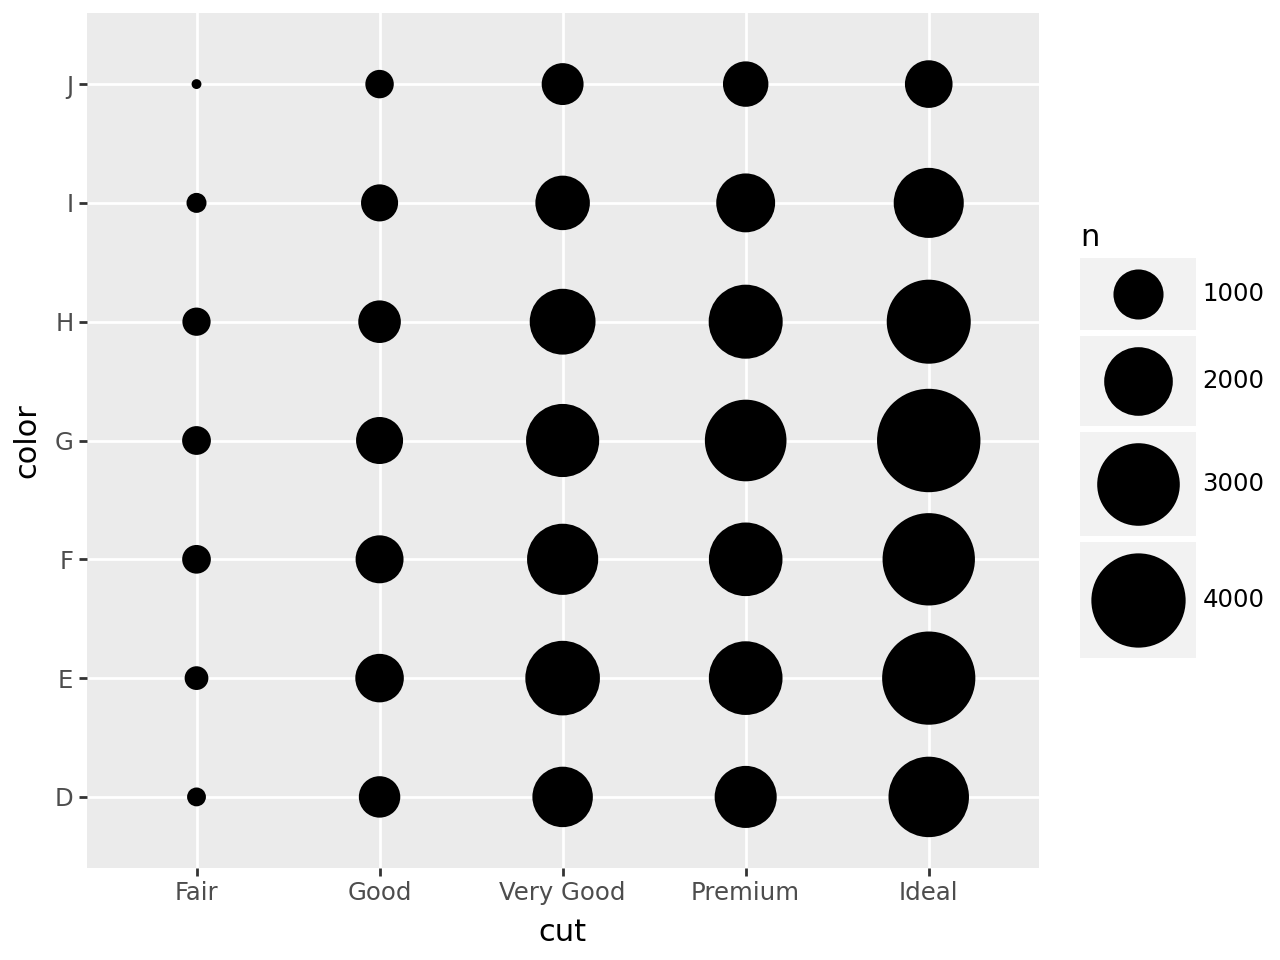
geom_count() makes the point size proportional to the number of points at a location
diamonds.head()| carat | cut | color | clarity | depth | table | price | x | y | z | |
|---|---|---|---|---|---|---|---|---|---|---|
| 0 | 0.23 | Ideal | E | SI2 | 61.5 | 55.0 | 326 | 3.95 | 3.98 | 2.43 |
| 1 | 0.21 | Premium | E | SI1 | 59.8 | 61.0 | 326 | 3.89 | 3.84 | 2.31 |
| 2 | 0.23 | Good | E | VS1 | 56.9 | 65.0 | 327 | 4.05 | 4.07 | 2.31 |
| 3 | 0.29 | Premium | I | VS2 | 62.4 | 58.0 | 334 | 4.20 | 4.23 | 2.63 |
| 4 | 0.31 | Good | J | SI2 | 63.3 | 58.0 | 335 | 4.34 | 4.35 | 2.75 |
(
    ggplot(diamonds)
    + geom_count(aes(x="cut", y="color"))
)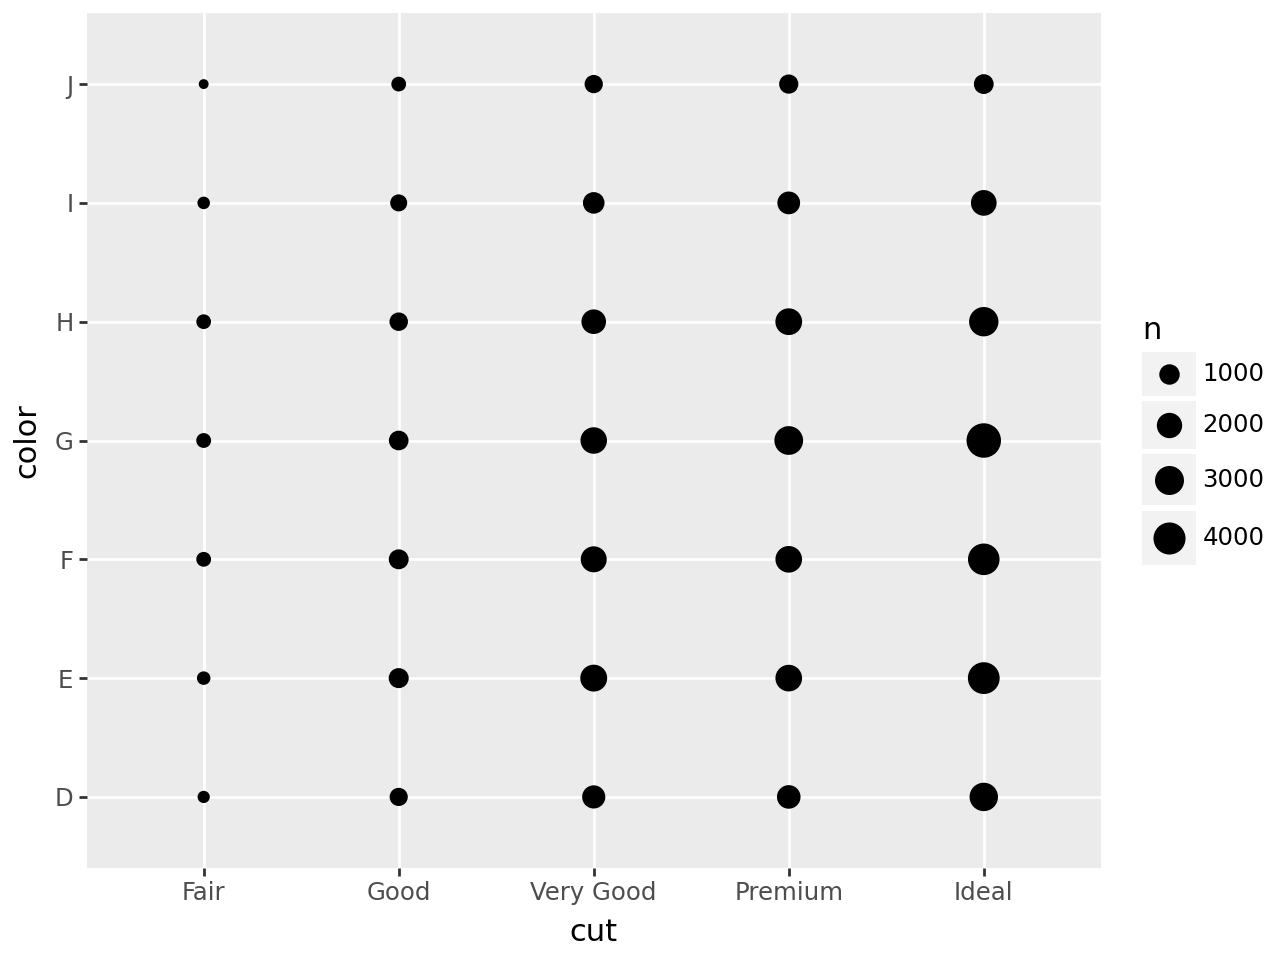
We can adjust the size range of the points with scale_size_continuous
(
    ggplot(diamonds)
    + geom_count(aes(x="cut", y="color"))
    + scale_size_continuous(range=[1, 20])
)