from plotnine import (
    ggplot,
    aes,
    geom_point,
    geom_vline,
    facet_grid,
    labs,
    element_rect,
    theme,
    theme_matplotlib,
    theme_set,
)
from plotnine.data import mpg

# Set default theme
# matplotlib + the background of 538
theme_set(
    theme_matplotlib()
    + theme(
        plot_background=element_rect(fill="#F0F0F0"),
        panel_background=element_rect(fill="#F0F0F0"),
        panel_spacing=0.015,

    )
)Vertical line
geom_vline() draws a vertical line, and is useful as a guide.
mpg.head()| manufacturer | model | displ | year | cyl | trans | drv | cty | hwy | fl | class | |
|---|---|---|---|---|---|---|---|---|---|---|---|
| 0 | audi | a4 | 1.8 | 1999 | 4 | auto(l5) | f | 18 | 29 | p | compact |
| 1 | audi | a4 | 1.8 | 1999 | 4 | manual(m5) | f | 21 | 29 | p | compact |
| 2 | audi | a4 | 2.0 | 2008 | 4 | manual(m6) | f | 20 | 31 | p | compact |
| 3 | audi | a4 | 2.0 | 2008 | 4 | auto(av) | f | 21 | 30 | p | compact |
| 4 | audi | a4 | 2.8 | 1999 | 6 | auto(l5) | f | 16 | 26 | p | compact |
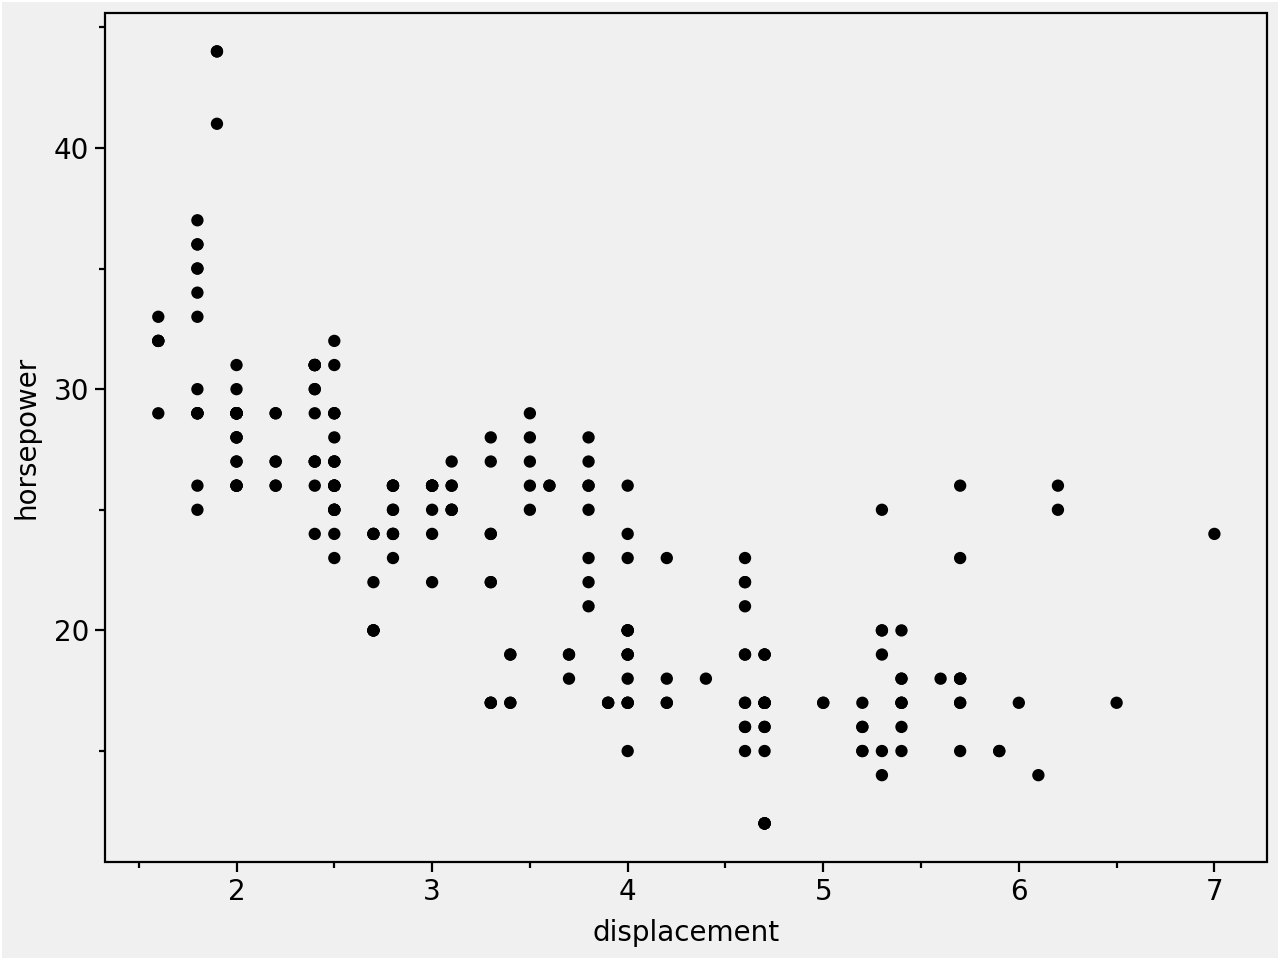
It’s useful to use geom_vline() with some data, so we start with a basic scatter plot:
(
    ggplot(mpg, aes(x="displ", y="hwy"))
    + geom_point()
    + labs(x="displacement", y="horsepower")
)
Add a vertical line to the scatter plot:
(
    ggplot(mpg, aes(x="displ", y="hwy"))
    + geom_point()
    + geom_vline(xintercept=5)  # add one vertical line
    + labs(x="displacement", y="horsepower")
)
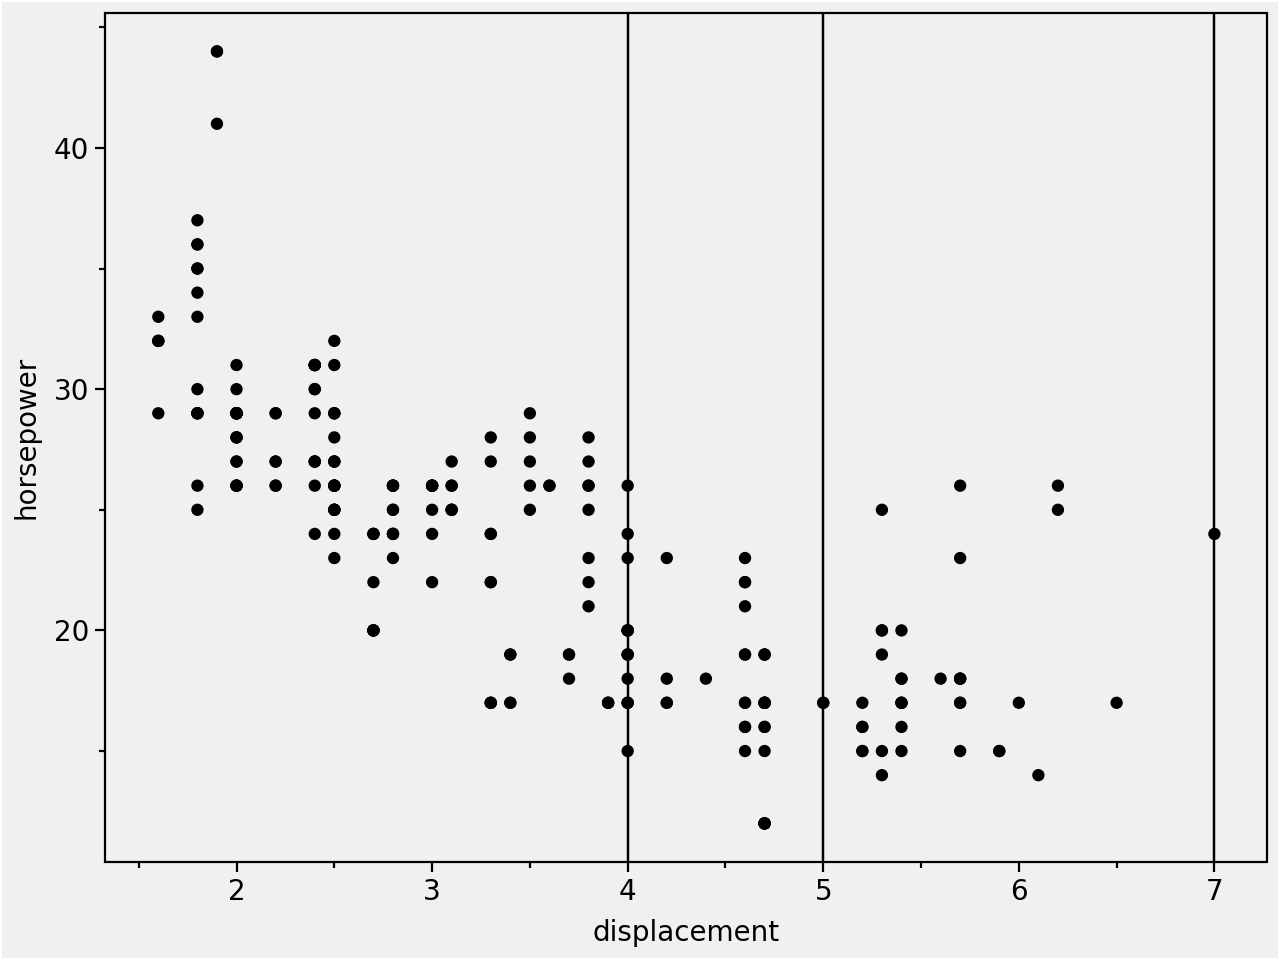
You can add many vertical lines:
(
    ggplot(mpg, aes(x="displ", y="hwy"))
    + geom_point()
    + geom_vline(xintercept=[4, 5, 7])  # add many vertical lines using a list
    + labs(x="displacement", y="horsepower")
)
(
    ggplot(mpg, aes(x="displ", y="hwy"))
    + geom_point()
    + geom_vline(
        xintercept=[4, 5, 7],
        colour=["red", "orange", "green"],  # add colour
        size=[1, 2, 3],  # set line thickness
        linetype="dotted",  # set line type
    )
    + labs(x="displacement", y="horsepower")
)
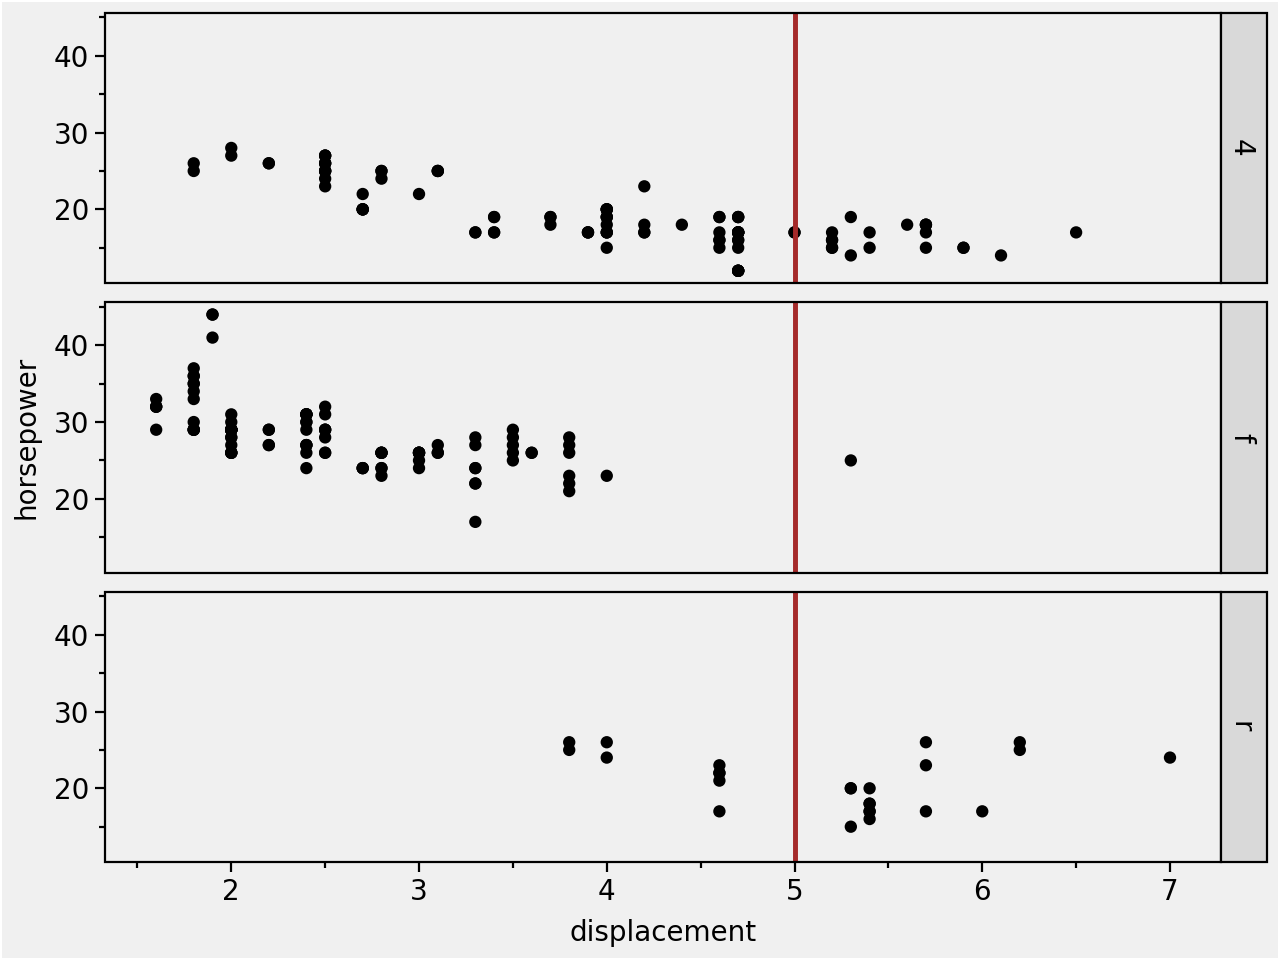
Add vertical lines to a facet plot:
Facets with a Vertical Line
# Gallery, lines
(
    ggplot(mpg, aes(x="displ", y="hwy"))
    + geom_point()
    + geom_vline(xintercept=5, color="brown", size=1)  # add a vertical line...
    + facet_grid("drv")  # ... to a facet plot
    + labs(x="displacement", y="horsepower")
)