%load_ext autoreload
%autoreload 2
%aimport plotnine

import pandas as pd
import numpy as np

from plotnine import (
    ggplot,
    aes,
    after_stat,
    stage,
    geom_bar,
    geom_text,
    geom_bin_2d,
    stat_bin_2d,
)stage
df = pd.DataFrame({
"var1": list("abbcccddddeeeee"),
"cat": list("RSRSRSRRRSRSSRS")
})
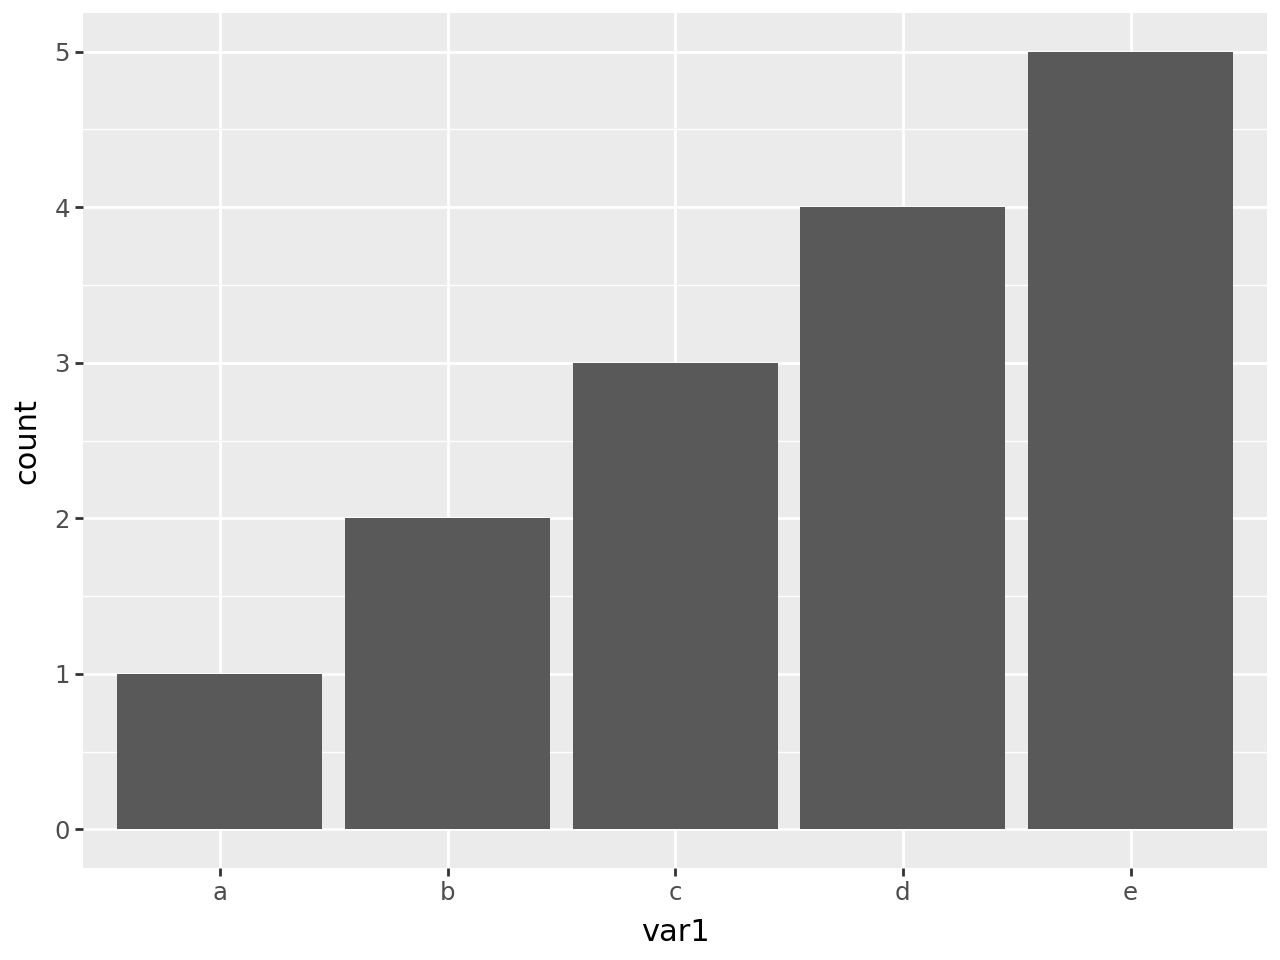
(
ggplot(df, aes("var1"))
+ geom_bar()
)
Add the corresponding count on top of each bar.
(
    ggplot(df, aes("var1"))
    + geom_bar()
    + geom_text(aes(label=after_stat("count")), stat="count")
)
Adjust the y position so that the counts do not overlap the bars.
(
    ggplot(df, aes("var1"))
    + geom_bar()
    + geom_text(
        aes(label=after_stat("count"), y=stage(after_stat="count", after_scale="y+.1")),
        stat="count",
    )
)
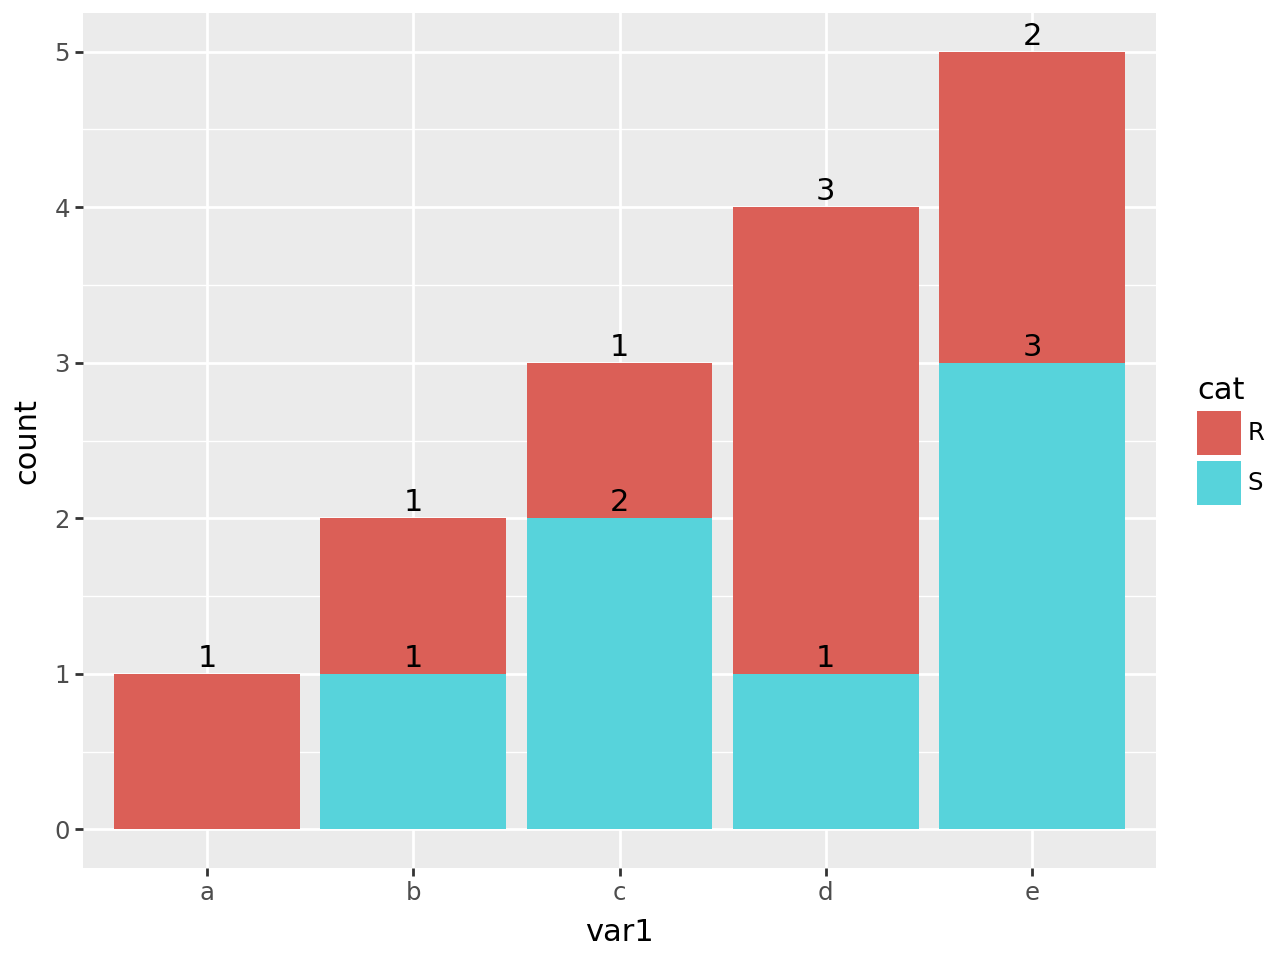
Note that this will work even nicely for stacked bars where adjustig the position with nudge_y=0.1 would not.
(
    ggplot(df, aes("var1", fill="cat"))
    + geom_bar()
    + geom_text(
        aes(label=after_stat("count"), y=stage(after_stat="count", after_scale="y+.1")),
        stat="count",
        position="stack",
    )
)
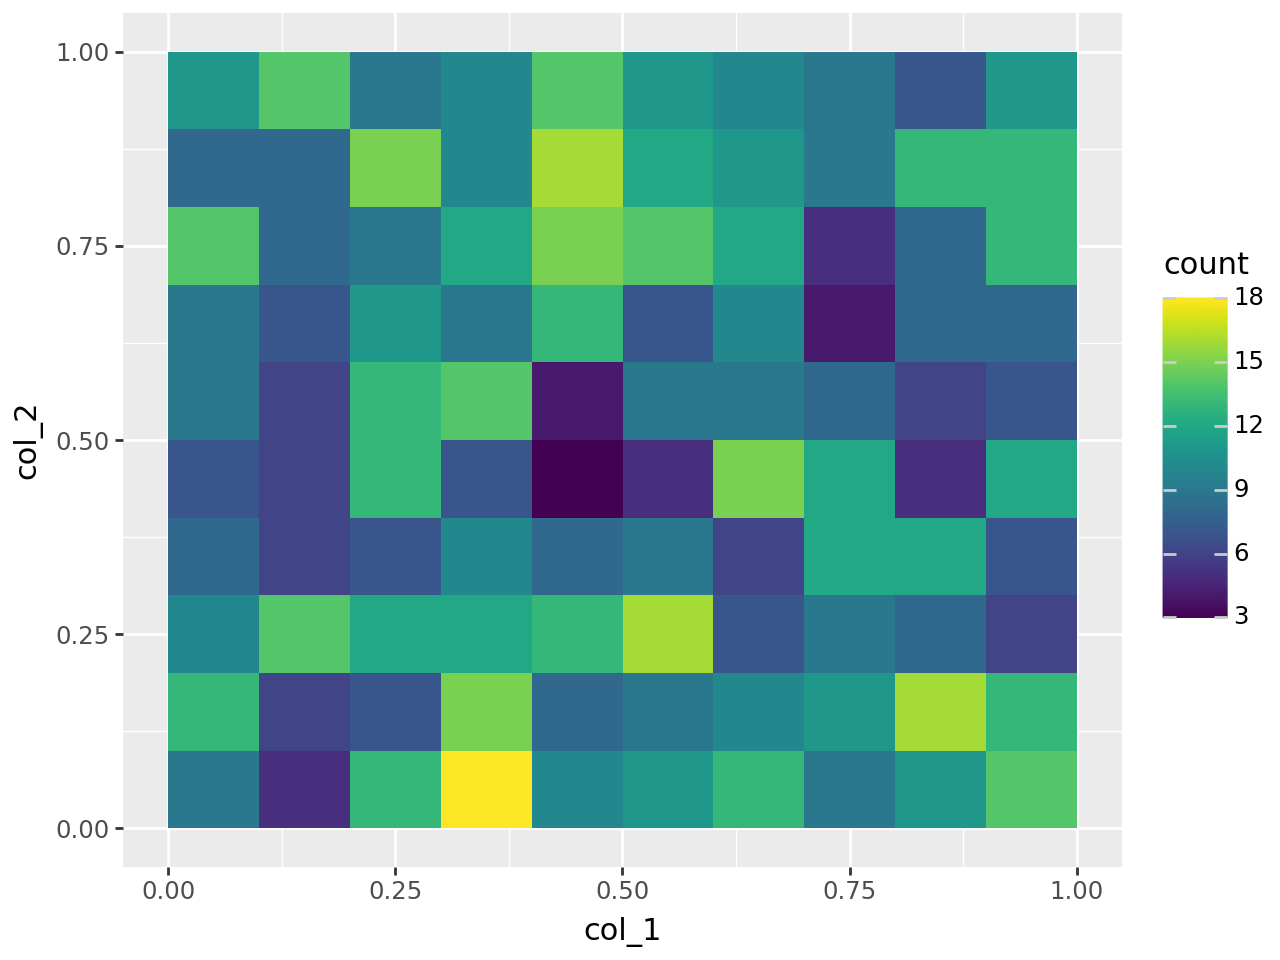
Create a binned 2d plot with counts
np.random.seed(123)
df = pd.DataFrame({
    "col_1": np.random.rand(1000),
    "col_2": np.random.rand(1000)
})
(
ggplot(df, aes(x="col_1", y="col_2"))
+ geom_bin_2d(position="identity", binwidth=0.1)
)
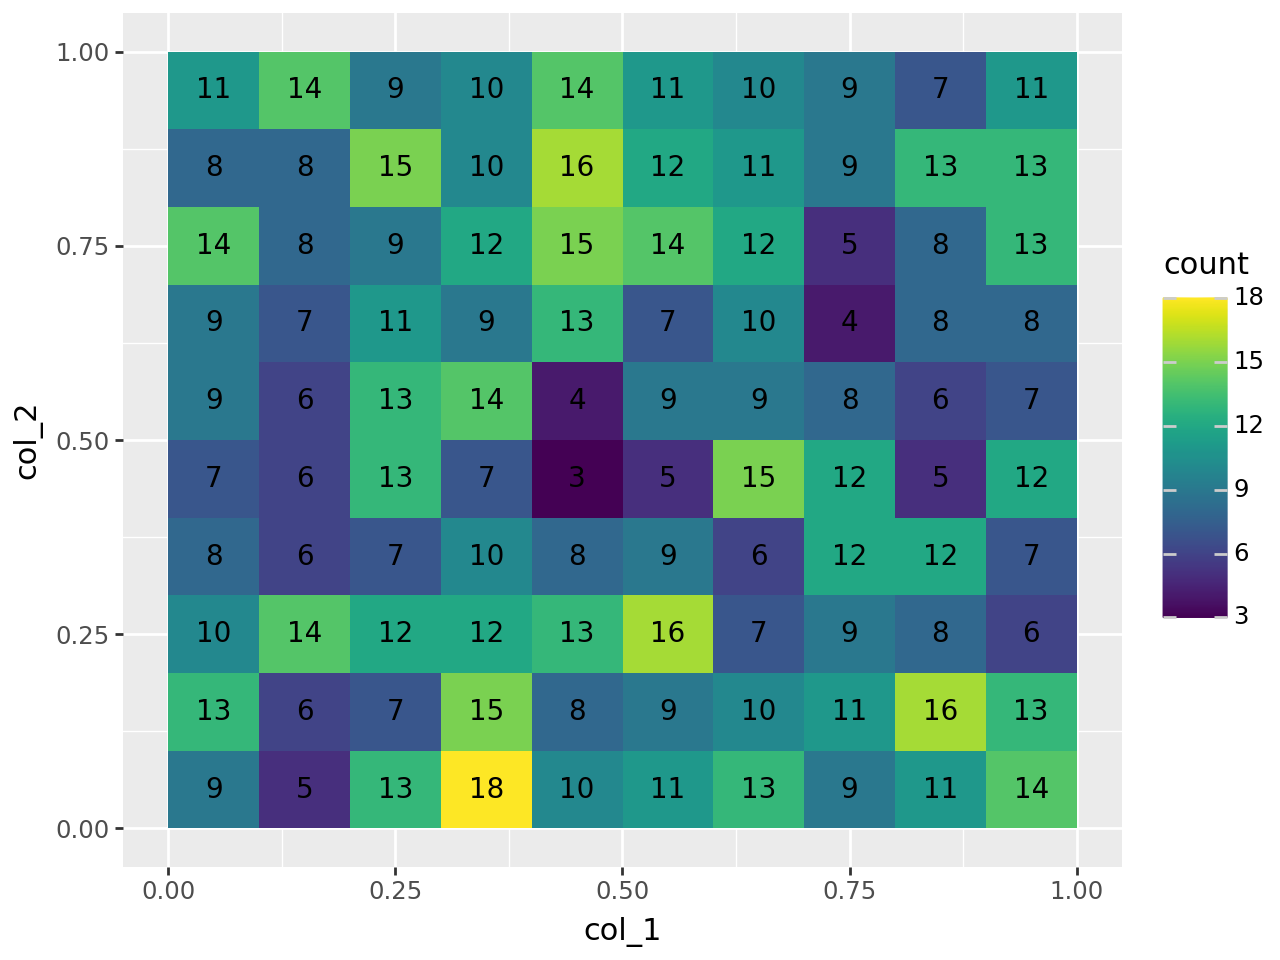
Add counts to the bins. stat_bin_2d bins are specified using retangular minimum and maximum end-points for dimension; we use these values to compute the mid-points at which to place the counts.
First x and y aesthetics are mapped to col_1 and col_2 variables, then after the statistic consumes them and creates xmin, xmax, ymin & ymax values for each bin along with associated count. After the statistic computation the x and y aesthetics do not exist, but we create meaningful values using the minimum and maximum end-points.
Note that the binning parameters for the geom and stat combination must be the same. In this case it is the binwidth.
(
    ggplot(df, aes(x="col_1", y="col_2"))
    + geom_bin_2d(position="identity", binwidth=0.1)
    + stat_bin_2d(
        aes(
            x=stage(start="col_1", after_stat="(xmin+xmax)/2"),
            y=stage(start="col_2", after_stat="(ymin+ymax)/2"),
            label=after_stat("count"),
        ),
        binwidth=0.1,
        geom="text",
        format_string="{:.0f}",
        size=10,
    )
)