from plotnine import ggplot, aes, geom_bar
from plotnine.data import mtcars

ggplot(mtcars, aes(x="factor(cyl)")) + geom_bar()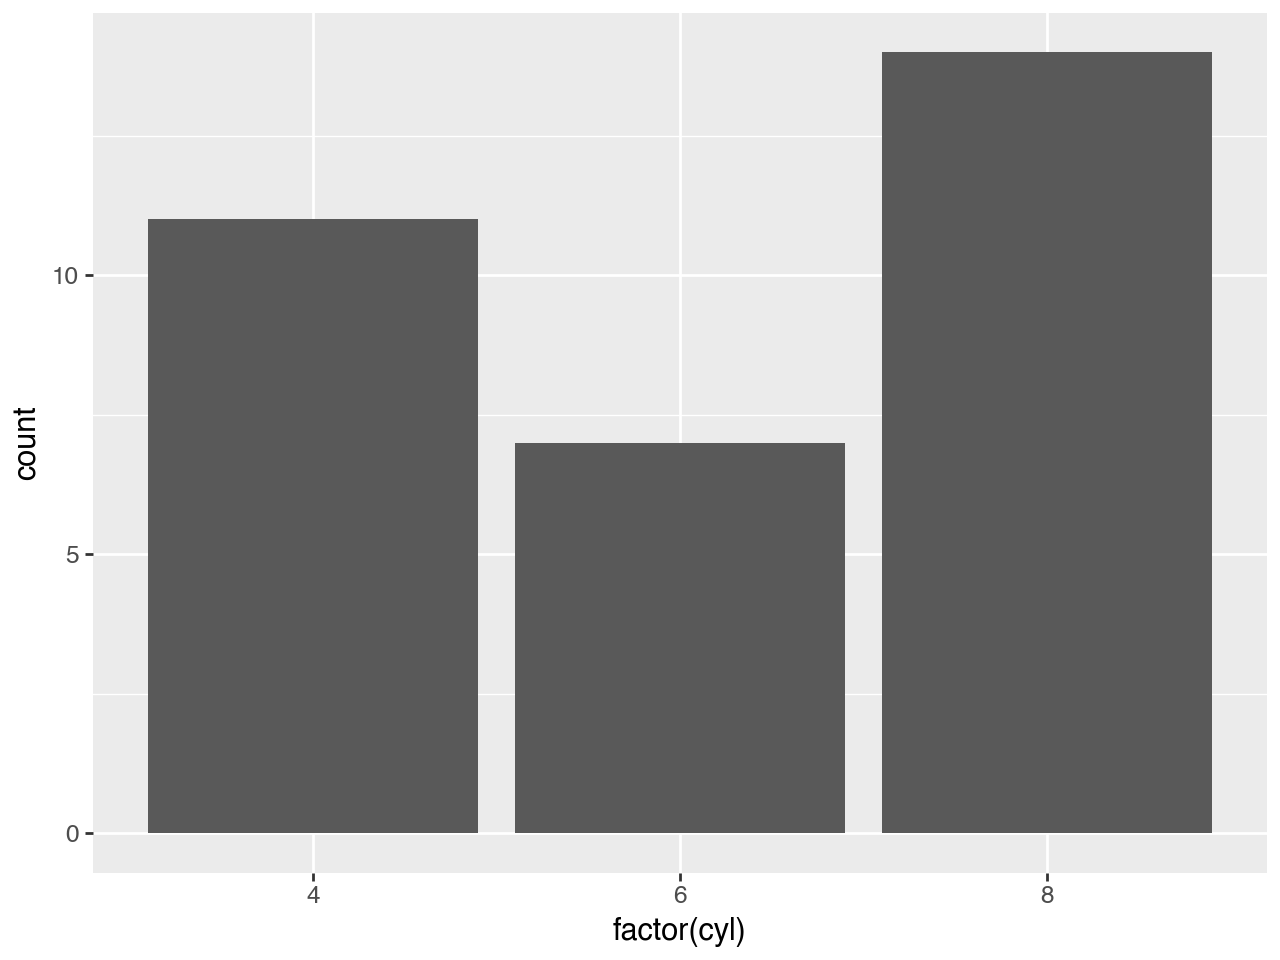
factor(values, categories=None, ordered=None)Turn x in to a categorical (factor) variable
It is just an alias to pandas.Categorical
values : Sequence[Any]The values of the categorical. If categories are given, values not in categories will be replaced with NaN.
categories : Sequence[Any] | None = NoneThe unique categories for this categorical. If not given, the categories are assumed to be the unique values of values (sorted, if possible, otherwise in the order in which they appear).
ordered : bool | None = NoneWhether or not this categorical is treated as a ordered categorical. If True, the resulting categorical will be ordered. An ordered categorical respects, when sorted, the order of its categories attribute (which in turn is the categories argument, if provided).
from plotnine import ggplot, aes, geom_bar
from plotnine.data import mtcars
ggplot(mtcars, aes(x="factor(cyl)")) + geom_bar()