from plotnine import (
aes,
annotate,
coord_equal,
element_rect,
element_text,
facet_wrap,
geom_point,
geom_segment,
geom_text,
geom_tile,
ggplot,
lims,
scale_shape_identity,
theme,
theme_void,
)
import polars as pl
import numpy as np
scale_shape_identity(
    *,
    name=None,
    breaks=True,
    limits=None,
    labels=True,
    expand=None,
    guide=None,
    na_value=np.nan,
    aesthetics=(),
    drop=True,
    na_translate=True
)
No shape scaling
Parameter Attributes
name: str | None = None-
The name of the scale. It is used as the label of the axis or the title of the guide. Suitable defaults are chosen depending on the type of scale.
breaks: DiscreteBreaksUser = True-
List of major break points. Or a callable that takes a tuple of limits and returns a list of breaks. If
True, automatically calculate the breaks. limits: DiscreteLimitsUser = None-
Limits of the scale. These are the categories (unique values) of the variables. If is only a subset of the values, those that are left out will be treated as missing data and represented with a
na_value. labels: ScaleLabelsUser = True-
Labels at the
breaks. Alternatively, a callable that takes an array_like of break points as input and returns a list of strings. expand: (
tuple[float, float]
| tuple[float, float, float, float]
| None
) = None-
Multiplicative and additive expansion constants that determine how the scale is expanded. If specified must be of length 2 or 4. Specifically the values are in this order:
(mul, add)
(mul_low, add_low, mul_high, add_high)
For example,
(0, 0)- Do not expand.(0, 1)- Expand lower and upper limits by 1 unit.(1, 0)- Expand lower and upper limits by 100%.(0, 0, 0, 0)- Do not expand, as(0, 0).(0, 0, 0, 1)- Expand upper limit by 1 unit.(0, 1, 0.1, 0)- Expand lower limit by 1 unit and upper limit by 10%.(0, 0, 0.1, 2)- Expand upper limit by 10% plus 2 units.
If not specified, suitable defaults are chosen.
guide: Literal["legend"] | None = Nonena_value: Any = np.nan-
If
na_translate=True, what aesthetic value should be assigned to the missing values. This parameter does not apply to position scales wherenanis always placed on the right. aesthetics: Sequence[ScaledAestheticsName] = ()-
Aesthetics affected by this scale. These are defined by each scale and the user should probably not change them. Have fun.
drop: bool = True-
Whether to drop unused categories from the scale
na_translate: bool = True-
If
Truetranslate missing values and show them. IfFalseremove missing values.
Examples
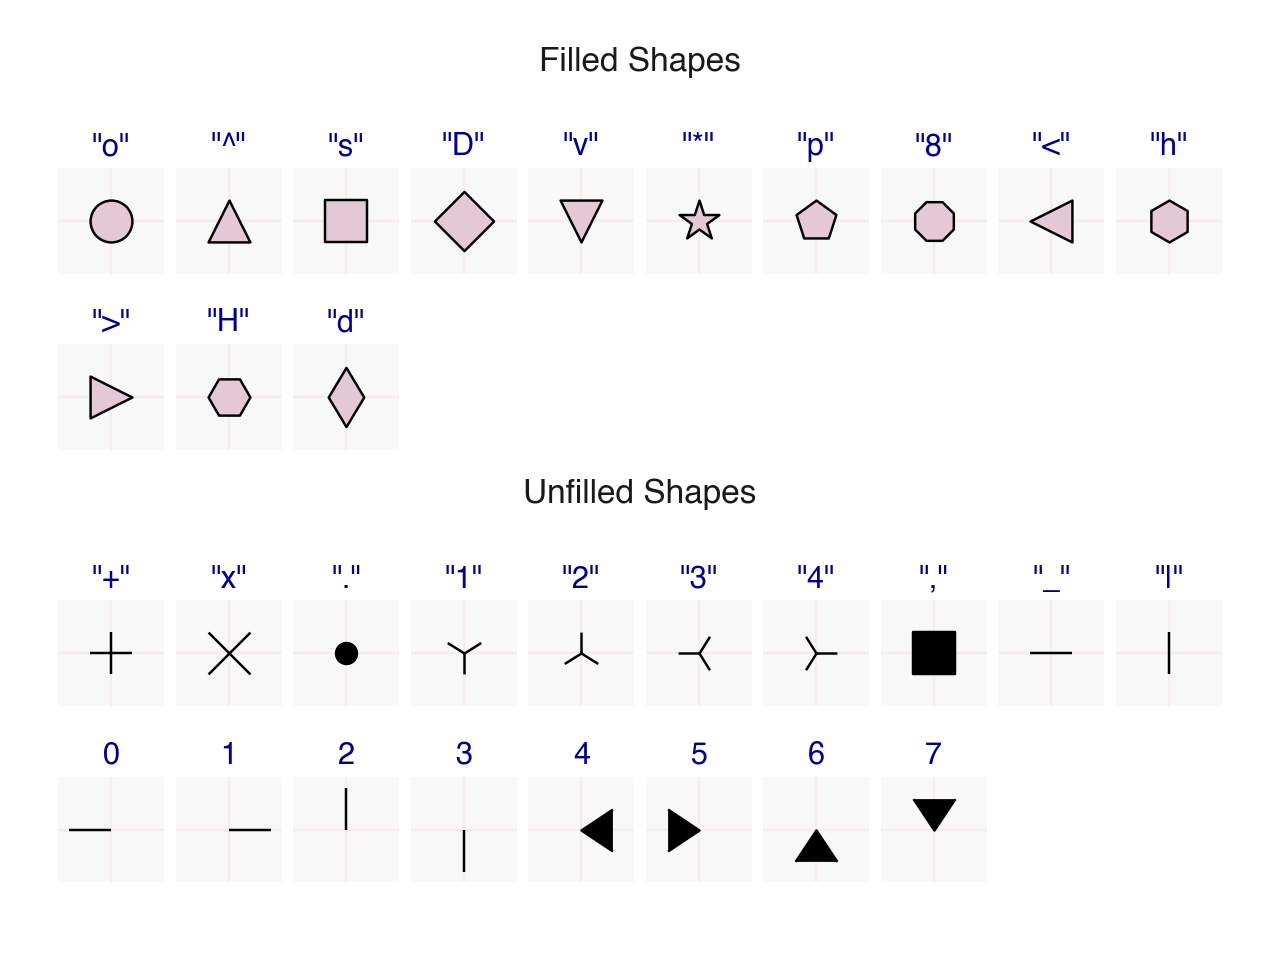
Scatter Plot Shapes
List the shapes and prepare dataframe with what is required to display them.
filled_shapes = (
    "o",  # circle
    "^",  # triangle up
    "s",  # square
    "D",  # Diamond
    "v",  # triangle down
    "*",  # star
    "p",  # pentagon
    "8",  # octagon
    "<",  # triangle left
    "h",  # hexagon1
    ">",  # triangle right
    "H",  # hexagon1
    "d",  # thin diamond
)

unfilled_shapes = (
    "+",  # plus
    "x",  # x
    ".",  # point
    "1",  # tri_down
    "2",  # tri_up
    "3",  # tri_left
    "4",  # tri_right
    ",",  # pixel
    "_",  # hline
    "|",  # vline
    0,  # tickleft
    1,  # tickright
    2,  # tickup
    3,  # tickdown
    4,  # caretleft
    5,  # caretright
    6,  # caretup
    7,  # caretdown
)

n1 = len(filled_shapes)
n2 = len(unfilled_shapes)
ncols = 10
shapes = filled_shapes + unfilled_shapes

df = pl.DataFrame({
    "x": np.hstack([np.arange(n1) % ncols, np.arange(n2) % ncols]),
    "y": 4 - 1.5 * np.hstack([np.arange(n1) // ncols, np.arange(n2) // ncols]),
    "shape": pl.Series(shapes, dtype=object),
    "shape_kind": np.repeat(["Filled Shapes", "Unfilled Shapes"], (n1, n2))
})

df
shape: (31, 4)
| x | y | shape | shape_kind |
|---|---|---|---|
| i64 | f64 | object | str |
| 0 | 4.0 | o | "Filled Shapes" |
| 1 | 4.0 | ^ | "Filled Shapes" |
| 2 | 4.0 | s | "Filled Shapes" |
| 3 | 4.0 | D | "Filled Shapes" |
| 4 | 4.0 | v | "Filled Shapes" |
| … | … | … | … |
| 3 | 2.5 | 3 | "Unfilled Shapes" |
| 4 | 2.5 | 4 | "Unfilled Shapes" |
| 5 | 2.5 | 5 | "Unfilled Shapes" |
| 6 | 2.5 | 6 | "Unfilled Shapes" |
| 7 | 2.5 | 7 | "Unfilled Shapes" |
# Gallery, points

def double_quote_strings(series):
    return [
        '"{}"'.format(s) if isinstance(s, str) else "{}".format(s)
        for s in series
    ]

(
    ggplot(df, aes("x", "y"))

    # Background
    + geom_tile(aes(width=0.9, height=0.9), fill="#F8F8F8")

    # Cross-grid to help see the centering of the shapes
    + geom_segment(aes(x="x-0.45", xend="x+0.45", yend="y"), color="Crimson", alpha=0.05)
    + geom_segment(aes(xend="x", y="y-0.45", yend="y+0.45"), color="Crimson", alpha=0.05)

    # The shape
    + geom_point(aes(shape="shape"), fill="#E5C8D6", size=8)

    # Specification value for the shape
    + geom_text(
        aes(y="y+.5", label="double_quote_strings(shape)"),
        color="darkblue",
        va="bottom",
    )

    # Separate the shapes by their kind
    + facet_wrap("shape_kind", ncol=1)

    # Make things pretty
    + lims(y=(2, 5))
    + scale_shape_identity()
    + coord_equal()
    + theme_void()
    + theme(
        plot_background=element_rect(fill="white"),
        strip_text=element_text(size=12)
    )
)