import pandas as pd
import numpy as np
from plotnine import ggplot, aes, geom_point
aes(x=None, y=None, **kwargs)Create aesthetic mappings
Parameters
x : str | array_like | scalar = None-
x aesthetic mapping
y : str | array_like | scalar = None-
y aesthetic mapping
**kwargs : Any-
Other aesthetic mappings
Notes
Only the x and y aesthetic mappings can be specified as positional arguments. All the rest must be keyword arguments.
The value of each mapping must be one of:
str
 import pandas as pd
 import numpy as np

 arr = [11, 12, 13]
 df = pd.DataFrame({
     "alpha": [1, 2, 3],
     "beta": [1, 2, 3],
     "gam ma": [1, 2, 3]
 })

 # Refer to a column in a dataframe
 ggplot(df, aes(x="alpha", y="beta"))
array_like
# A variable
ggplot(df, aes(x="alpha", y=arr))

# or an inplace list
ggplot(df, aes(x="alpha", y=[4, 5, 6]))
scalar
# A scalar value/variable
ggplot(df, aes(x="alpha", y=4))

# The above statement is equivalent to
ggplot(df, aes(x="alpha", y=[4, 4, 4]))
String expression
ggplot(df, aes(x="alpha", y="2*beta"))
ggplot(df, aes(x="alpha", y="np.sin(beta)"))
ggplot(df, aes(x="df.index", y="beta"))

# If `count` is an aesthetic calculated by a stat
ggplot(df, aes(x="alpha", y=after_stat("count")))
ggplot(df, aes(x="alpha", y=after_stat("count/np.max(count)")))
The strings in the expression can refer to;
- columns in the dataframe
- variables in the namespace
- aesthetic values (columns) calculated by the
stat
with the column names having precedence over the variables. For expressions, columns in the dataframe that are mapped to must have names that would be valid python variable names.
This is okay:
# "gam ma" is a column in the dataframe
ggplot(df, aes(x="df.index", y="gam ma"))
While this is not:
# "gam ma" is a column in the dataframe, but not
# valid python variable name
ggplot(df, aes(x="df.index", y="np.sin(gam ma)"))
aes has 2 internal functions that you can use in your expressions when transforming the variables.
The group aesthetic
group is a special aesthetic that the user can map to. It is used to group the plotted items. If not specified, it is automatically computed and in most cases the computed groups are sufficient. However, there may be cases were it is handy to map to it.
See Also
after_stat-
For how to map aesthetics to variable calculated by the stat
after_scale-
For how to alter aesthetics after the data has been mapped by the scale.
stage-
For how to map to evaluate the mapping to aesthetics at more than one stage of the plot building pipeline.
Examples
aes
Mapping variables to the visual properties of a plot.
df = pd.DataFrame({
"col1": np.arange(11),
"col2": np.arange(11)
})
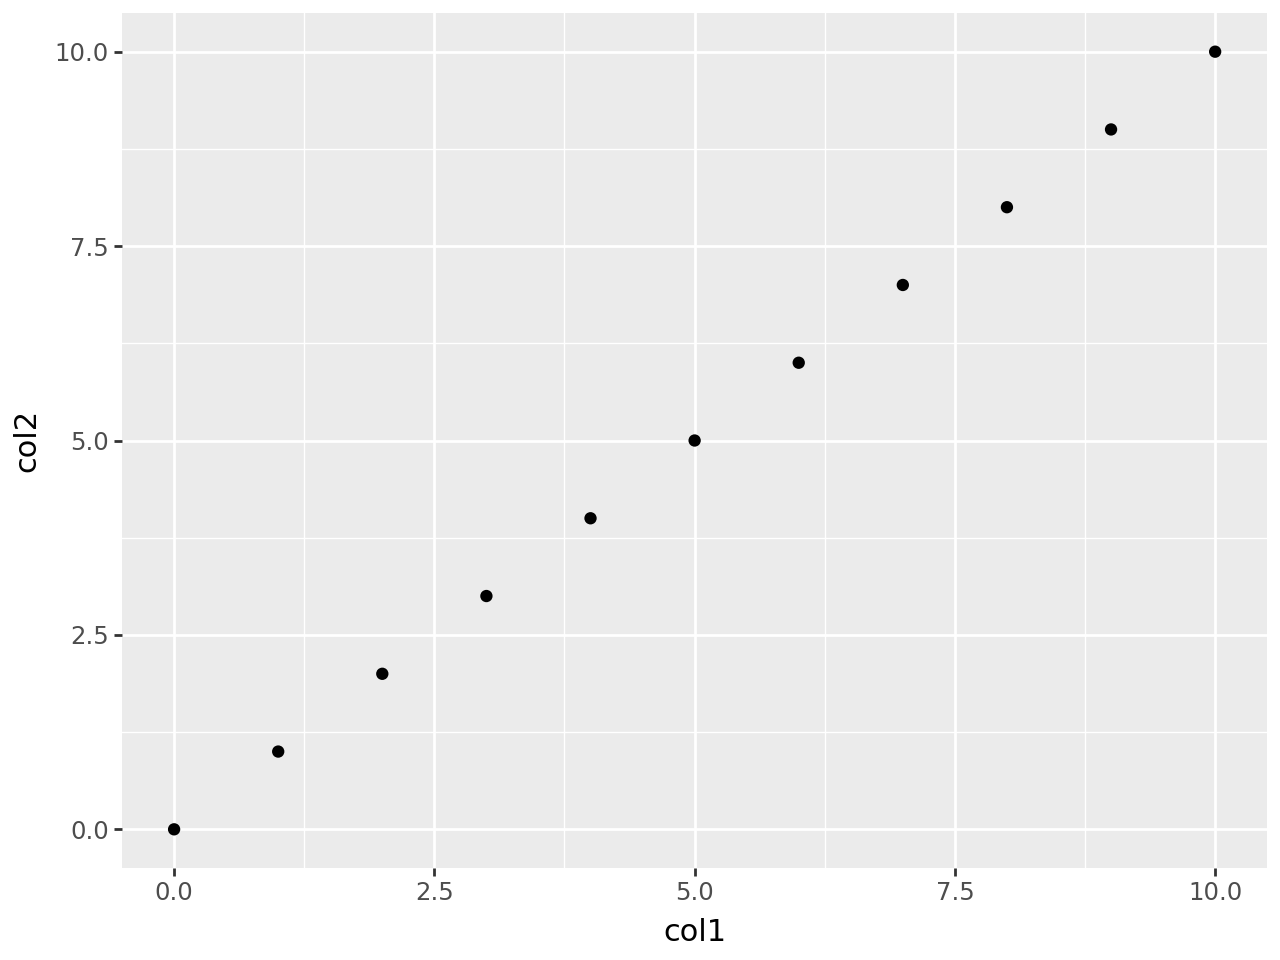
(
ggplot(df, aes(x="col1", y="col2"))
+ geom_point()
)
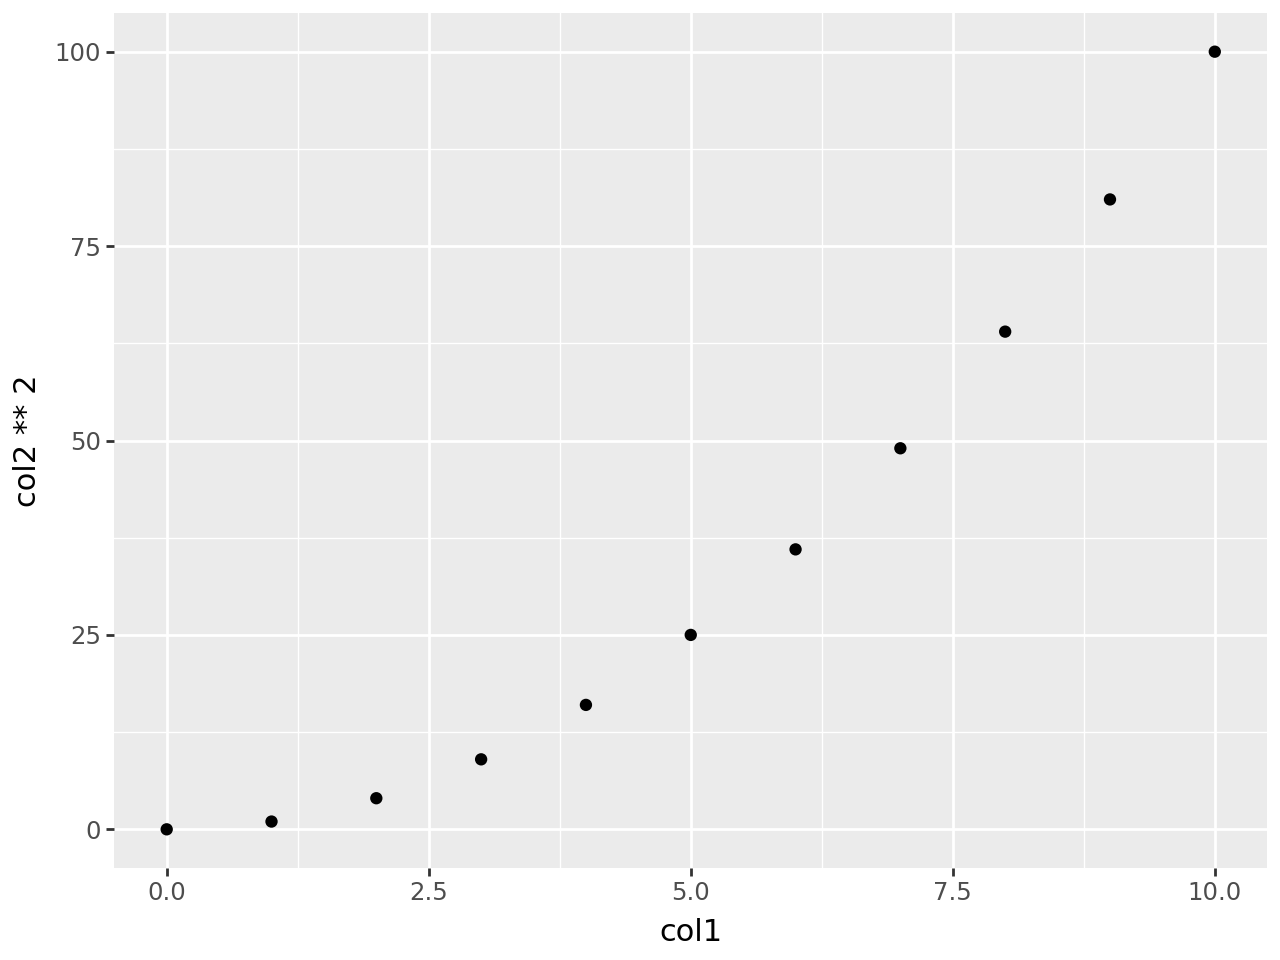
(
    ggplot(df, aes(x="col1", y="col2 ** 2"))
    + geom_point()
)
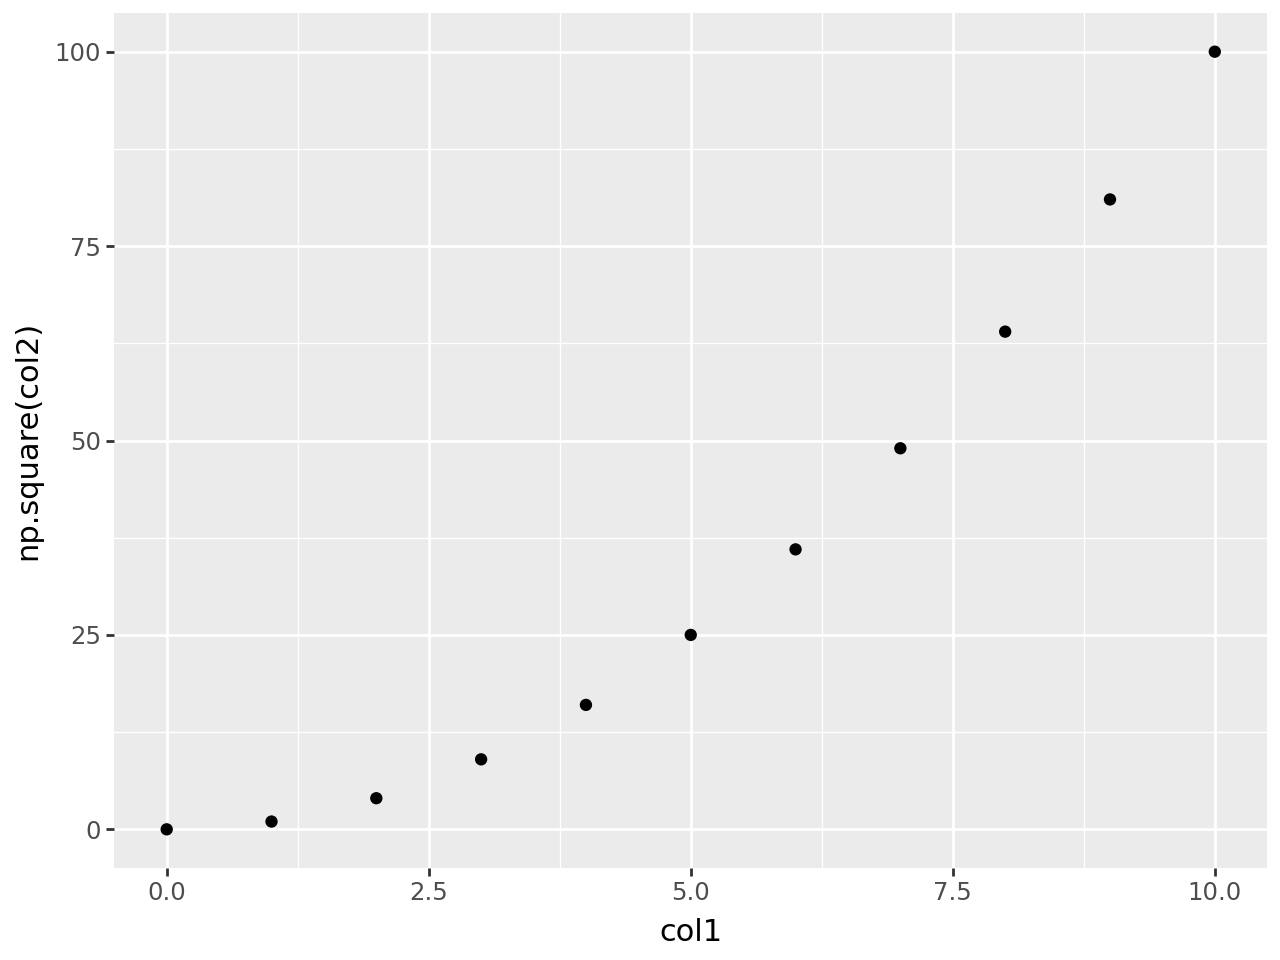
(
    ggplot(df, aes(x="col1", y="np.square(col2)"))
    + geom_point()
)
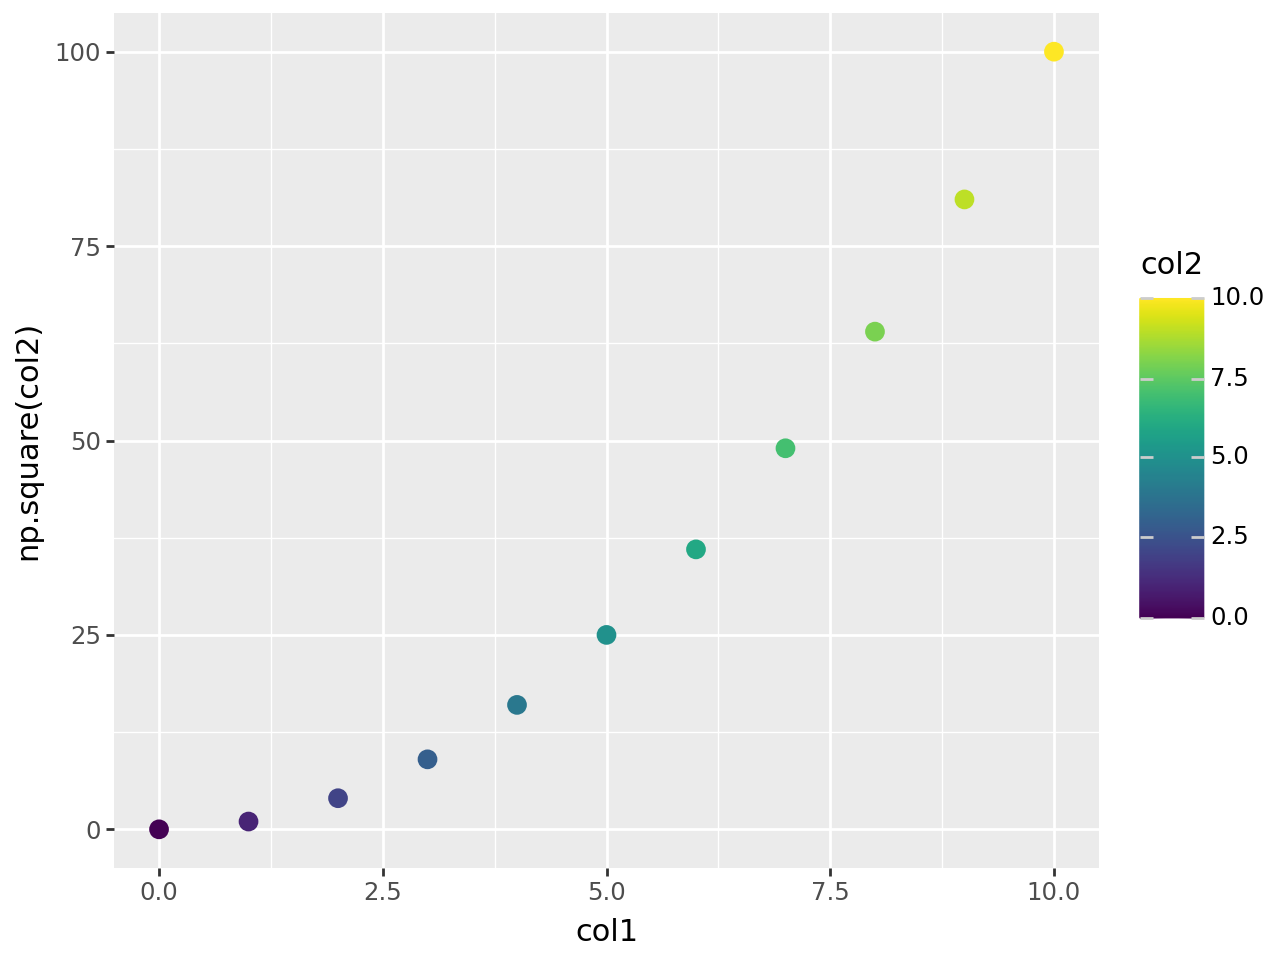
The first two positional arguments are x and y aesthetics. Any other aesthetic must be mapped with a keyword argument.
(
    ggplot(df, aes("col1", "np.square(col2)", color="col2"))
    + geom_point(size=3)
)