from plotnine import *
from plotnine.composition import Stack
from plotnine.data import huron
Stack(items)Place plots or compositions on top of each other
Usage
plot / plot
plot / composition
composition / plot
composition / composition
Typically, you will use this class through the / operator.
Parameter Attributes
See Also
Beside-
To arrange plots side by side
plot_spacer-
To add a blank space between plots
Compose-
For more on composing plots
Examples
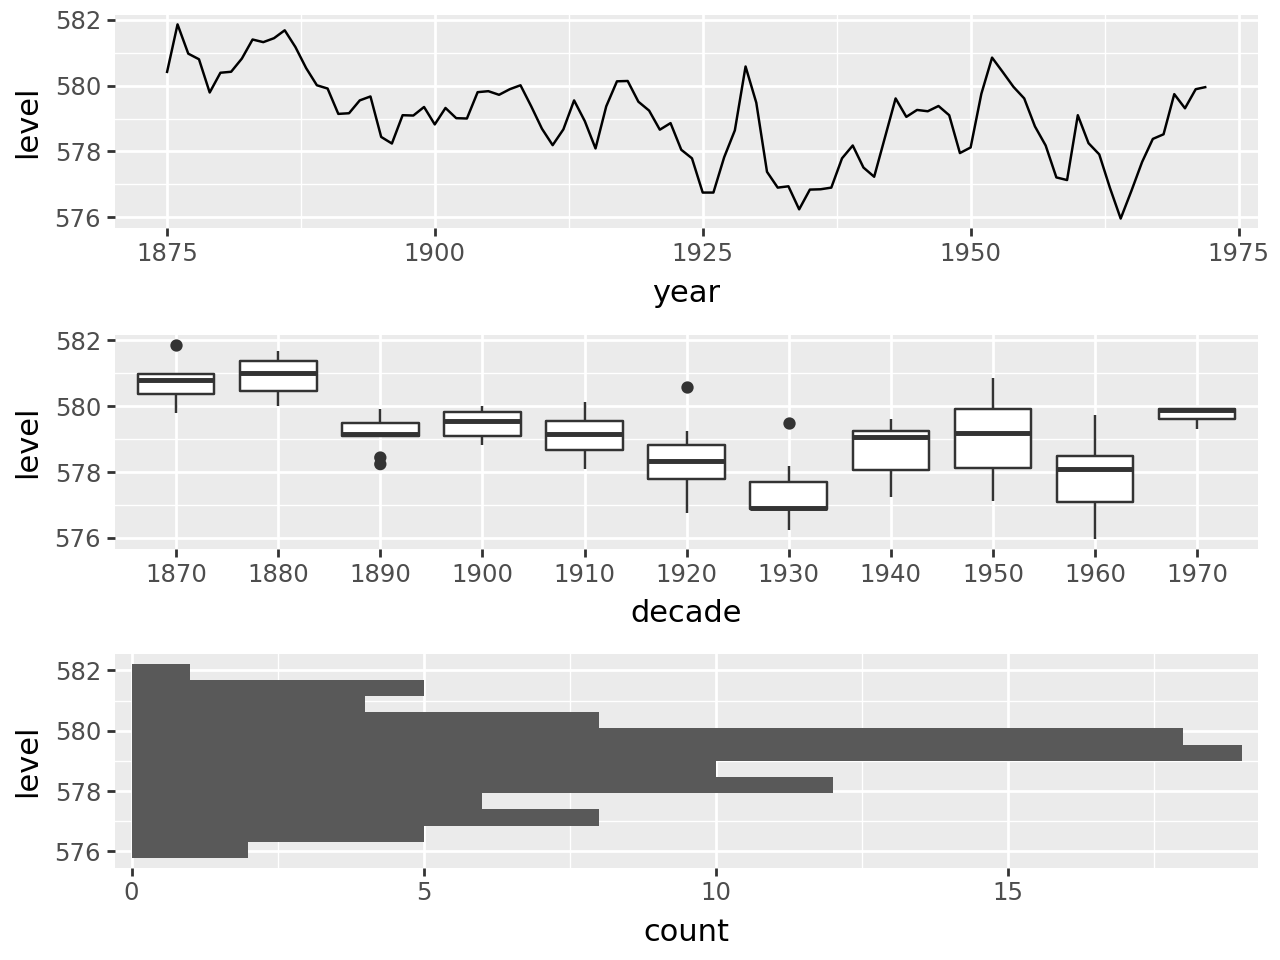
p1 = (
    ggplot(huron, aes("year", "level"))
    + geom_line()
)

p2 = (
    ggplot(huron, aes("factor(decade)", "level"))
    + geom_boxplot()
    + labs(x="decade")
)

p3 = (
    ggplot(huron, aes("level"))
    + geom_histogram(bins=12)
    + scale_y_continuous(expand=(0.015, 0))
    + coord_flip()
)

p1 / p2 / p3
Which is equivalent to
Stack([p1, p2, p3])