Blank area as wide or as tall as a plot
See Also
Beside-
To arrange plots side by side
Stack-
To arrange plots vertically
Compose-
For more on composing plots
Examples
from plotnine import ggplot, aes, geom_point, geom_boxplot, theme, element_rect
from plotnine.composition import plot_spacer
from plotnine.data import mtcars
p1 = ggplot(mtcars, aes("wt", "mpg")) + geom_point()
p2 = ggplot(mtcars, aes("wt", "disp")) + geom_point()
p3 = ggplot(mtcars, aes("factor(cyl)", "wt")) + geom_boxplot()

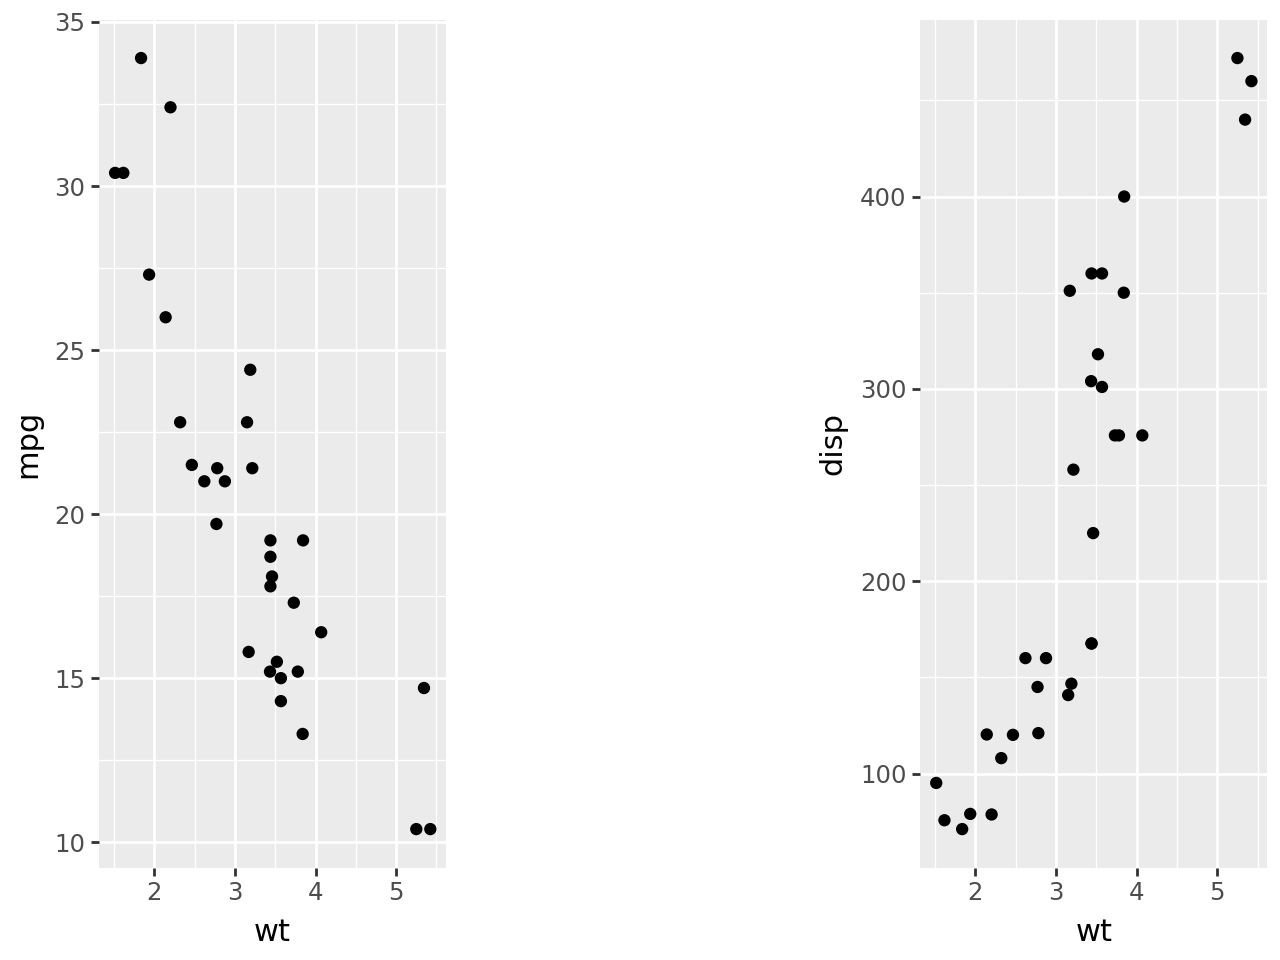
p1 | plot_spacer() | p2
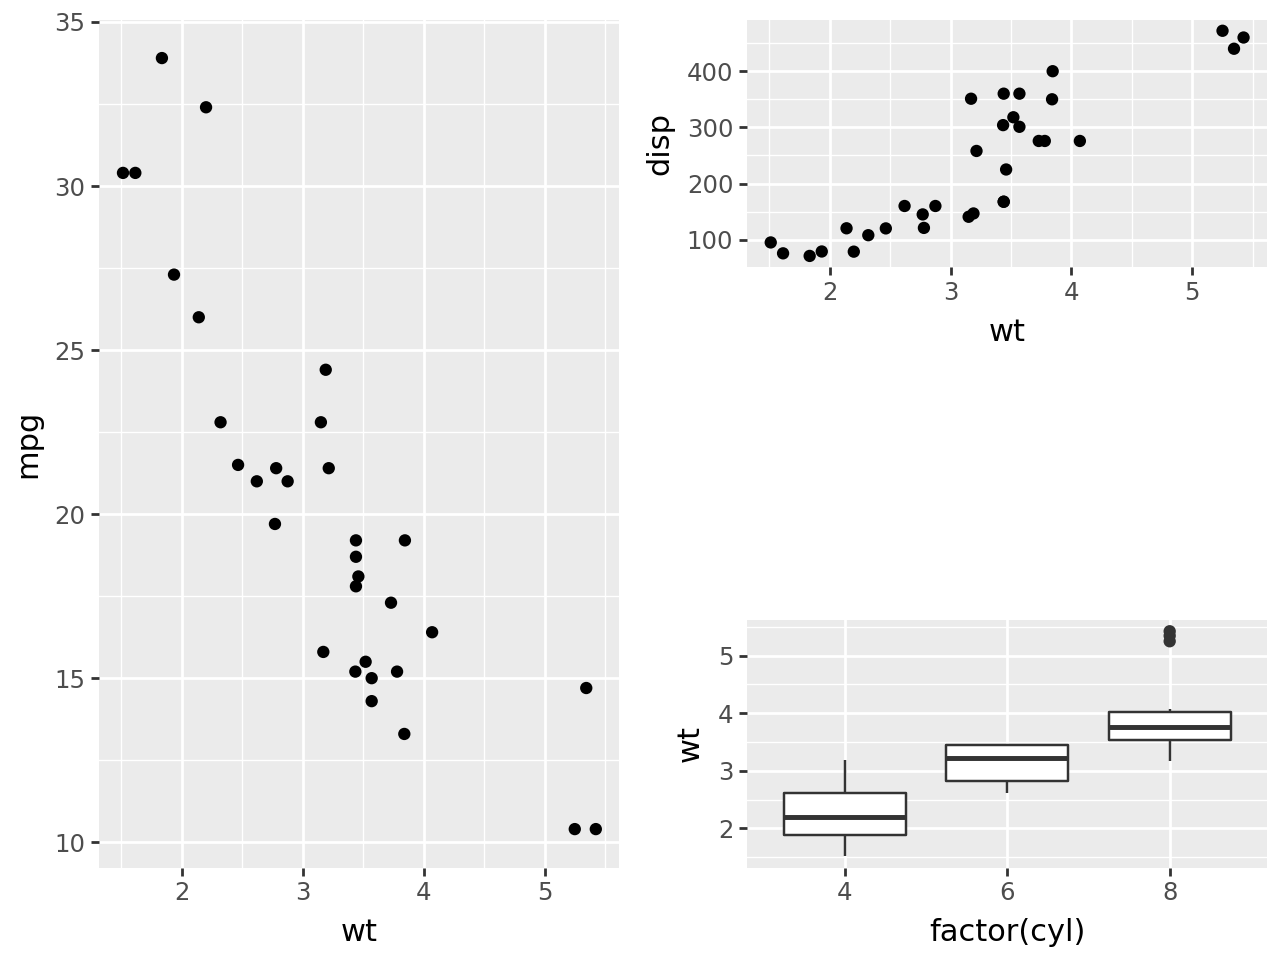
p1 | (p2 / plot_spacer() / p3)
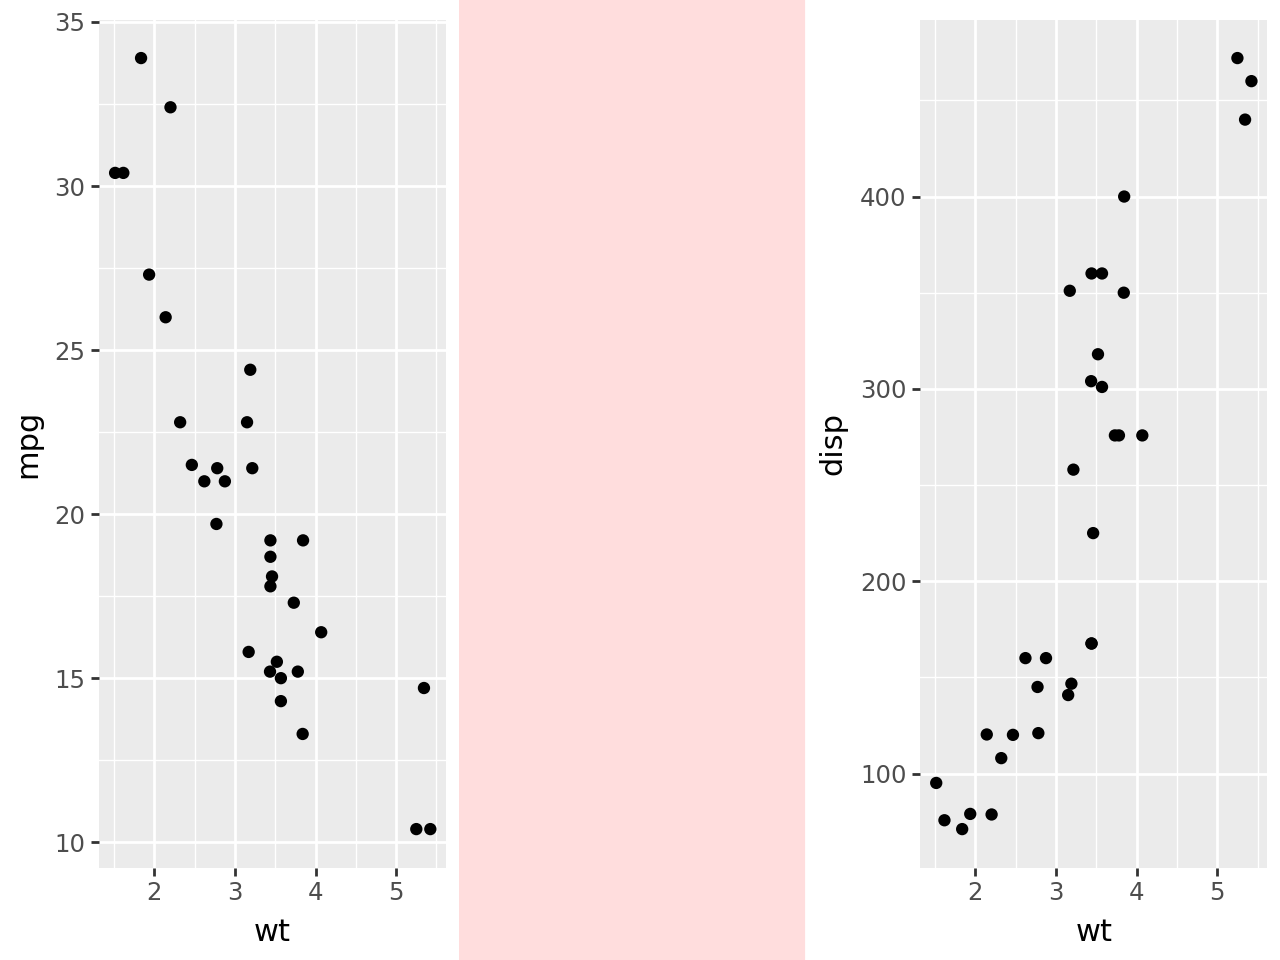
Change the color of the space.
p1 | plot_spacer("#FF000022") | p2
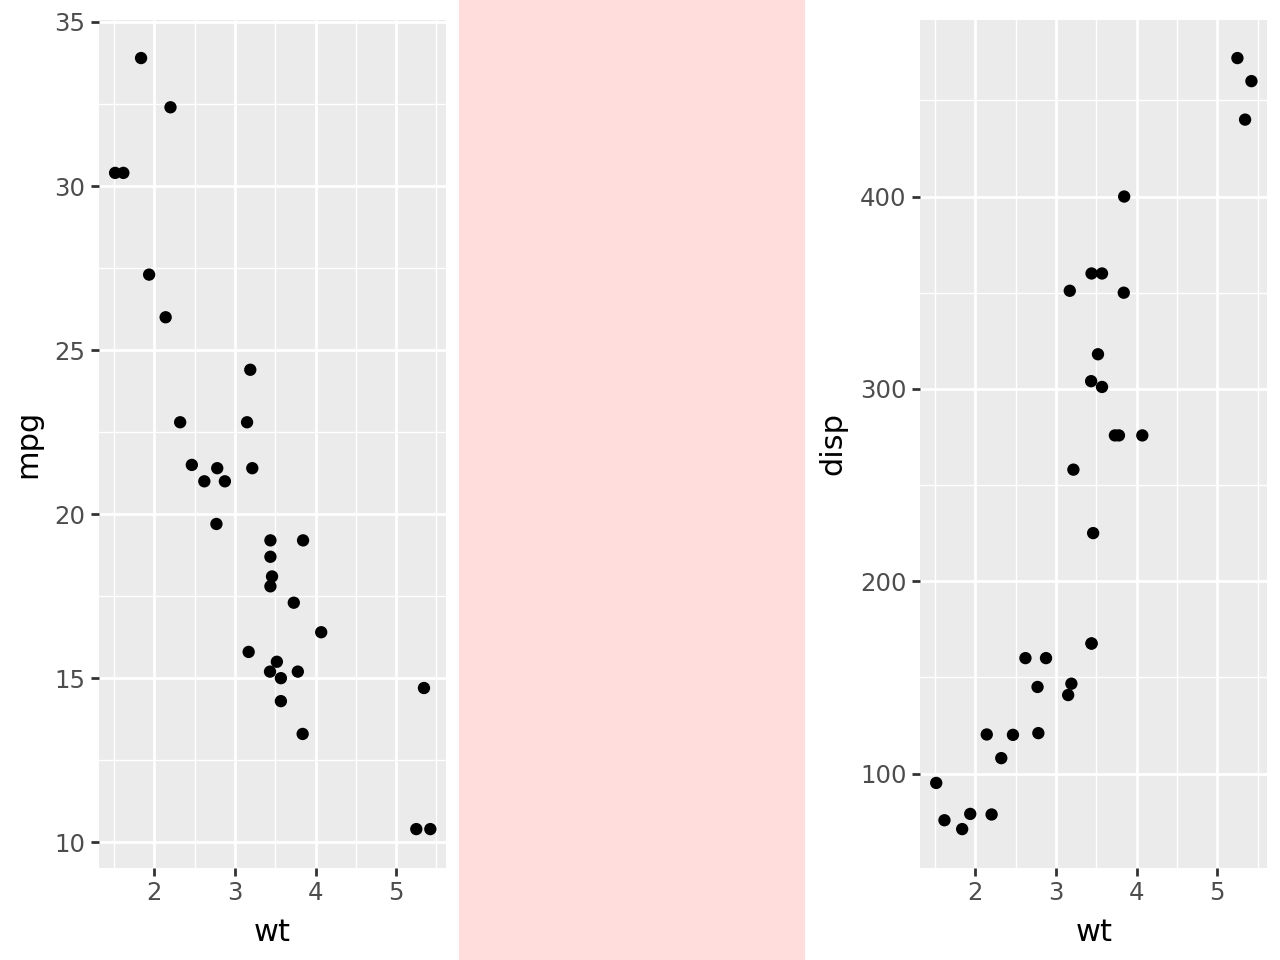
Which is the same as
p1 | (plot_spacer() + theme(plot_background=element_rect(fill="#FF000022"))) | p2
Source: plot_spacer.ipynb


