from plotnine import ggplot, aes, geom_step, geom_line, labs, theme, element_text
from plotnine.data import economics
Stepped connected points
geom_step(
    mapping=None,
    data=None,
    *,
    stat="identity",
    position="identity",
    na_rm=False,
    inherit_aes=True,
    show_legend=None,
    raster=False,
    direction="hv",
    **kwargs
)
Parameters
mapping : aes = None-
Aesthetic mappings created with aes. If specified and
inherit_aes=True, it is combined with the default mapping for the plot. You must supply mapping if there is no plot mapping.Aesthetic Default value x y alpha 1color 'black'group linetype 'solid'size 0.5The bold aesthetics are required.
data : DataFrame = None-
The data to be displayed in this layer. If
None, the data from from theggplot()call is used. If specified, it overrides the data from theggplot()call. stat : str | stat = "identity"-
The statistical transformation to use on the data for this layer. If it is a string, it must be the registered and known to Plotnine.
position : str | position = "identity"-
Position adjustment. If it is a string, it must be registered and known to Plotnine.
na_rm : bool = False-
If
False, removes missing values with a warning. IfTruesilently removes missing values. inherit_aes : bool = True-
If
False, overrides the default aesthetics. show_legend : bool | dict = None-
Whether this layer should be included in the legends.
Nonethe default, includes any aesthetics that are mapped. If abool,Falsenever includes andTruealways includes. Adictcan be used to exclude specific aesthetis of the layer from showing in the legend. e.gshow_legend={'color': False}, any other aesthetic are included by default. raster : bool = False-
If
True, draw onto this layer a raster (bitmap) object even ifthe final image is in vector format. direction : Literal["hv", "vh", "mid"] = "hv"-
horizontal-vertical steps, vertical-horizontal steps or steps half-way between adjacent x values.
**kwargs : Any-
Aesthetics or parameters used by the
stat.
See Also
geom_path-
For documentation of extra parameters.
Examples
Step plots
geom_step() connects points using ‘steps’ instead of a line.
# inspect the data
economics.head()| date | pce | pop | psavert | uempmed | unemploy | |
|---|---|---|---|---|---|---|
| 0 | 1967-07-01 | 507.4 | 198712 | 12.5 | 4.5 | 2944 |
| 1 | 1967-08-01 | 510.5 | 198911 | 12.5 | 4.7 | 2945 |
| 2 | 1967-09-01 | 516.3 | 199113 | 11.7 | 4.6 | 2958 |
| 3 | 1967-10-01 | 512.9 | 199311 | 12.5 | 4.9 | 3143 |
| 4 | 1967-11-01 | 518.1 | 199498 | 12.5 | 4.7 | 3066 |
Plot a step plot using geom_plot(). Notice from the first point the line travels vertically then horizontally:
(
    ggplot(
        economics.iloc[:20],  # filter for first twenty rows (dates) to make steps more visible
        aes("date", "unemploy"),
    )
    + geom_step()  # step plot
    + labs(x="date", y="unemployment (,000)")  # label x & y-axis
    + theme(axis_text_x=element_text(angle=45))  # rotate x-axis text for readability
)
You can see how geom_path() (shown in pink) differs from geom_line() (black):
(
    ggplot(economics.iloc[:20], aes("date", "unemploy"))
    + geom_step(
        colour="#ff69b4",  # plot geom_step as the first layer - colour pink
        alpha=0.5,  # line transparency
        size=2.5,
    )  # line thickness
    + geom_line()  # plot geom_line as the second layer
    + labs(x="date", y="unemployment (,000)")
    + theme(axis_text_x=element_text(angle=45))
)
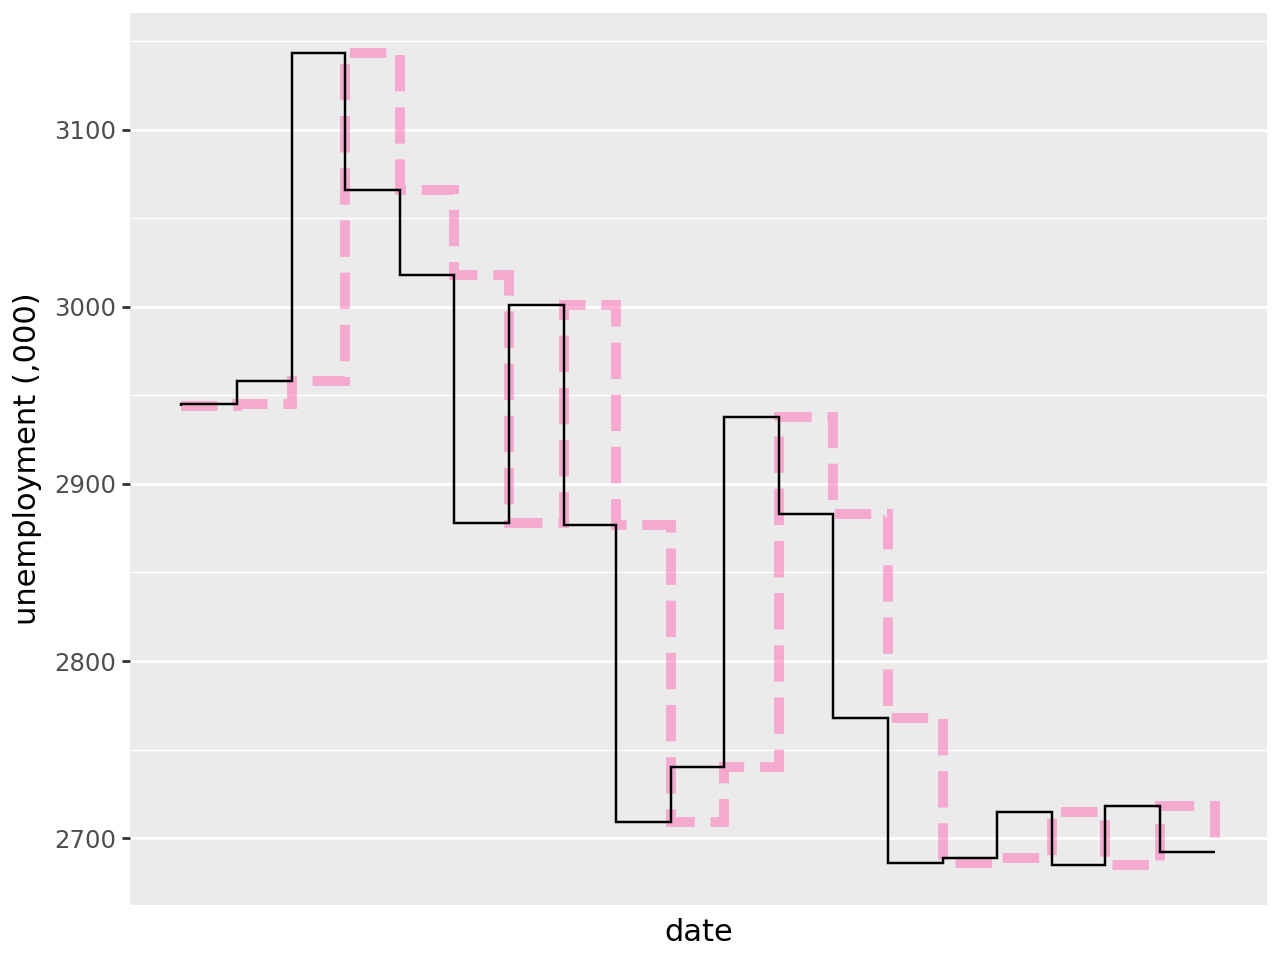
Rather than a line that travels vertically then horizontally, this order can be switched by specifying direction='vh' within geom_step(). Below direction='vh' is shown in black with the default direction='hv' shown in pink:
(
    ggplot(economics.iloc[:20], aes("date", "unemploy"))
    + geom_step(
        colour="#ff69b4",  # plot geom_path with default direction as the first layer - colour pink
        linetype="dashed",  # line type
        size=2,  # line thickness
        alpha=0.5,
    )  # line transparency
    + geom_step(direction="vh")  # plot geom_path with step order reversed
    + labs(x="date", y="unemployment (,000)")
    + theme(axis_text_x=element_text(angle=45))
)