from plotnine import *
from plotnine.data import penguinsAesthetic mappings
The aes() function maps columns of data onto graphical attributes–such as colors, shapes, or x and y coordinates. (aes() is short for aesthetic). It can be specified at the plot level, as well as at the individual geom level.
This page will cover the basics of specifying mappings and how they interact with geoms.
TipYou will learn
- How to map data to aesthetic attributes with
aes(). - How to set a literal mapping, like coloring all points red.
- How the
aes(group=...)argument works.
NoteKey points
aes()maps variables (columns) to chart dimensions (e.g. x, y, or color).- Variable mappings in
aes()can be simple names or expressions (e.g."somecol / 10"). - Literal mappings can be passed directly to geoms (e.g. hard-code color to “red”).
aes()can be used in the initialggplot()call, or inside specificgeoms().- Mapping
aes(group=...)can be used to make multiple trend lines per group.
Setup
Basics
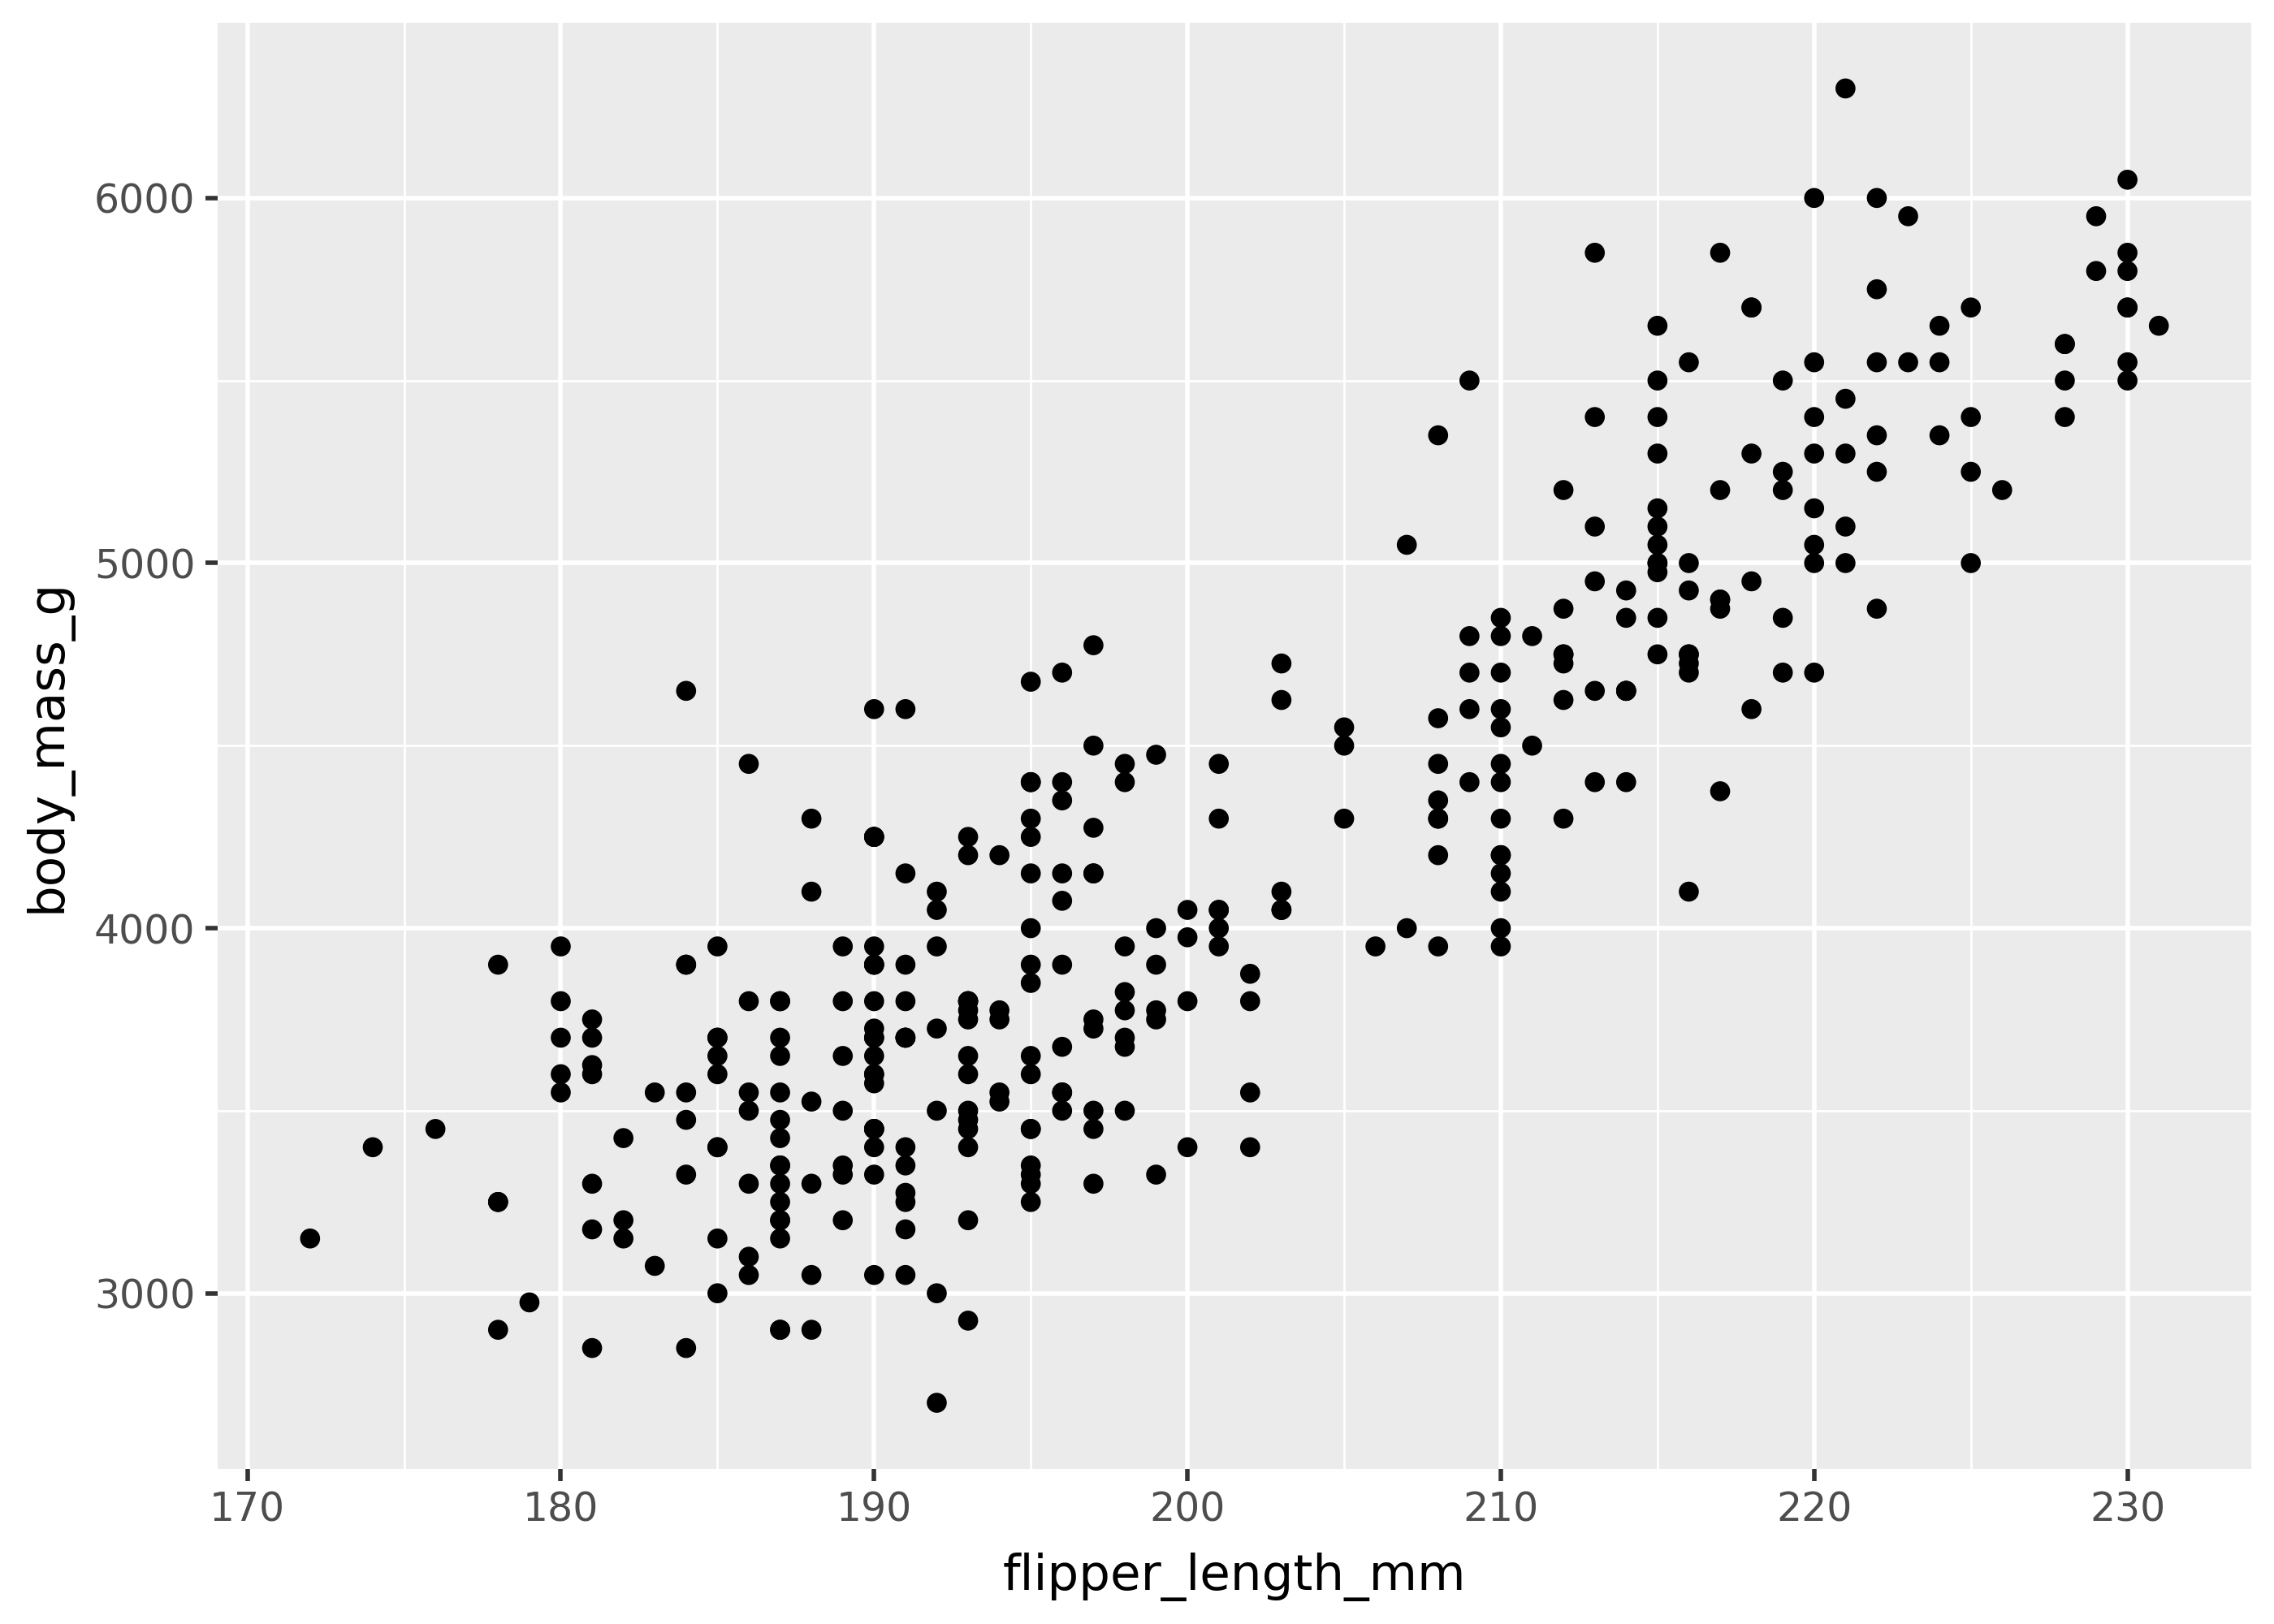
The simplest way to specify aesthetic mappings is through passing aes() to the ggplot(mapping = ...) argument. This is shown below, with flipper_length_mm and body_mass_g mapped to the x- and y- axes.
(
    ggplot(
      data=penguins,
      mapping=aes(x="flipper_length_mm", y="body_mass_g")
    )
    + geom_point()
)
Variable mappings
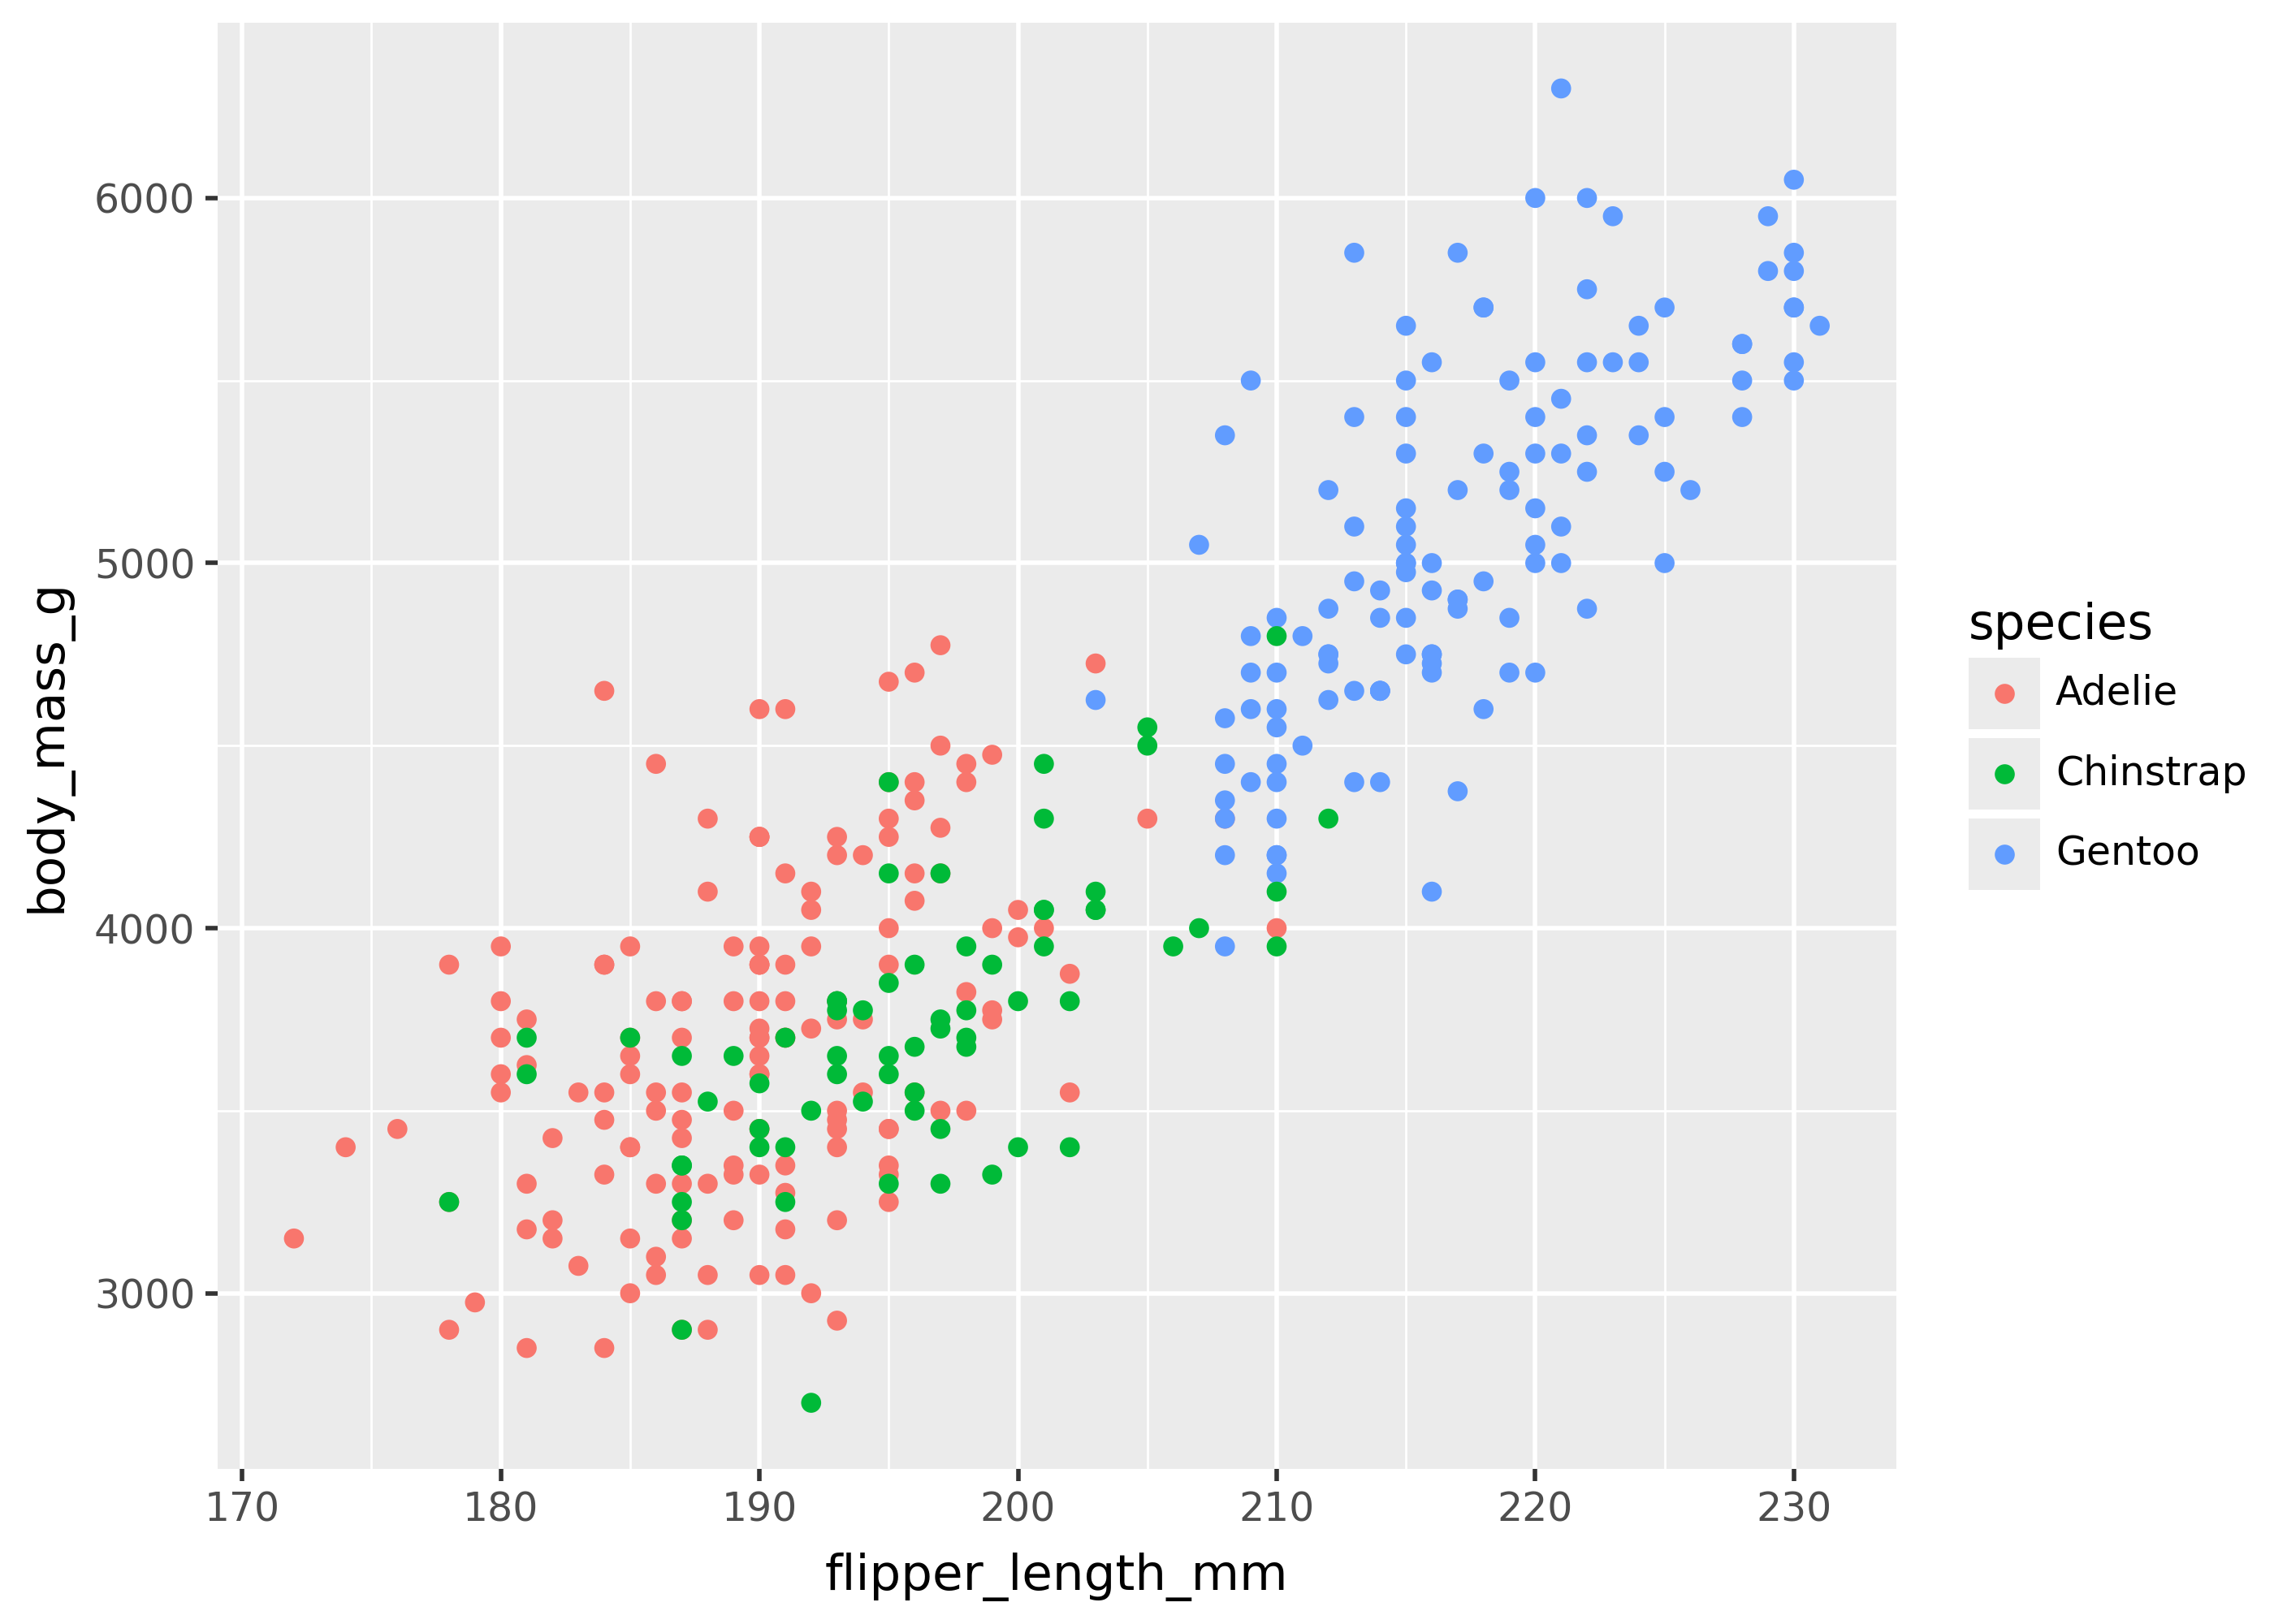
When a mapping in aes() references a column of data, it is called a variable mapping—since the values of the column are used to determine the appearance of the plot. Below are some plots with variable mappings to different columns of data (e.g flipper_length_mm, body_mass_g, species).
(
    ggplot(
        penguins,
        aes(x="flipper_length_mm", y="body_mass_g", color="species")
    )
    + geom_point()
)
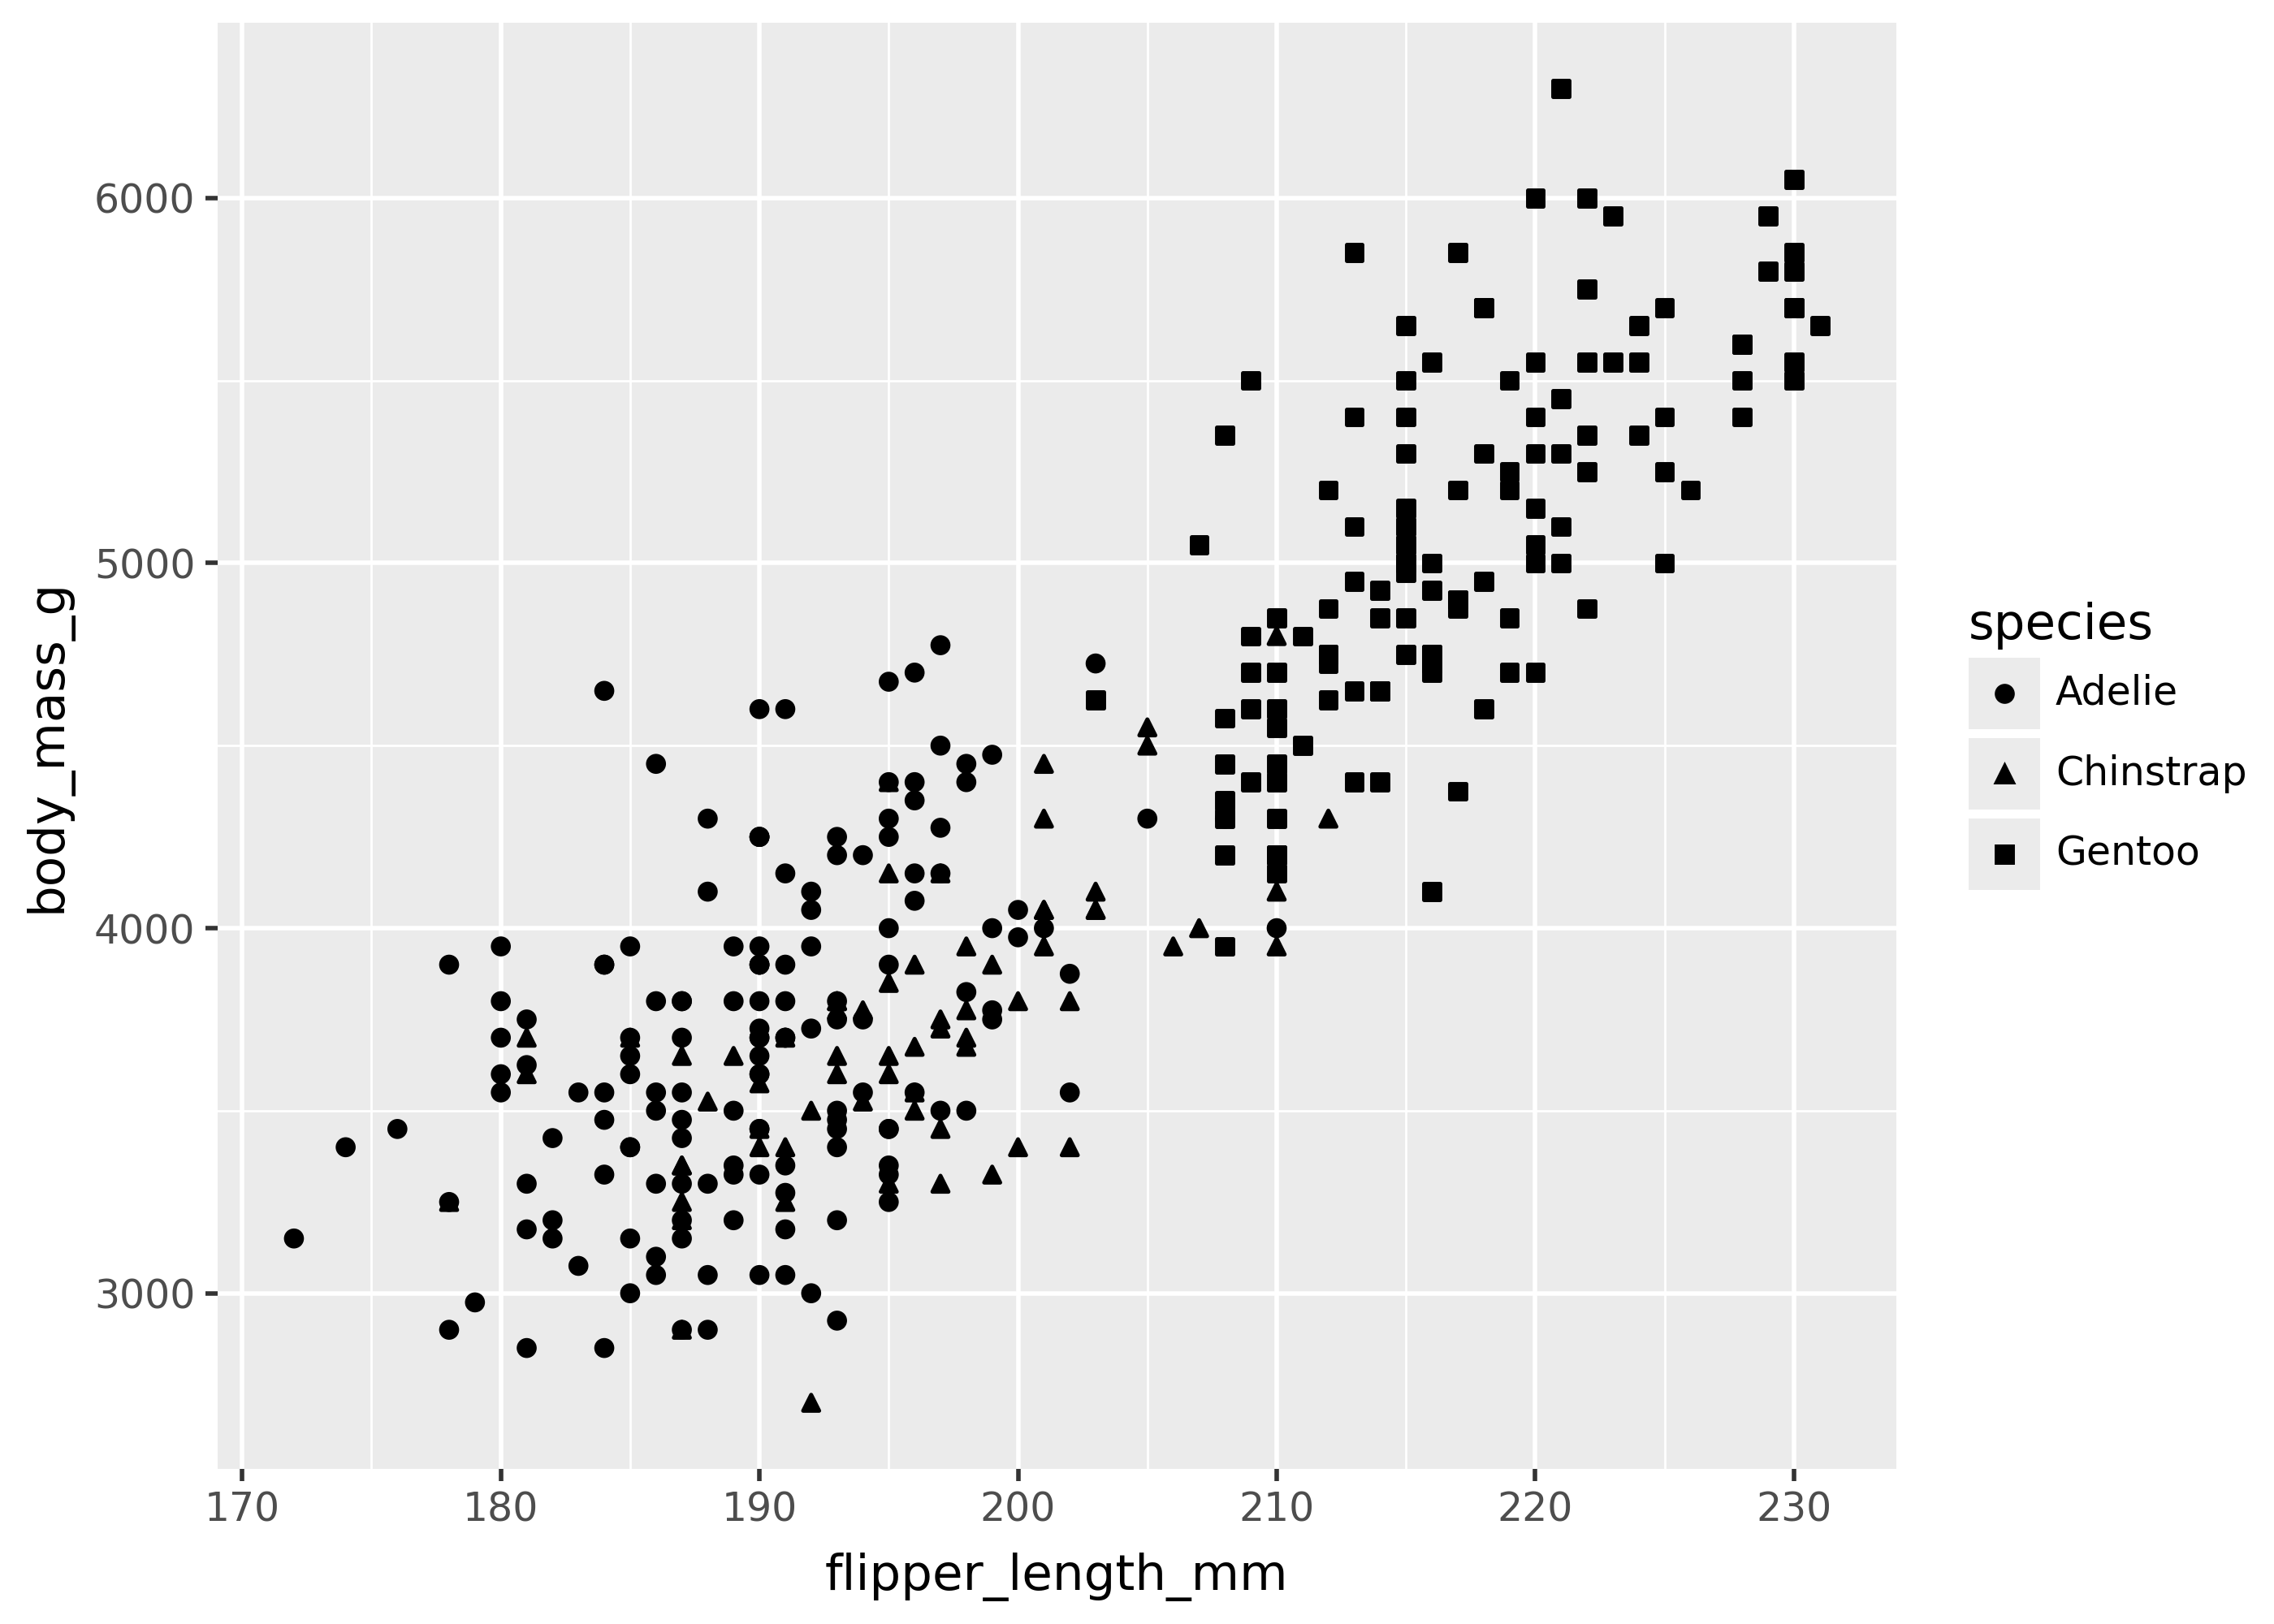
(
    ggplot(
        penguins,
        aes(x="flipper_length_mm", y="body_mass_g", shape="species"),
    )
    + geom_point()
)
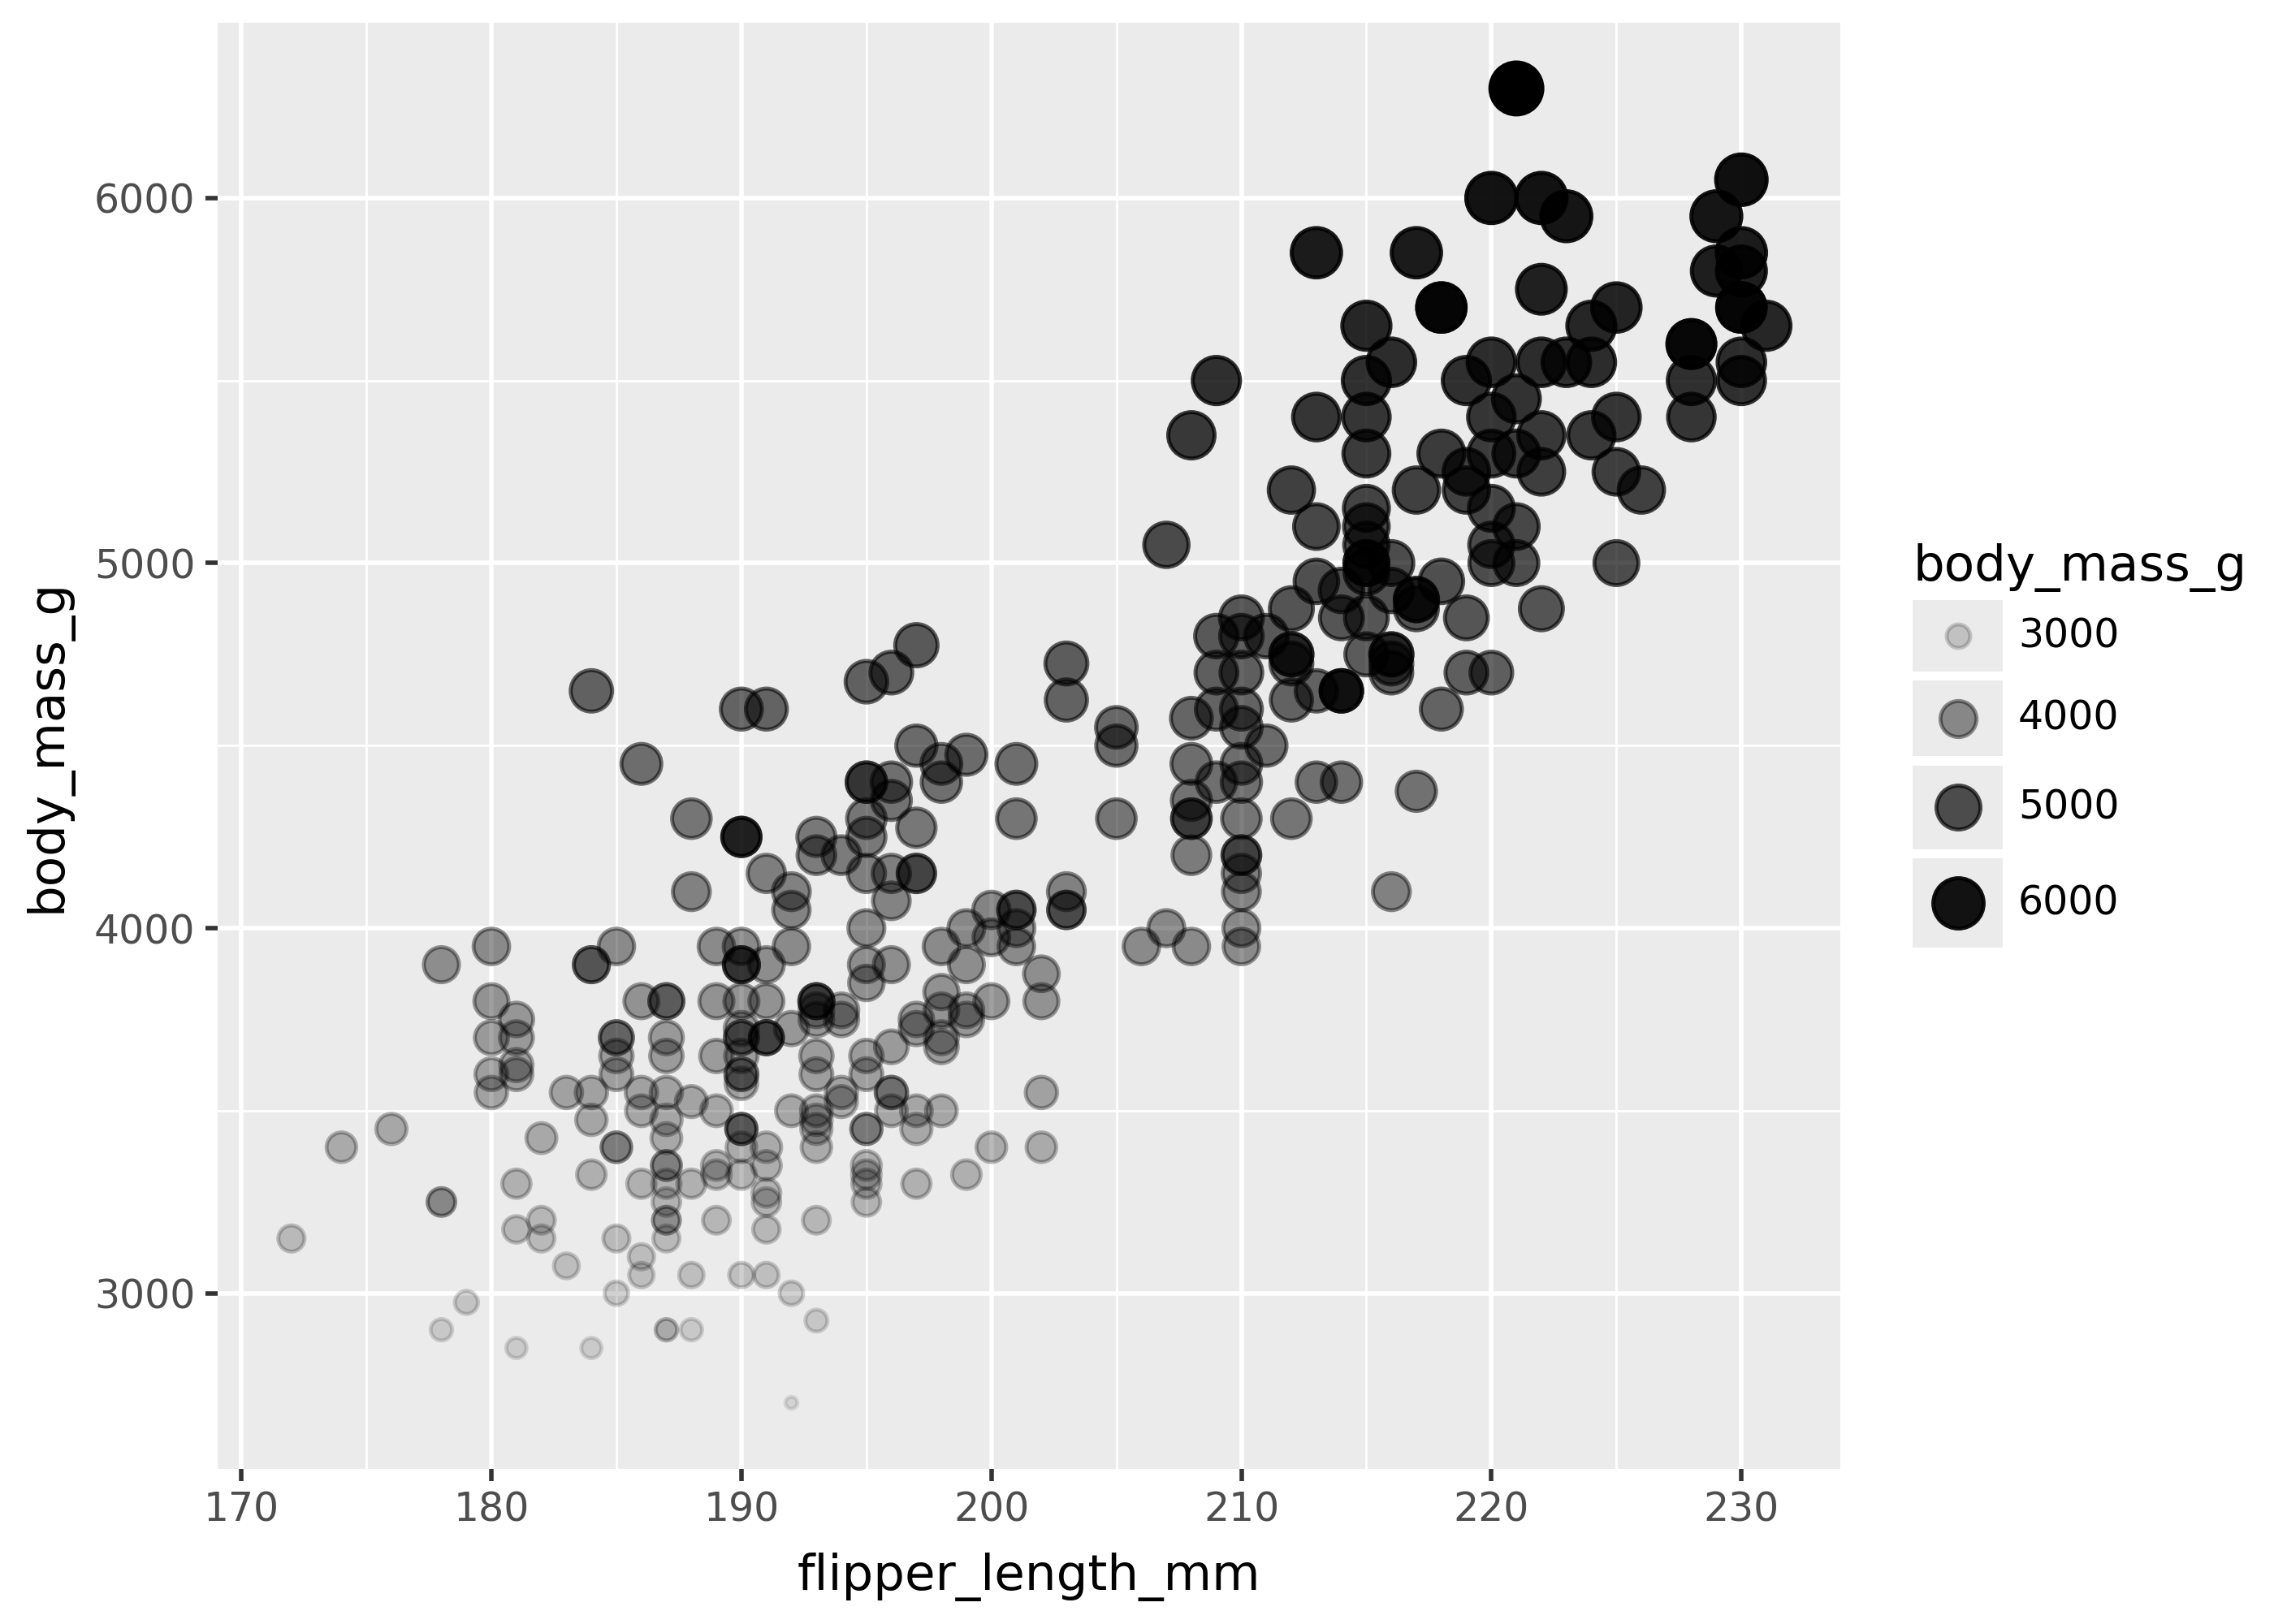
(
    ggplot(
        penguins,
        aes(
            x="flipper_length_mm",
            y="body_mass_g",
            size="body_mass_g",
            alpha="body_mass_g",
        ),
    )
    + geom_point()
)
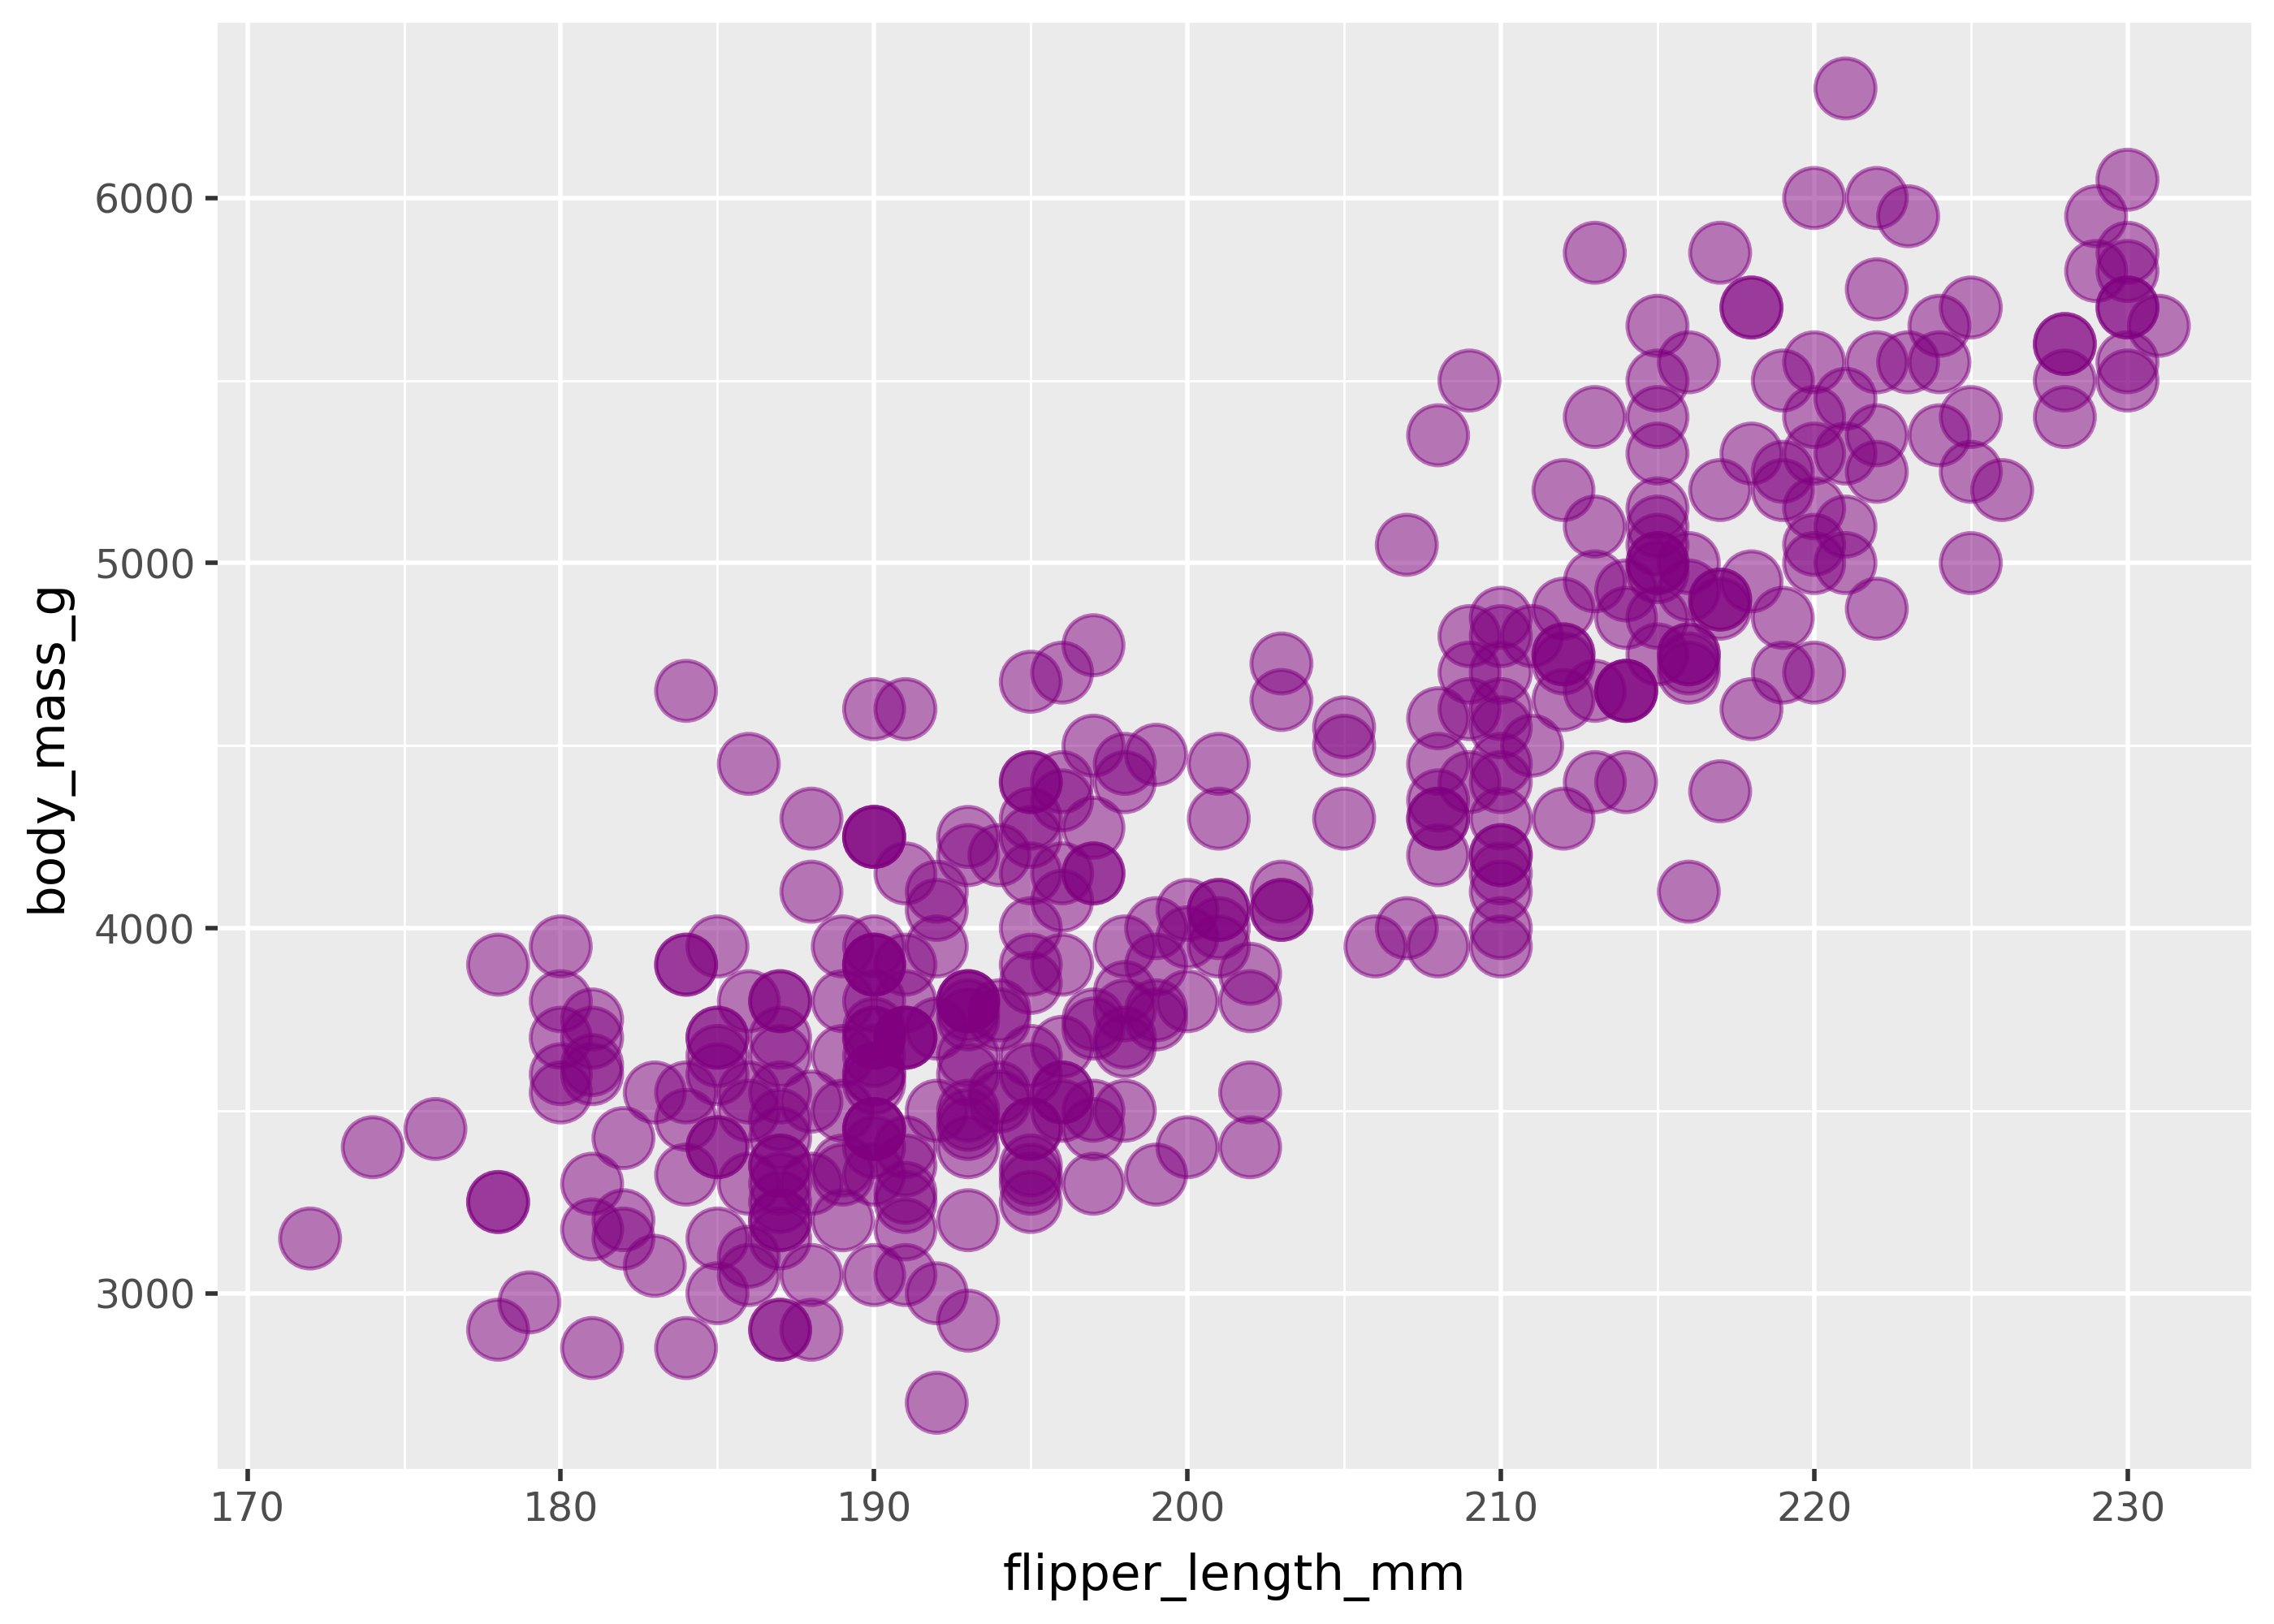
Literal mappings
In order to set a mapping to a literal value, pass the value directly to the geom. For example, the code below sets size=, alpha=, and color= to specific values.
(
    ggplot(
        penguins,
        aes(x="flipper_length_mm", y="body_mass_g"),
    )
    + geom_point(size=7, alpha=.5, color="purple")
)
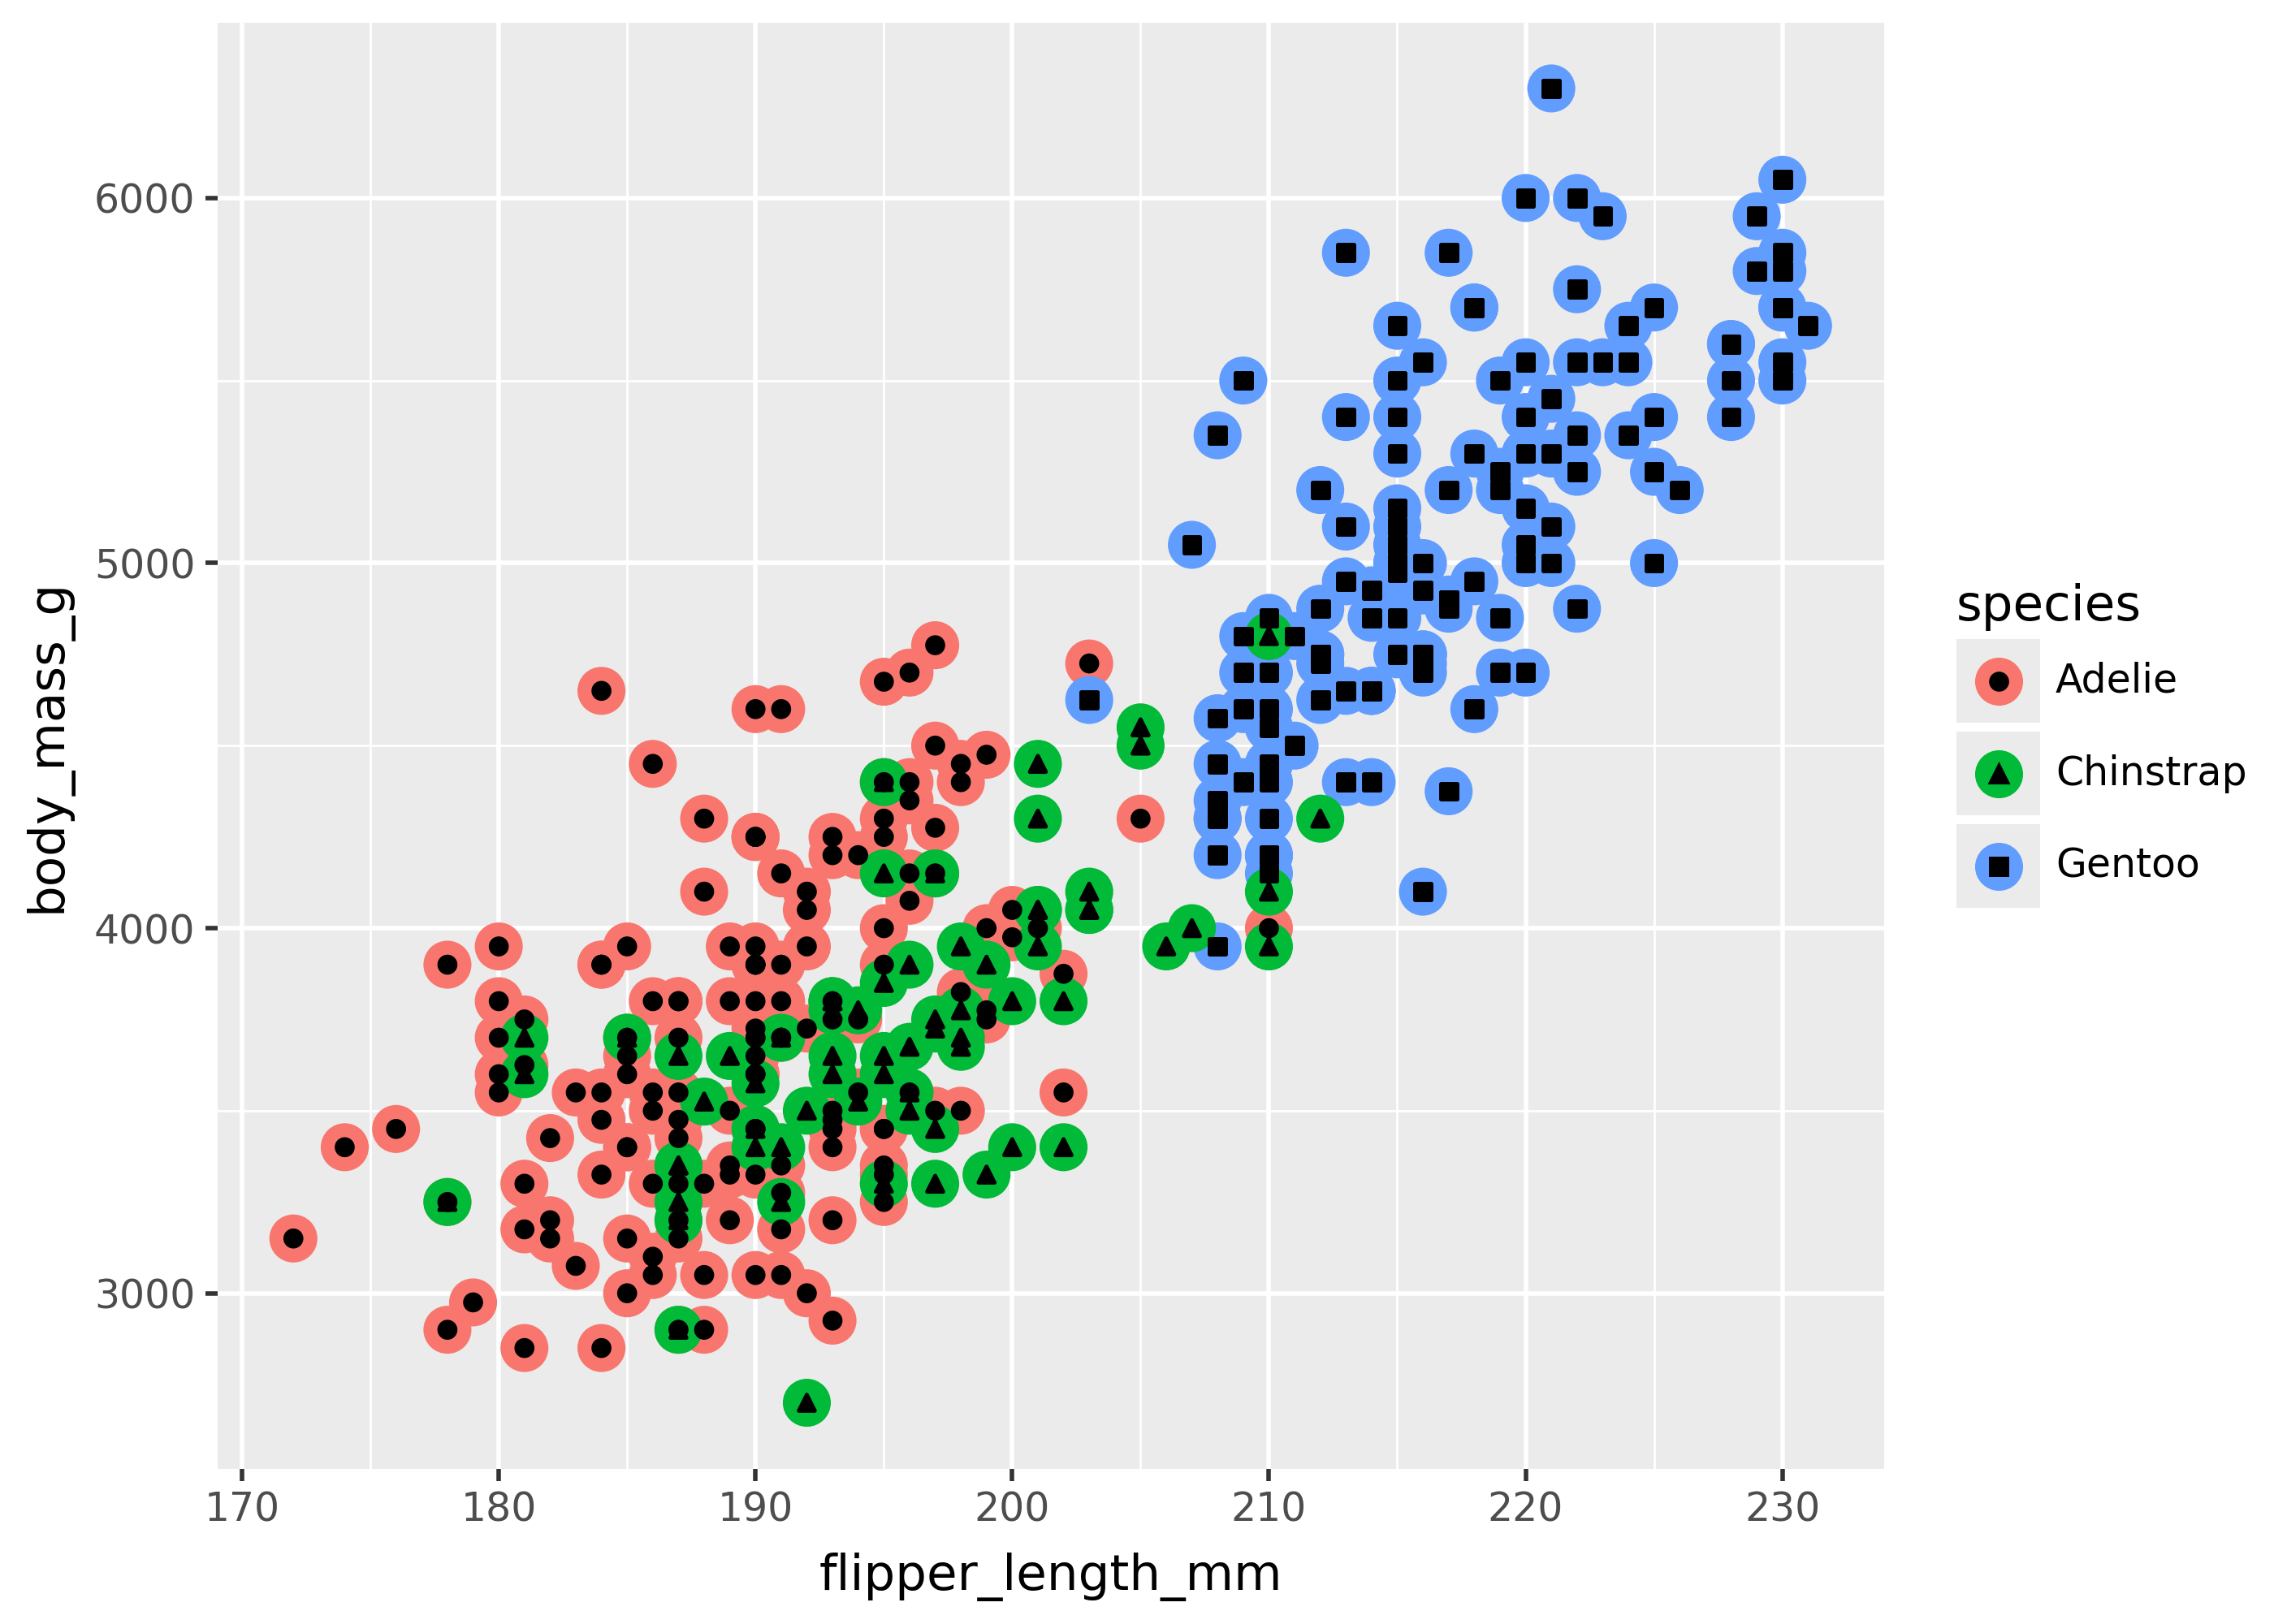
aes() inside a specific geom
An aes() mapping can be applied to a single geom, by passing it directly to the geom call. For example, the code below sets color for one point, and shape for another.
(
    ggplot(
        penguins,
        aes(x="flipper_length_mm", y="body_mass_g"),
    )
    + geom_point(aes(color="species"), size=5)   # big circle points
    + geom_point(aes(shape="species"))           # shape points
)
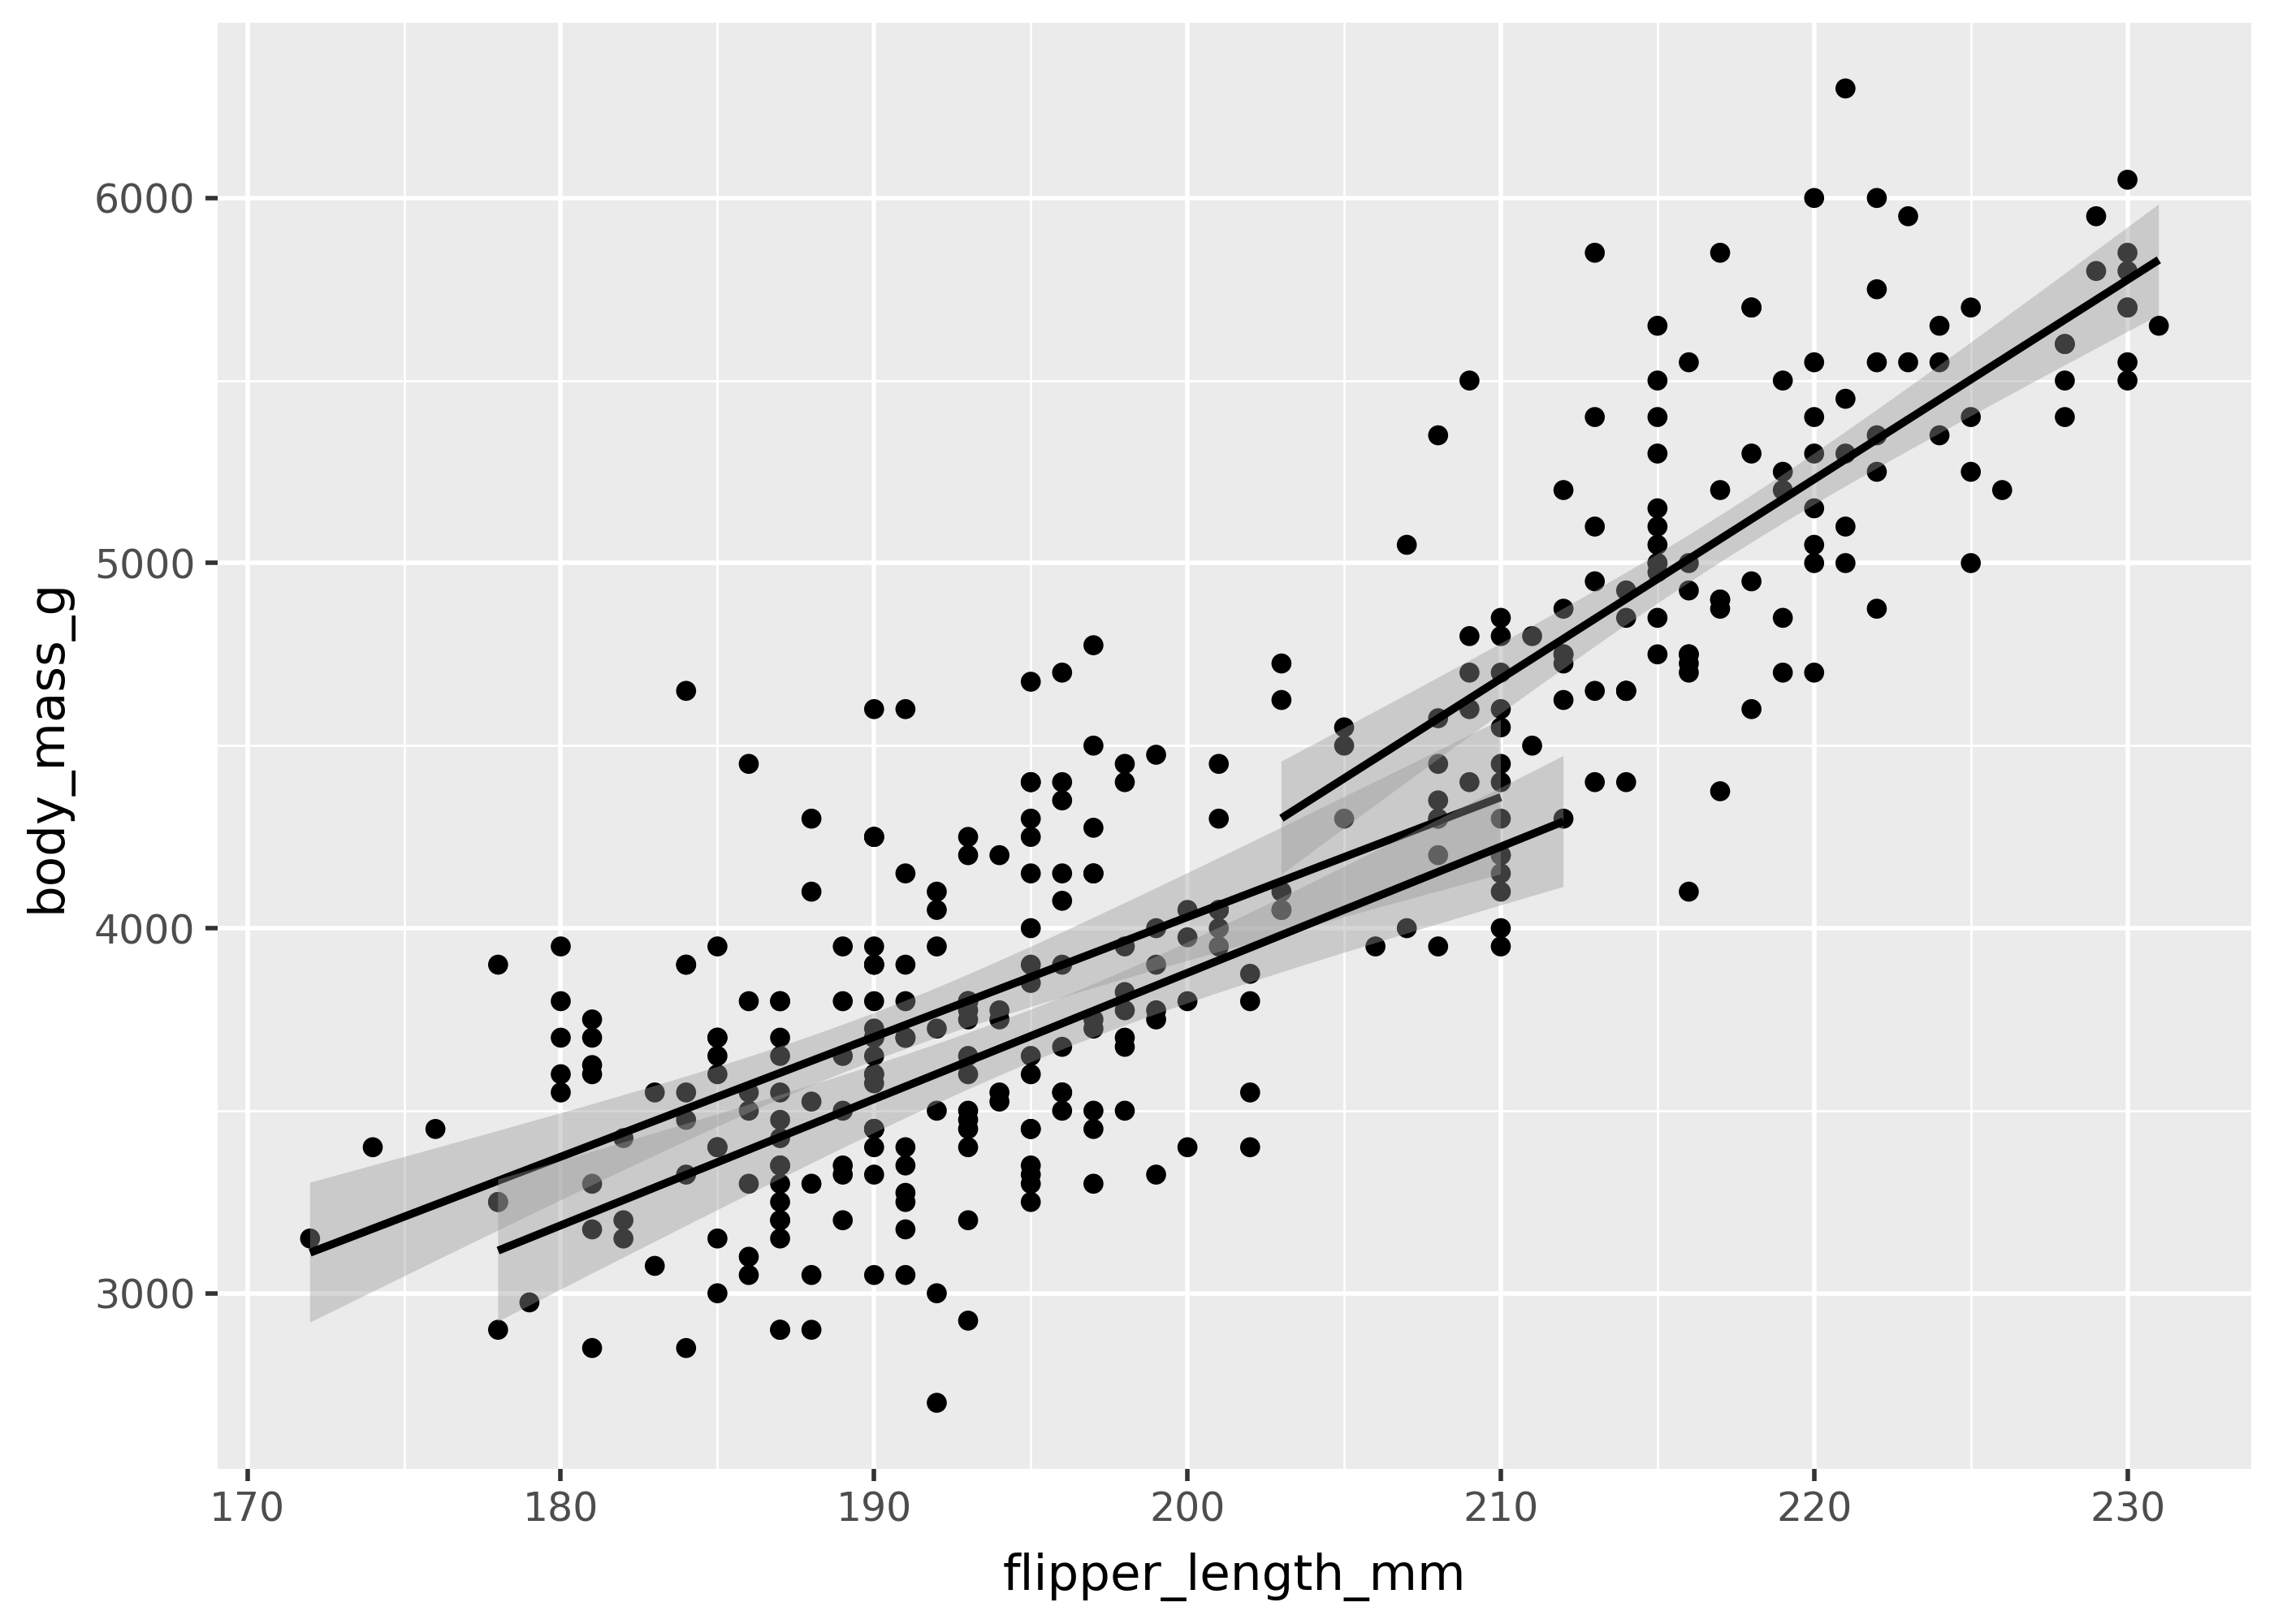
aes() collective groupings
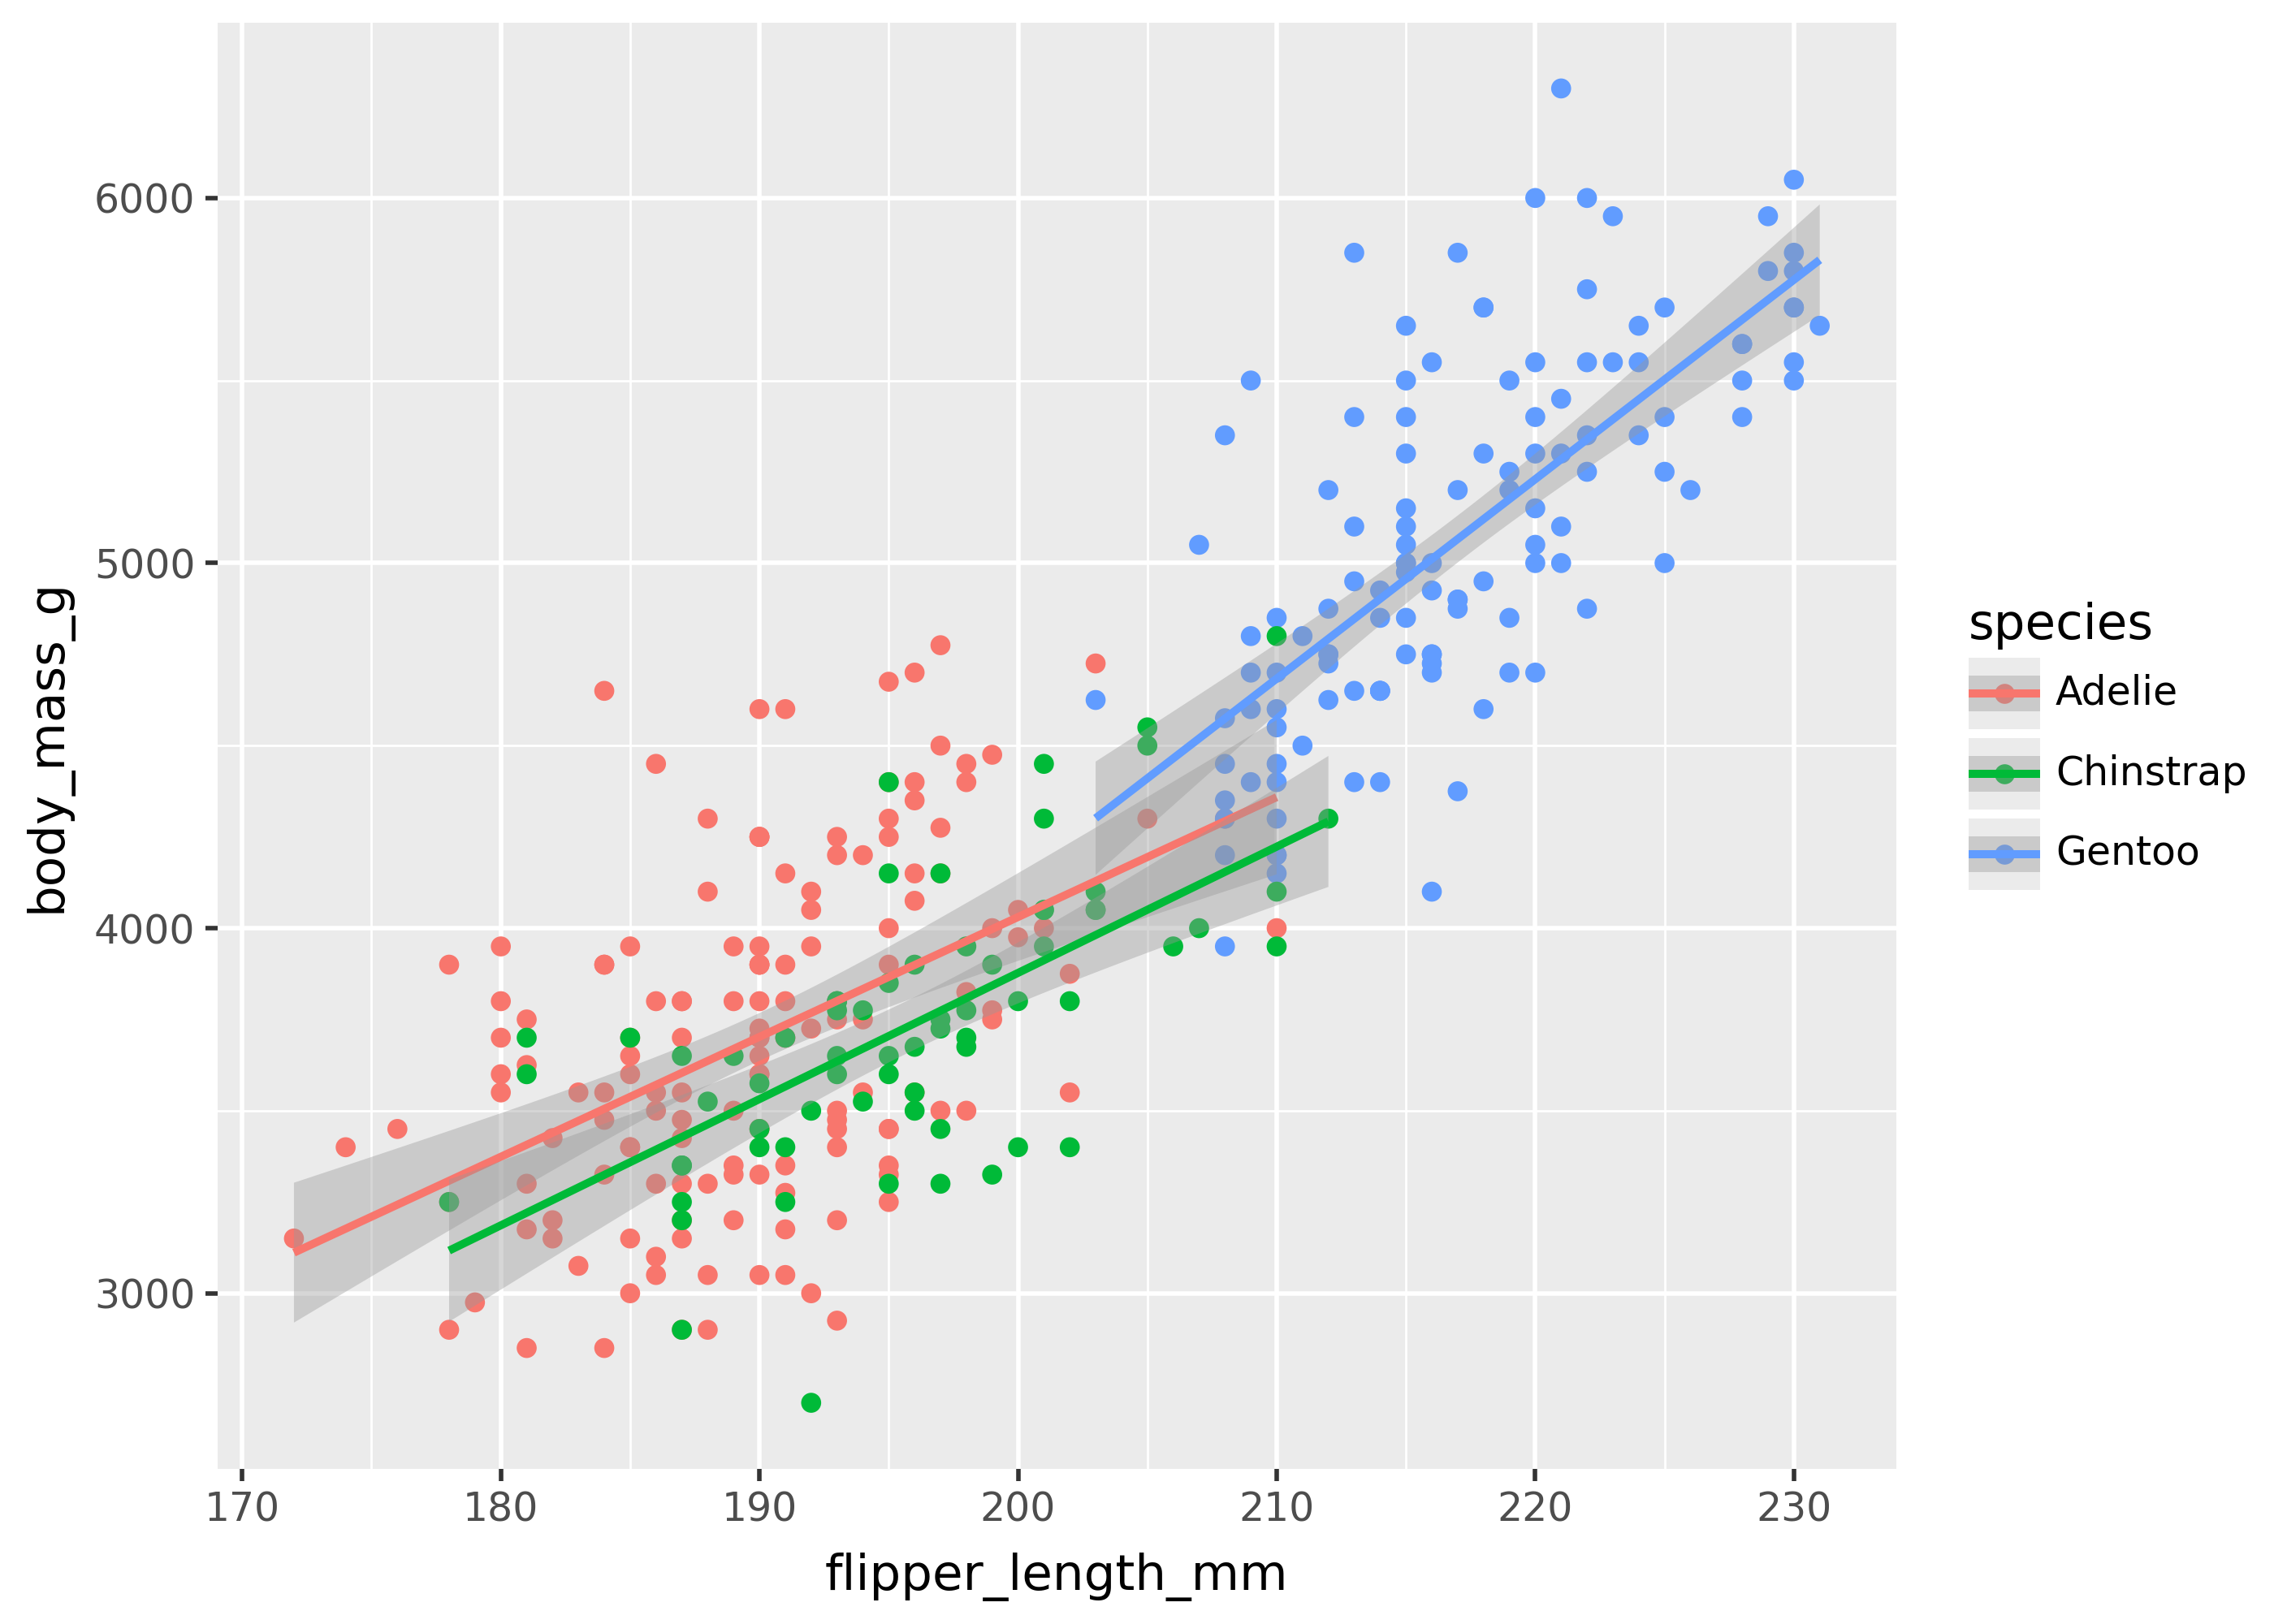
Some geoms accept a aes(group=...). These are called collective geoms, because they group data points together. For example, geom_smooth() fits a trend line to the data, and the group mapping tells it to create a separate line per grouping in the data.
This is shown below, with a trend line created for each of the three species of penguins.
(
    ggplot(
        penguins,
        aes(x="flipper_length_mm", y="body_mass_g", group="species"),
    )
    + geom_point()
    + geom_smooth(method="lm")
)
Automatic groupings
Mappings attributes like color will automatically group data points for collective geoms, even if group isn’t specified.
(
    ggplot(
        penguins,
        aes(x="flipper_length_mm", y="body_mass_g", color="species"),
    )
    + geom_point()
    + geom_smooth(method="lm")
)
Working around grouping
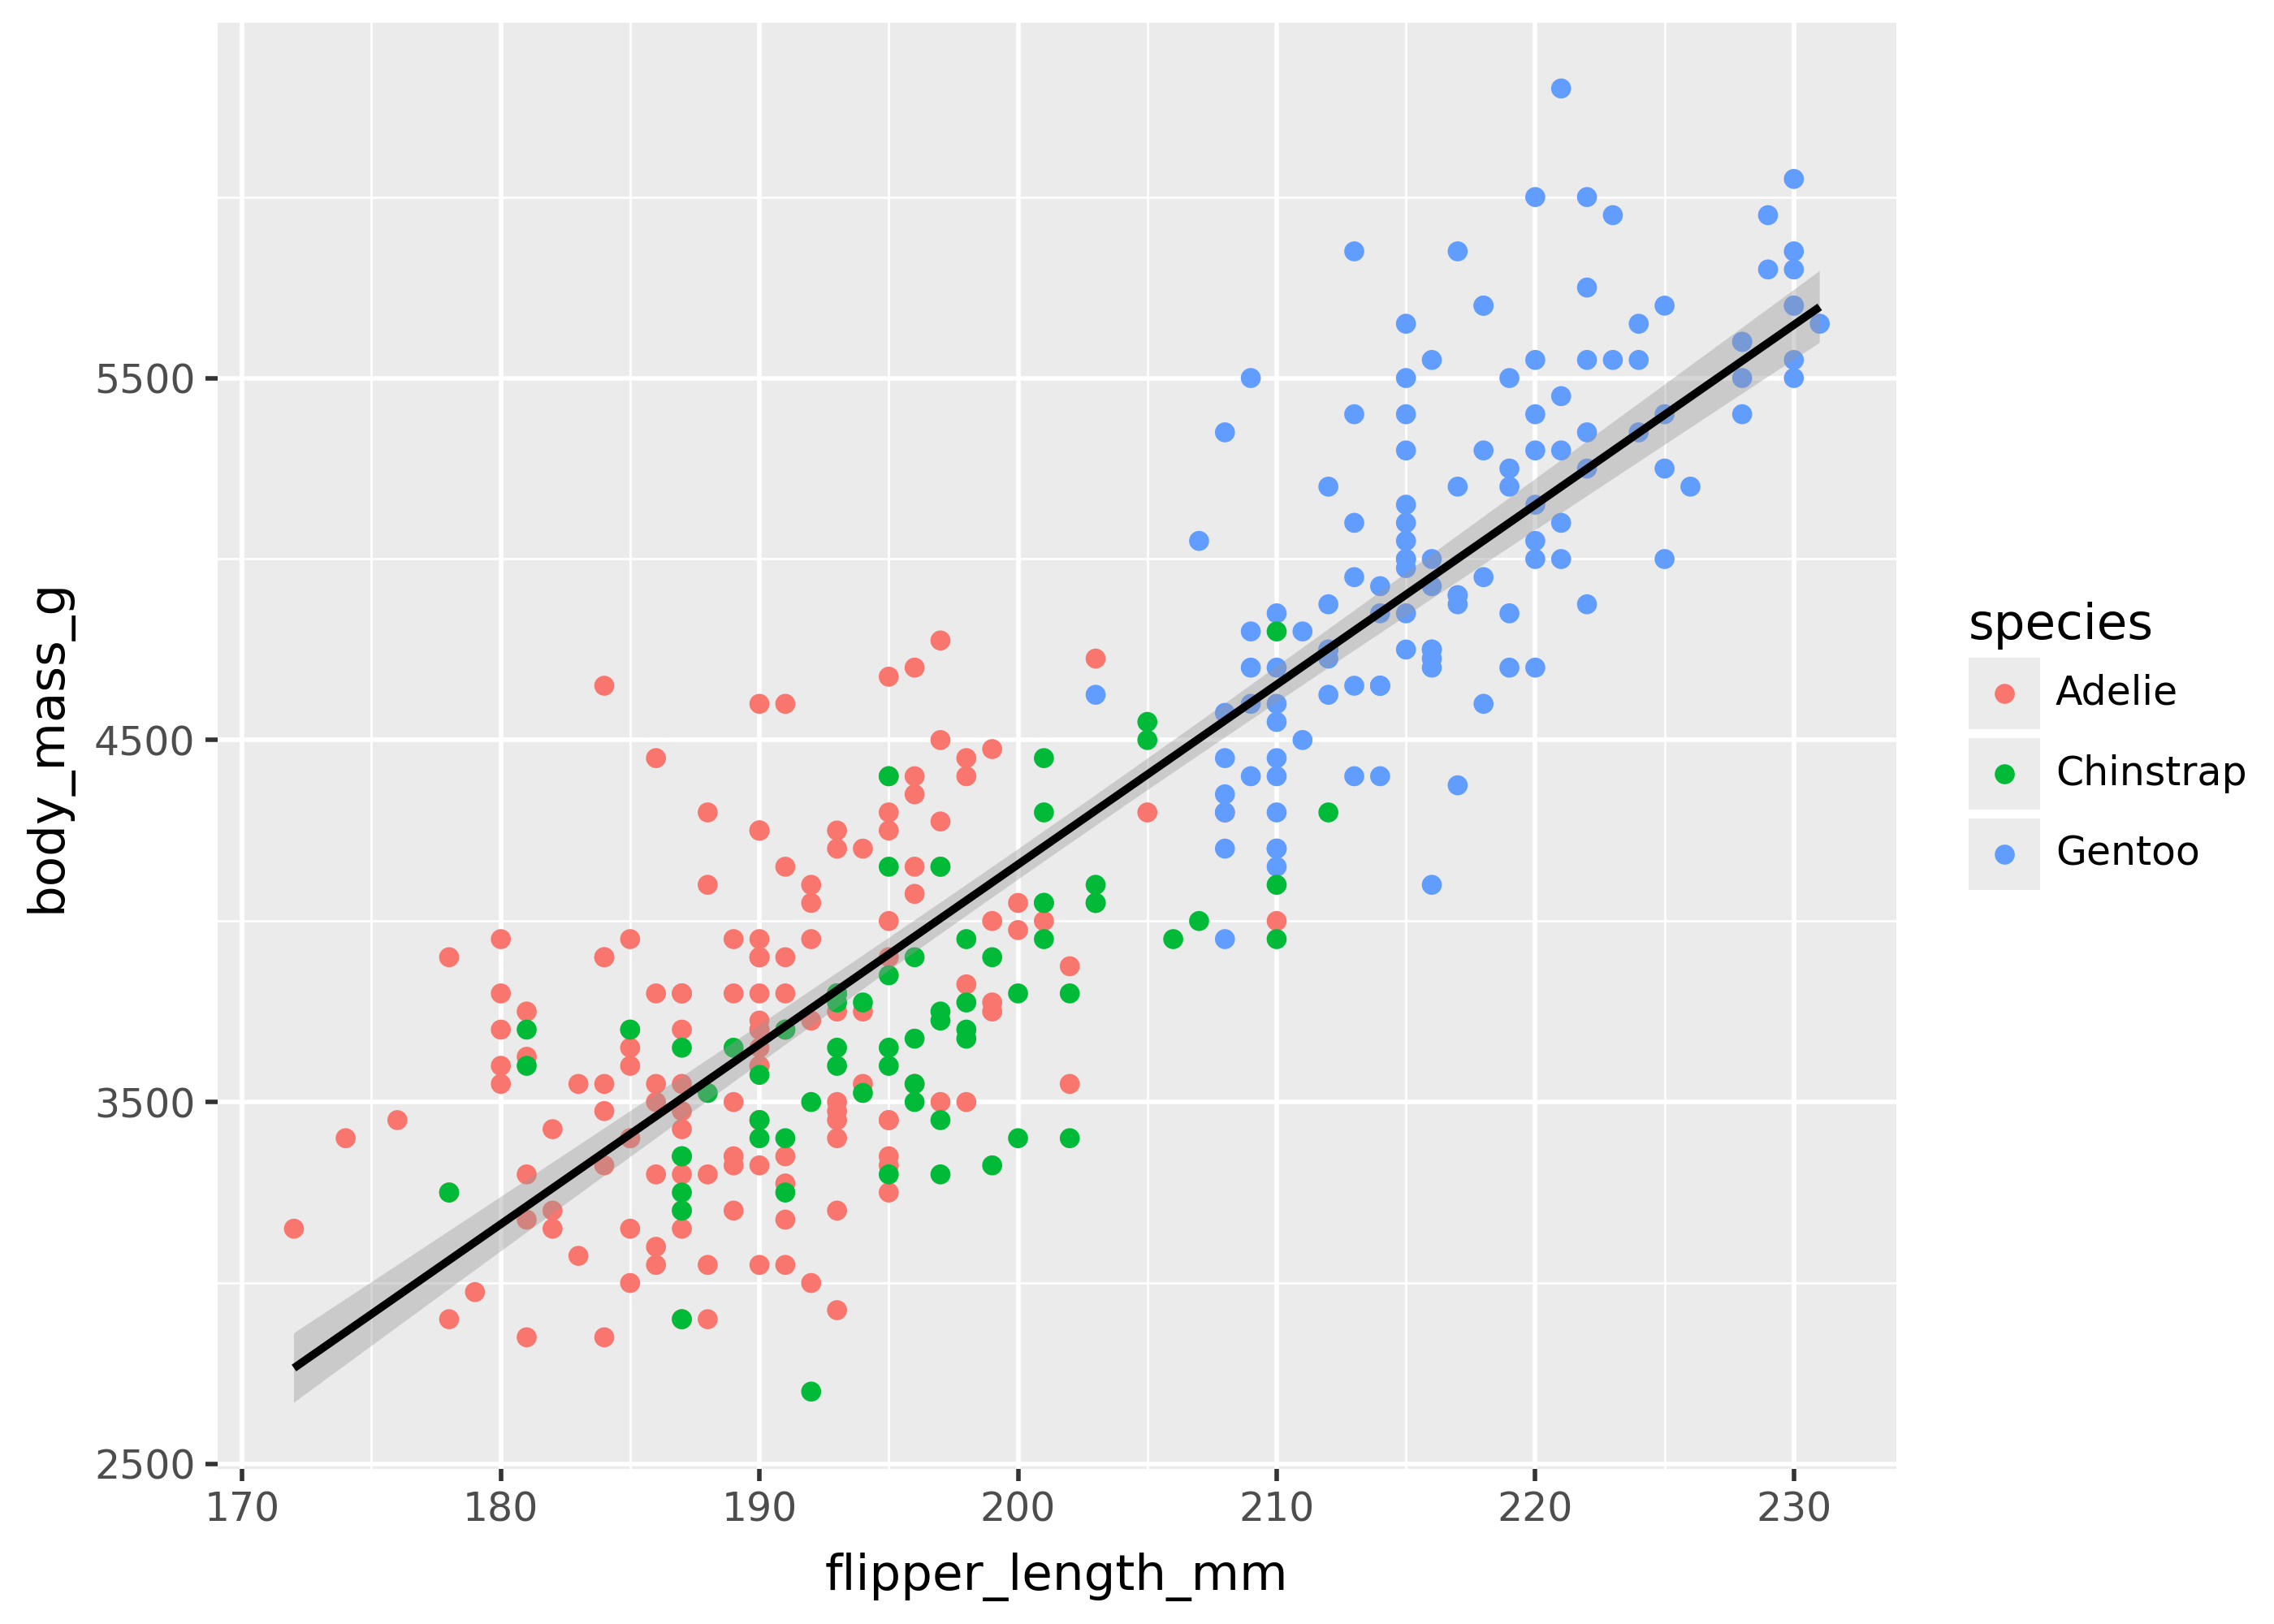
To avoid automatically splitting data into groups, try setting aesthetics like color or fill at the individual geom level.
For example, the plot below colors points by species, but with only a single trend line.
(
    ggplot(
        penguins,
        aes(x="flipper_length_mm", y="body_mass_g"),
    )
    + geom_point(aes(color="species"))
    + geom_smooth(method="lm")
)
Mappings allow expressions
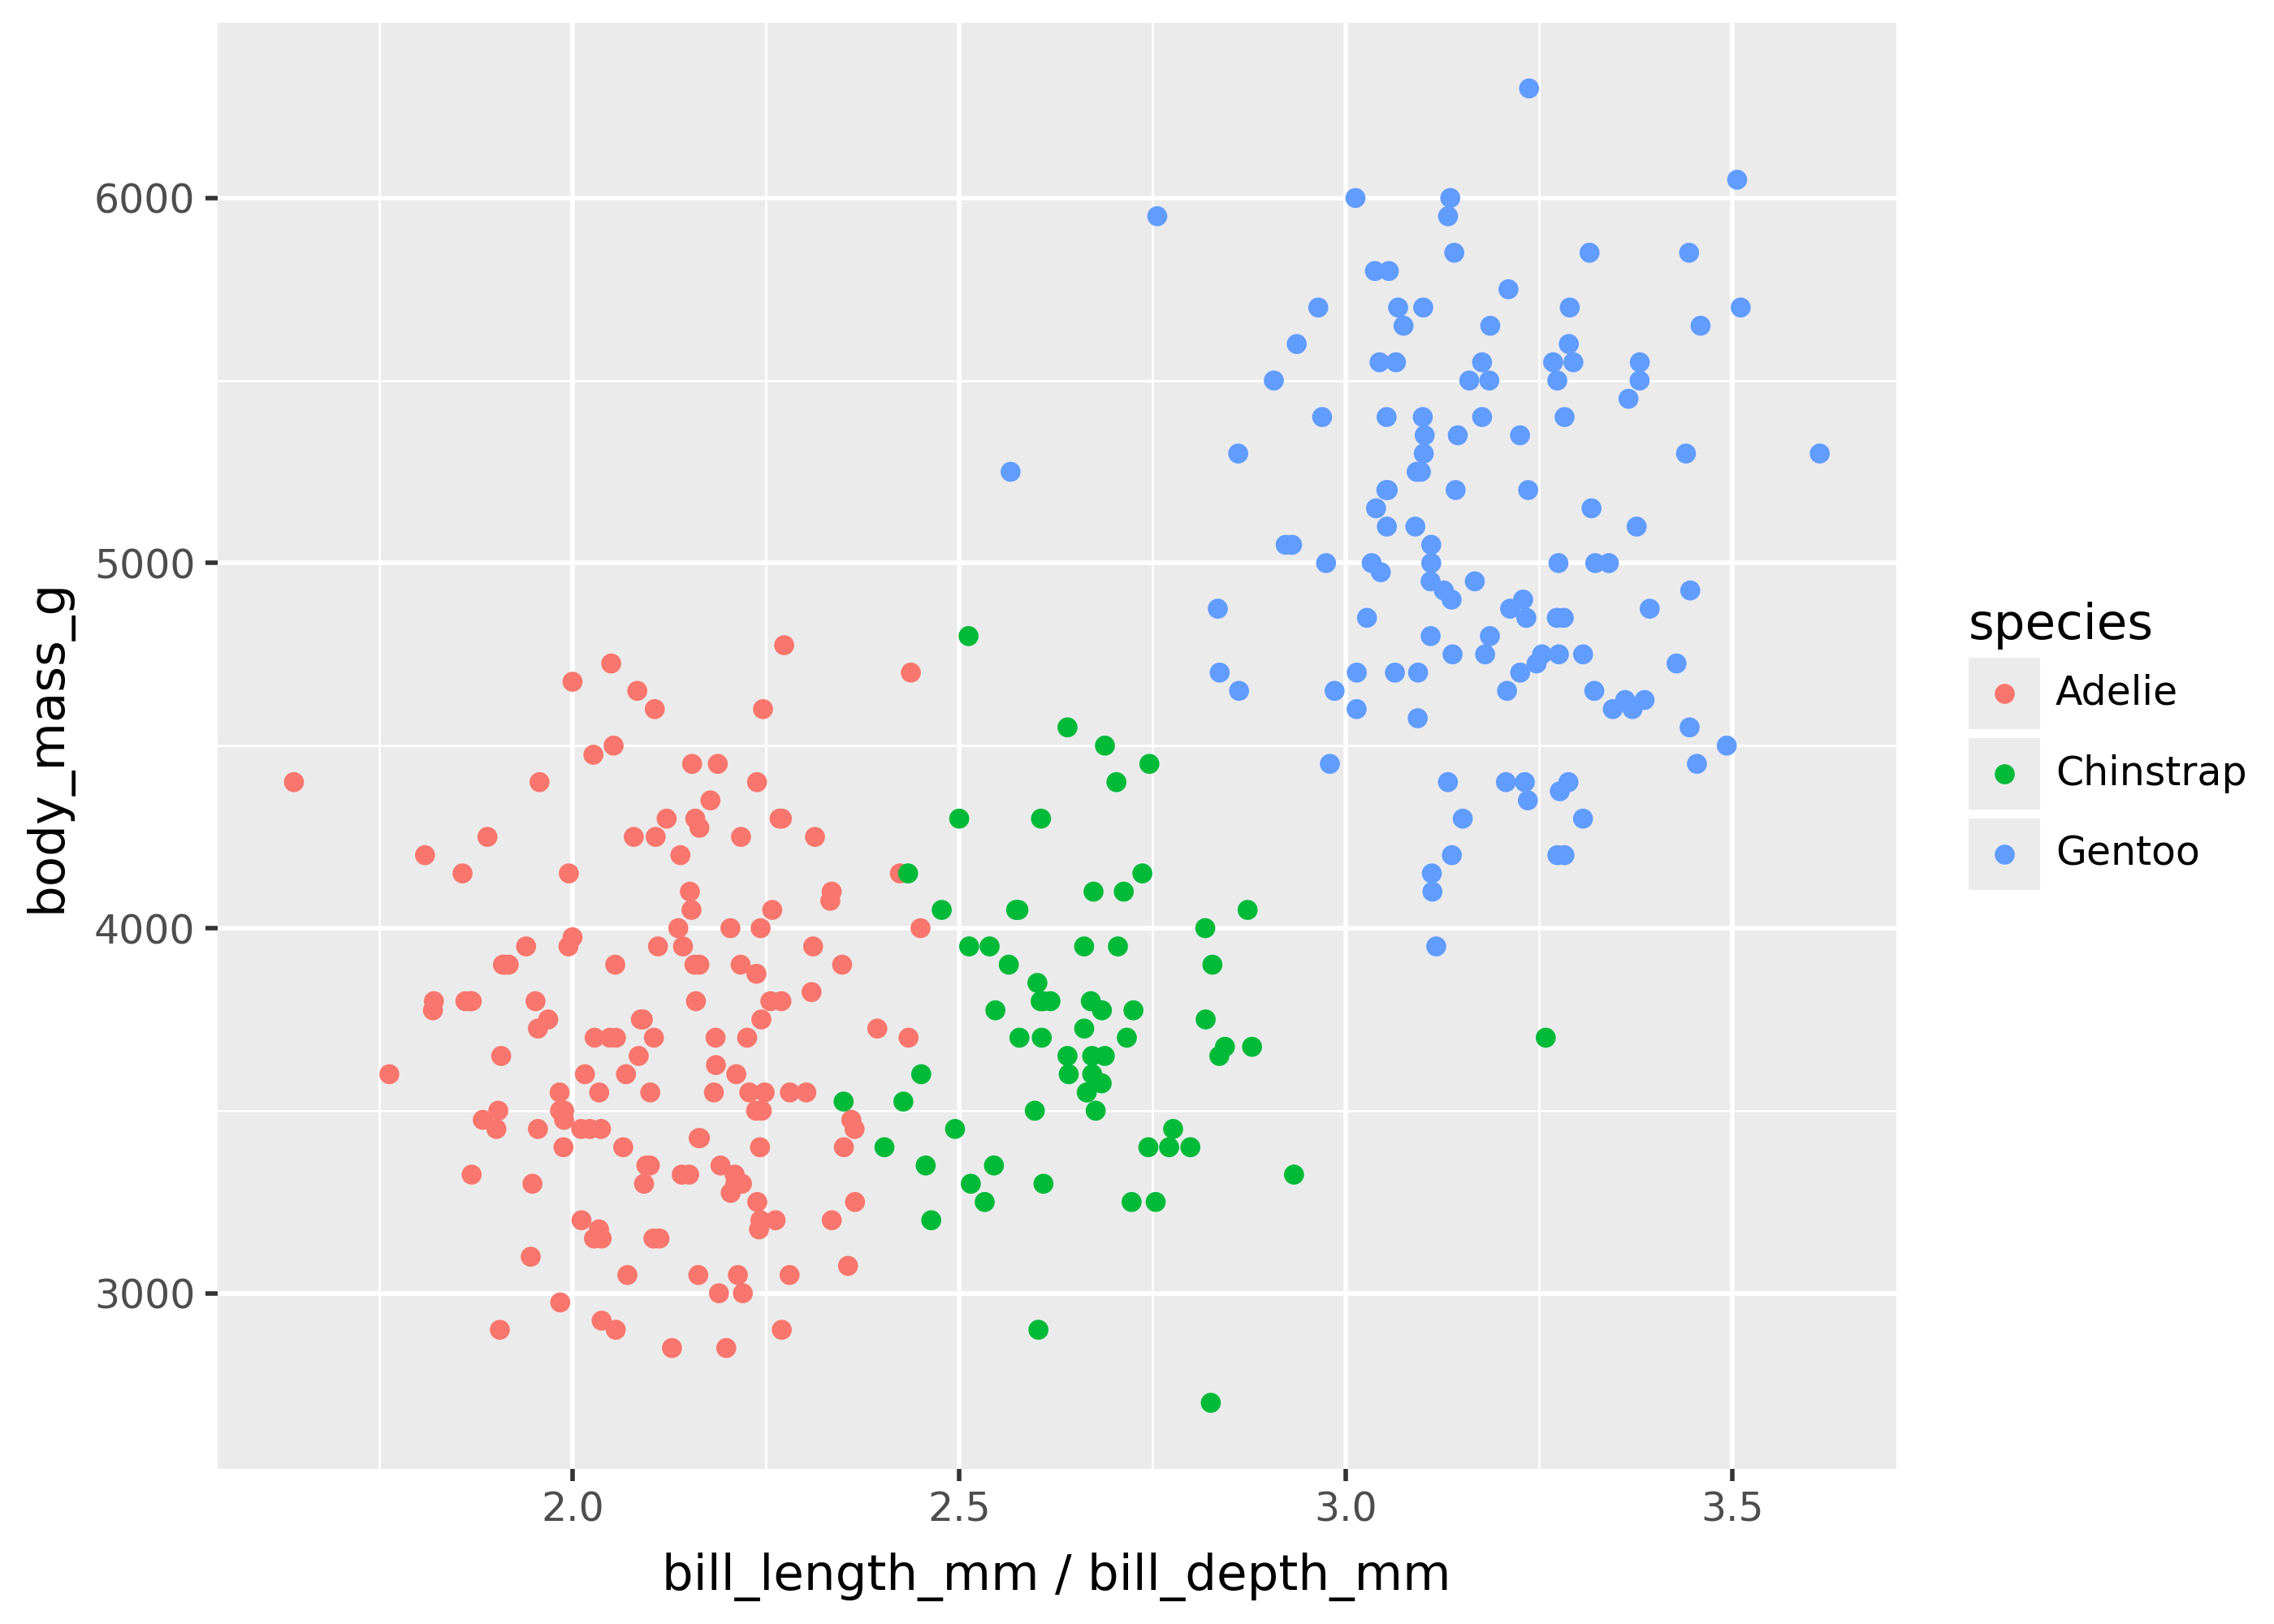
Mappings passed to aes() can be expression strings.
For example, you could make a scatterplot with bill_length_mm / bill_depth_mm on the x-axis as follows.
(
    ggplot(
        penguins,
        aes(x="bill_length_mm / bill_depth_mm", y="body_mass_g"),
    )
    + geom_point(aes(color="species"))
)