from plotnine import *
from plotnine.data import mpgFacets (subplots)
Facets split a plot into multiple subplots, based on one or more variables. facet_wrap() creates a sequence of subplots, while facet_grid() creates a matrix of subplots.
TipYou will learn
- How to create a sequence or matrix of subplots.
- How to use a special facetting syntax to define subplots.
- How to configure the x- and y-axis of subplots.
NoteKey points
facet_wrap()creates a sequence of subplots.- The
ncolornrowarguments tofacet_wrap()control the number of columns or rows. facet_grid()creates a matrix of subplots based on two or more variables.- The
scalesargument can set a combination of thexandyaxis to fixed for free.
Setup
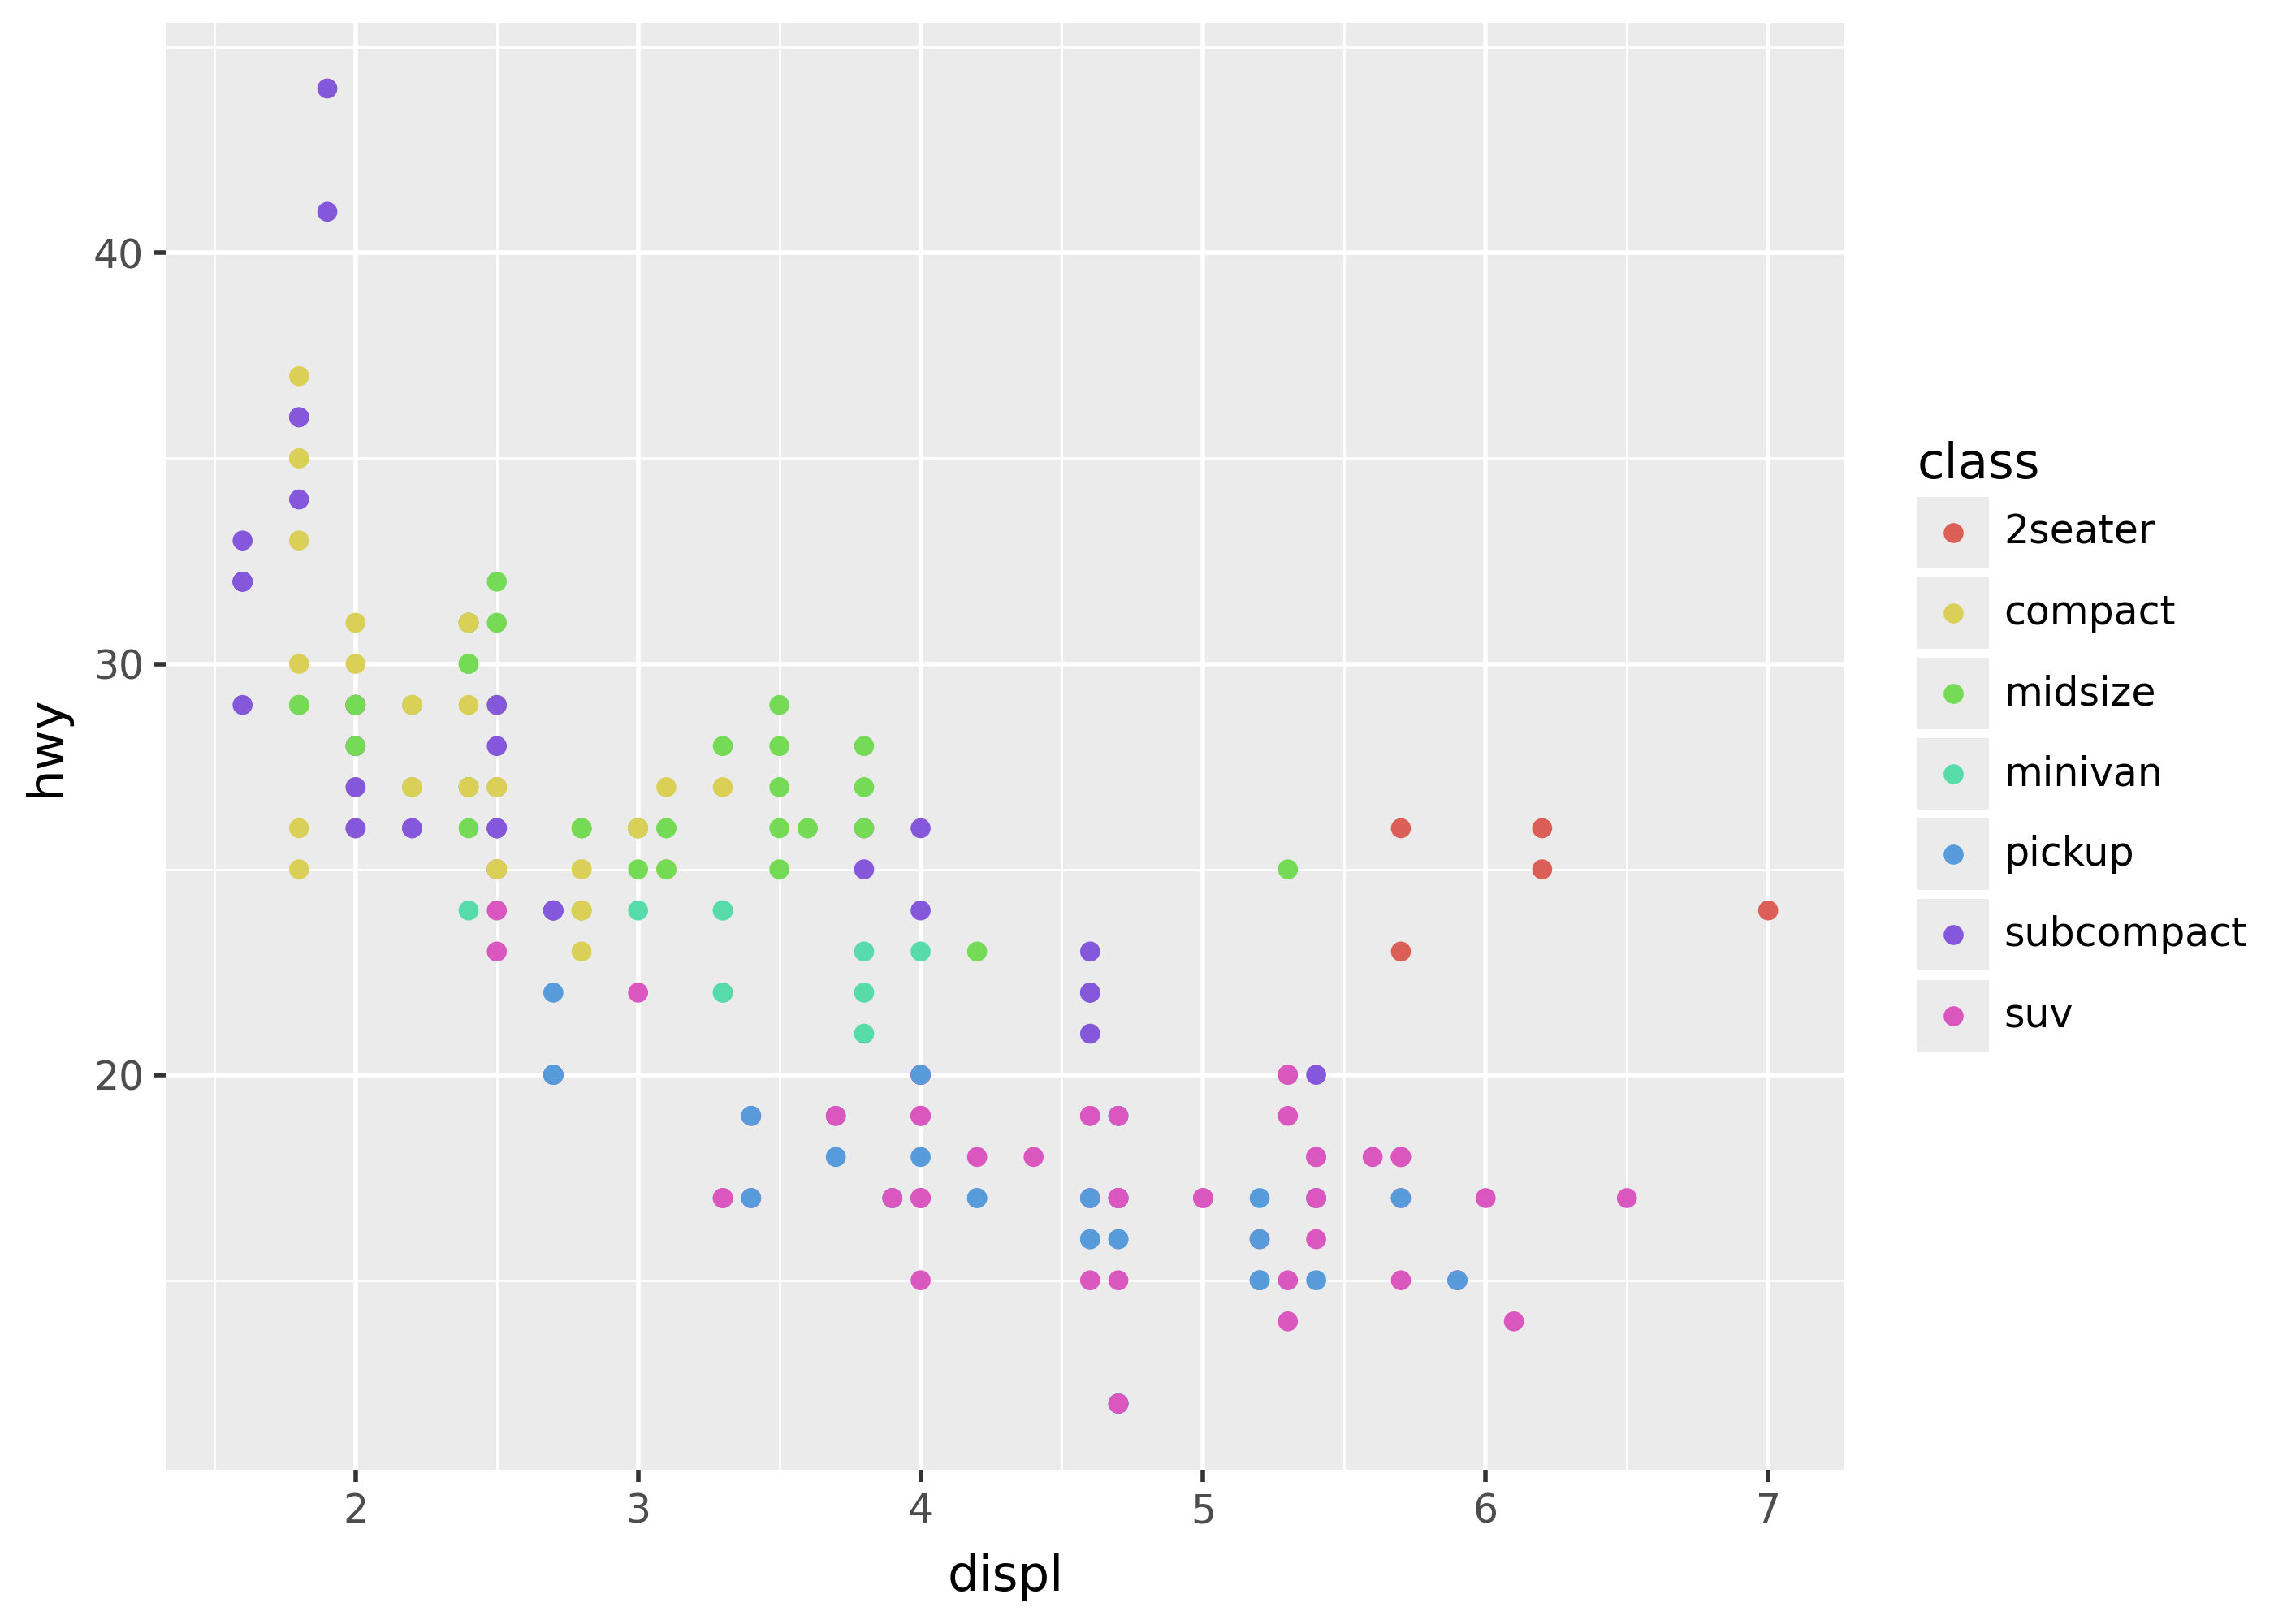
Here is a single big plot that you might want to split into subplots.
(
    ggplot(mpg, aes("displ", "hwy", color="class")) + geom_point()
)
facet_wrap(): subplot sequence
Use facet_wrap() to create a sequence of subplots. It accepts as its first argument the name of the column that should be used to split the data for subplots.
(
    ggplot(mpg, aes("displ", "hwy", color="class"))
    + geom_point(show_legend=False)
    + facet_wrap("class")
)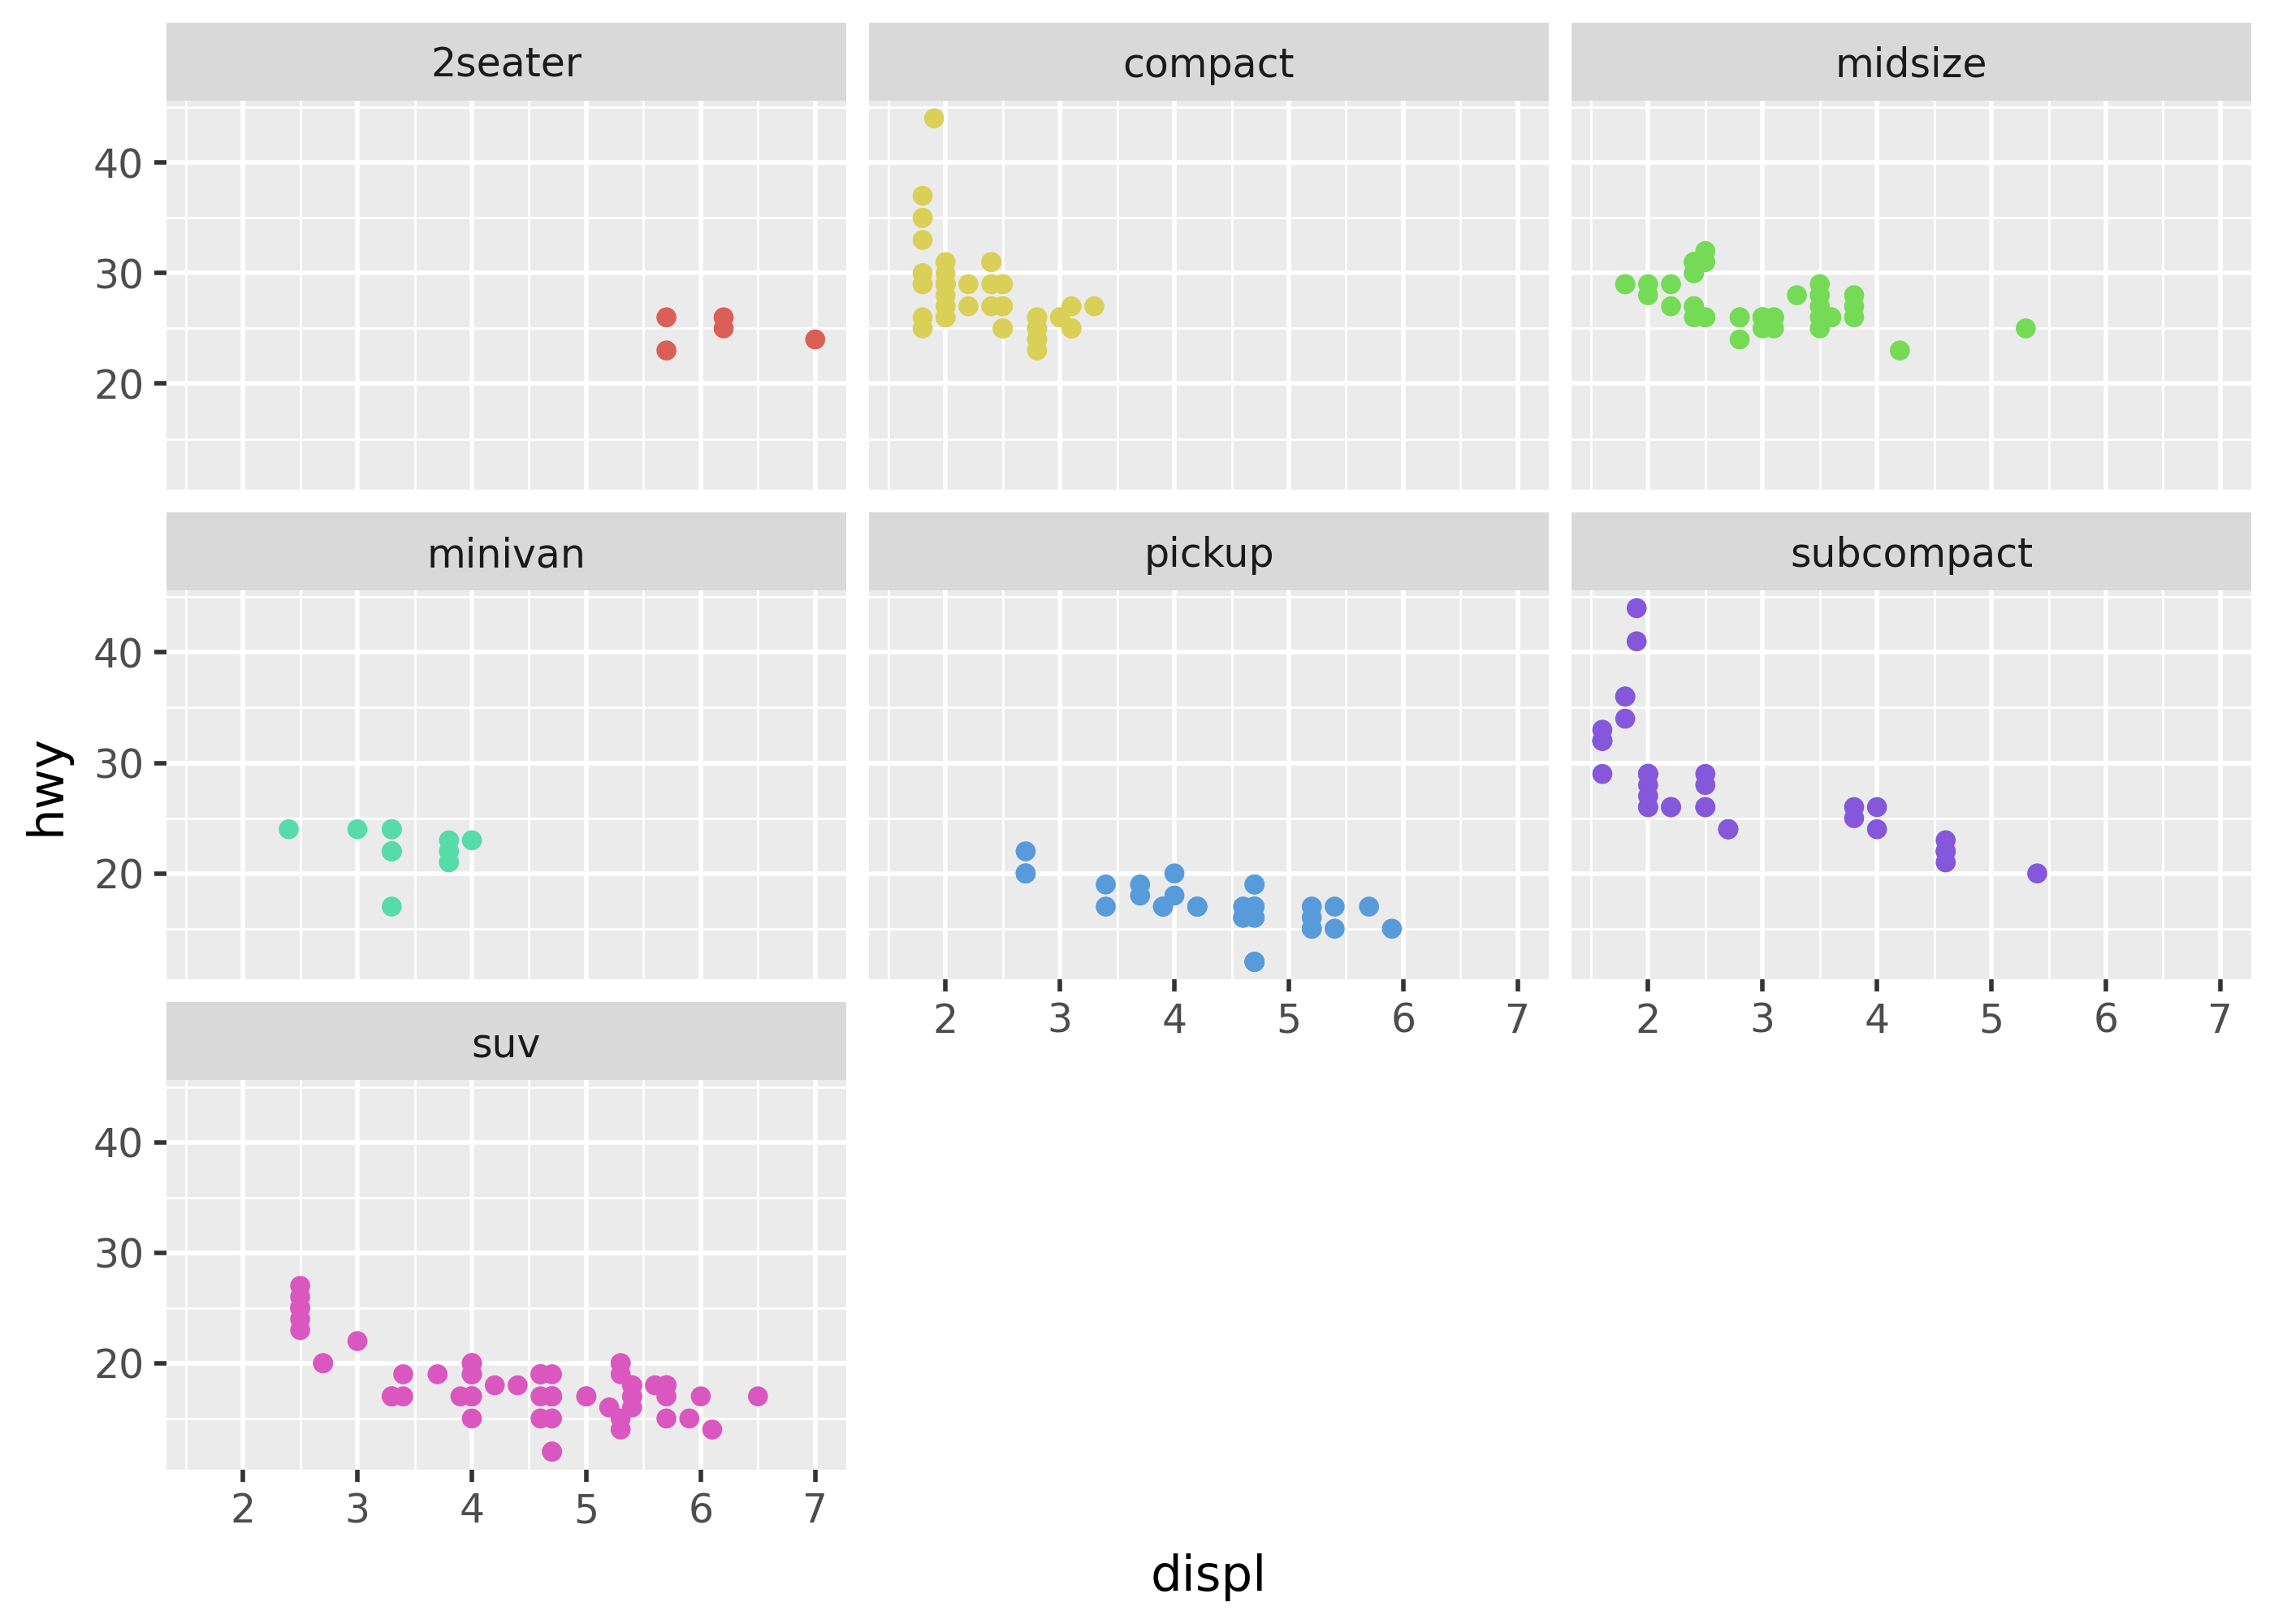
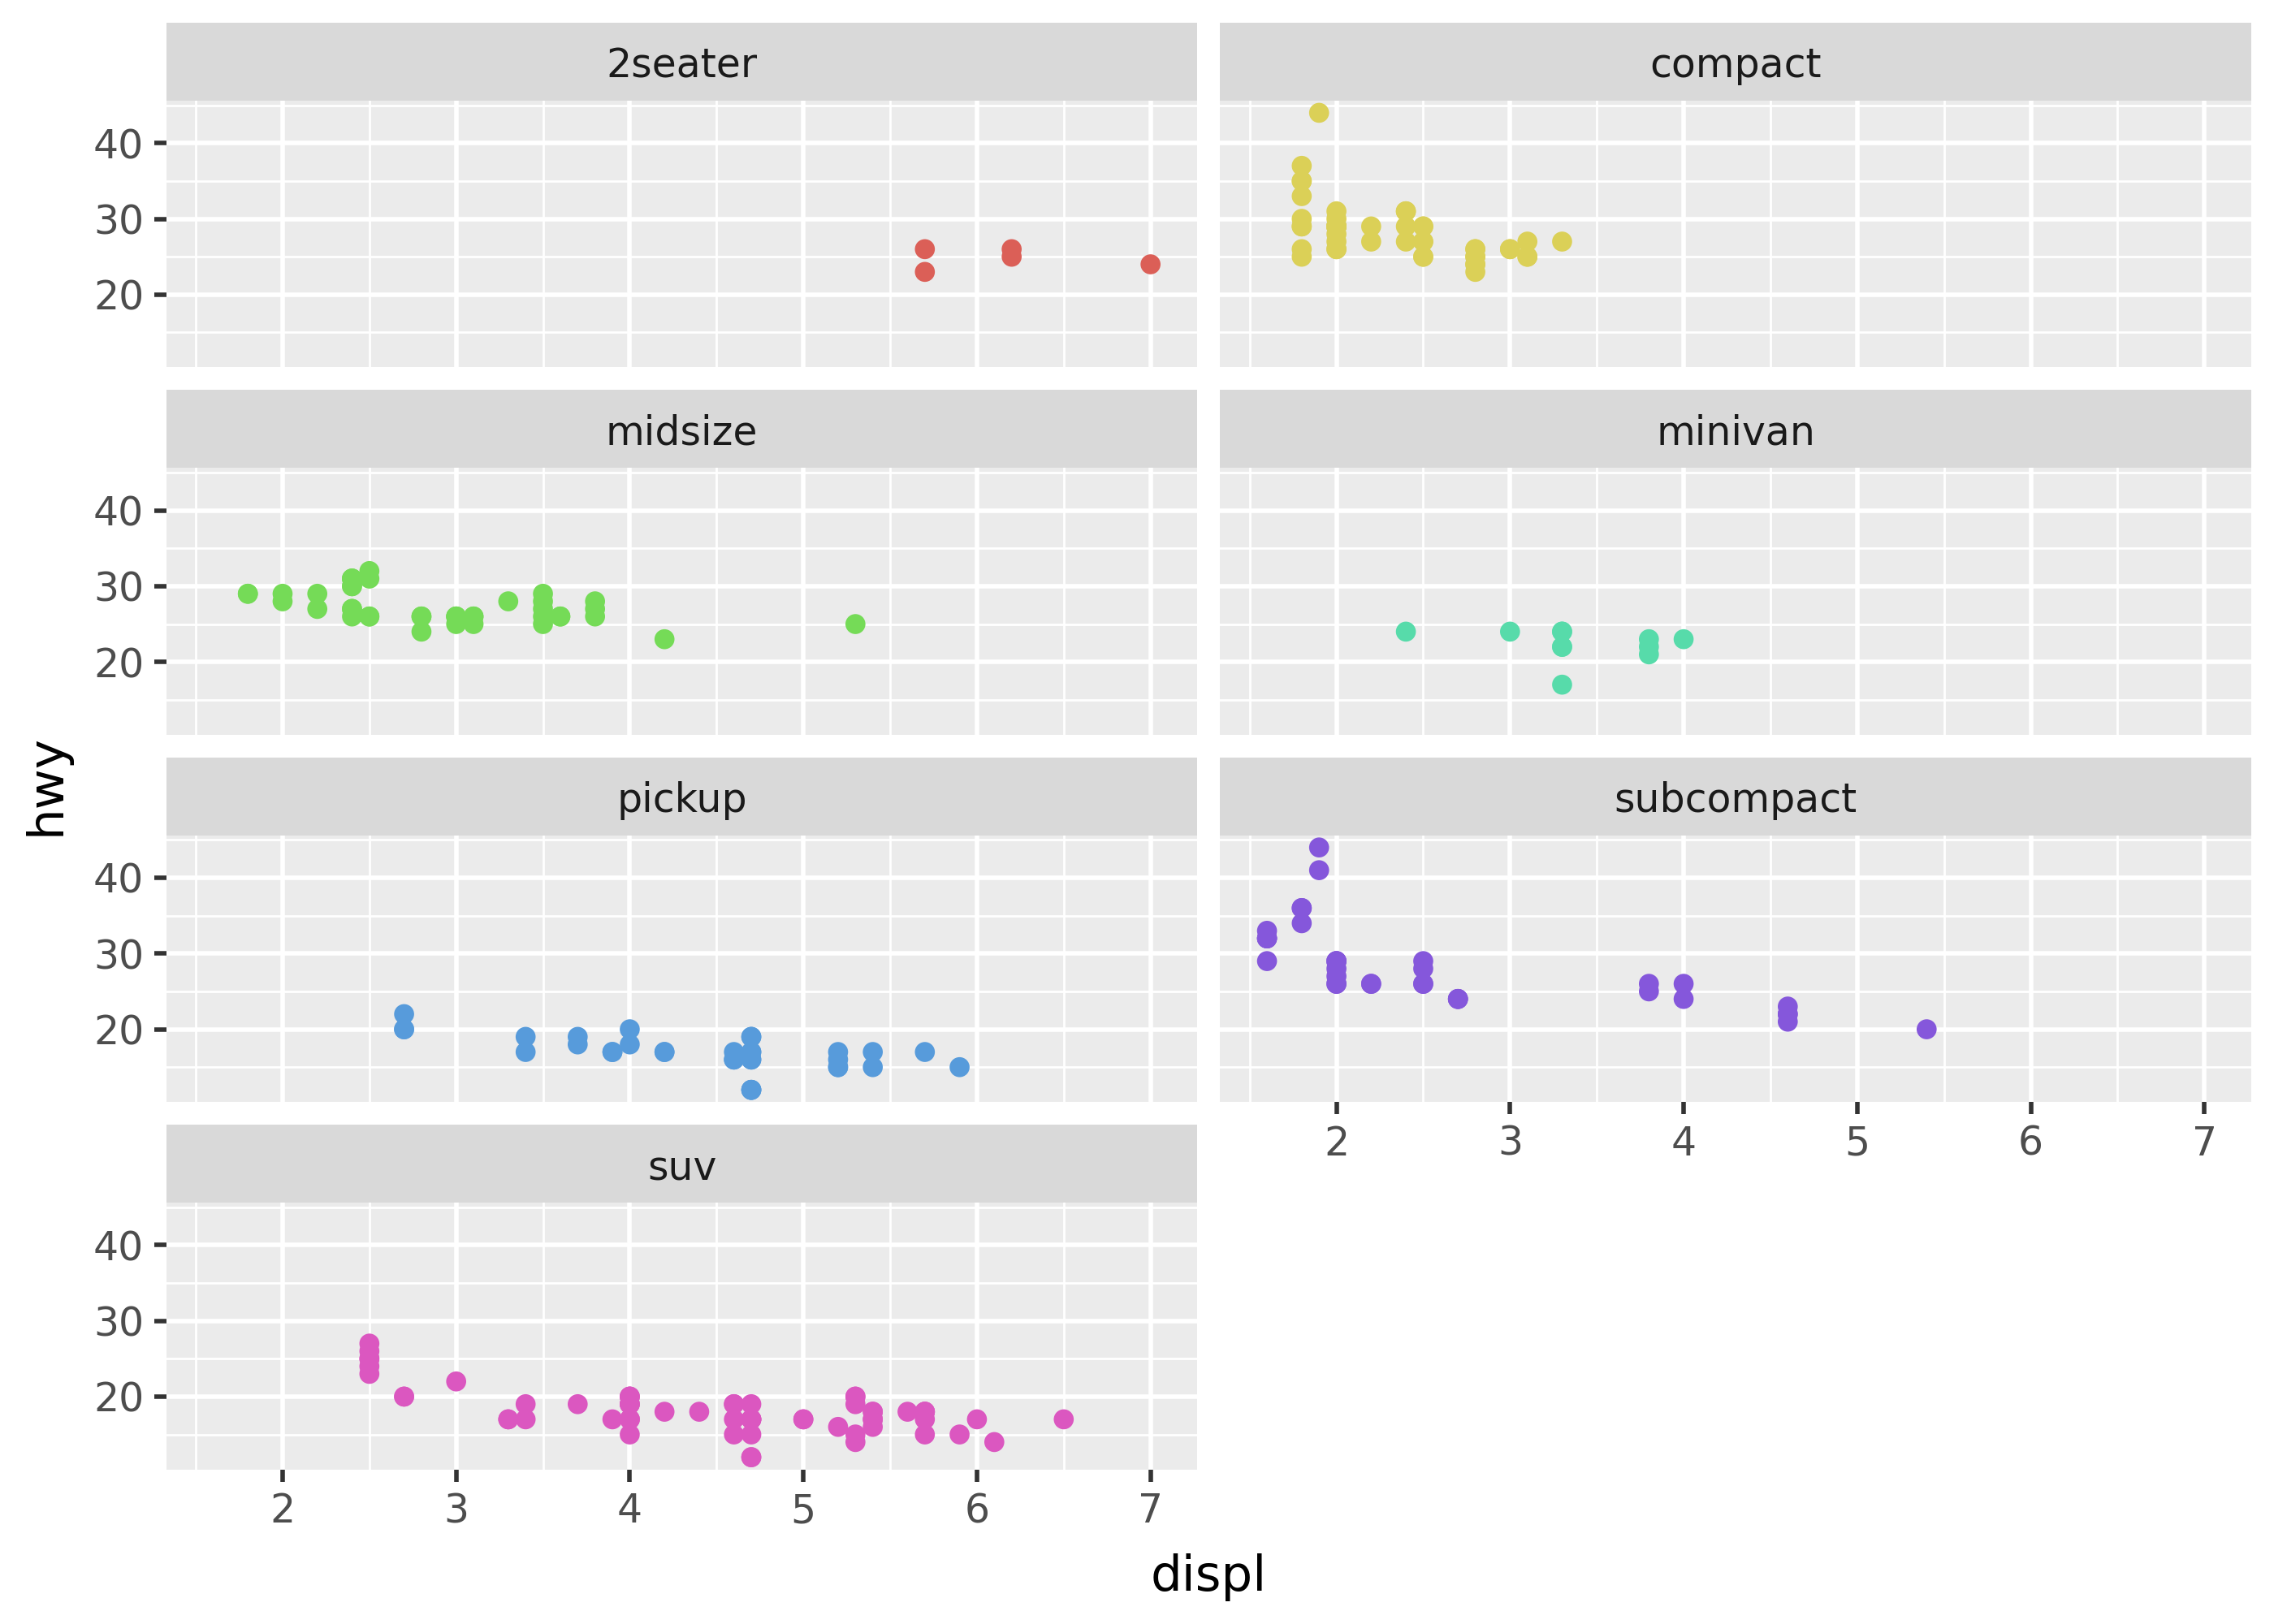
Note that by default facet_wrap() fills row-by-row, with defaults for the number of subplots per row and column. Use either the ncol= or nrow= argument to fix the number of plots per column or row, respectively.
(
    ggplot(mpg, aes("displ", "hwy", color="class"))
    + geom_point(show_legend=False)
    + facet_wrap("class", ncol=2)
)
facet_grid(): subplot matrix
Use facet_grid() to create a matrix of subplots. It accepts two column names as arguments, the first for the rows and the second for the columns.
(ggplot(mpg, aes("displ", "hwy")) + geom_point() + facet_grid("cyl", "year"))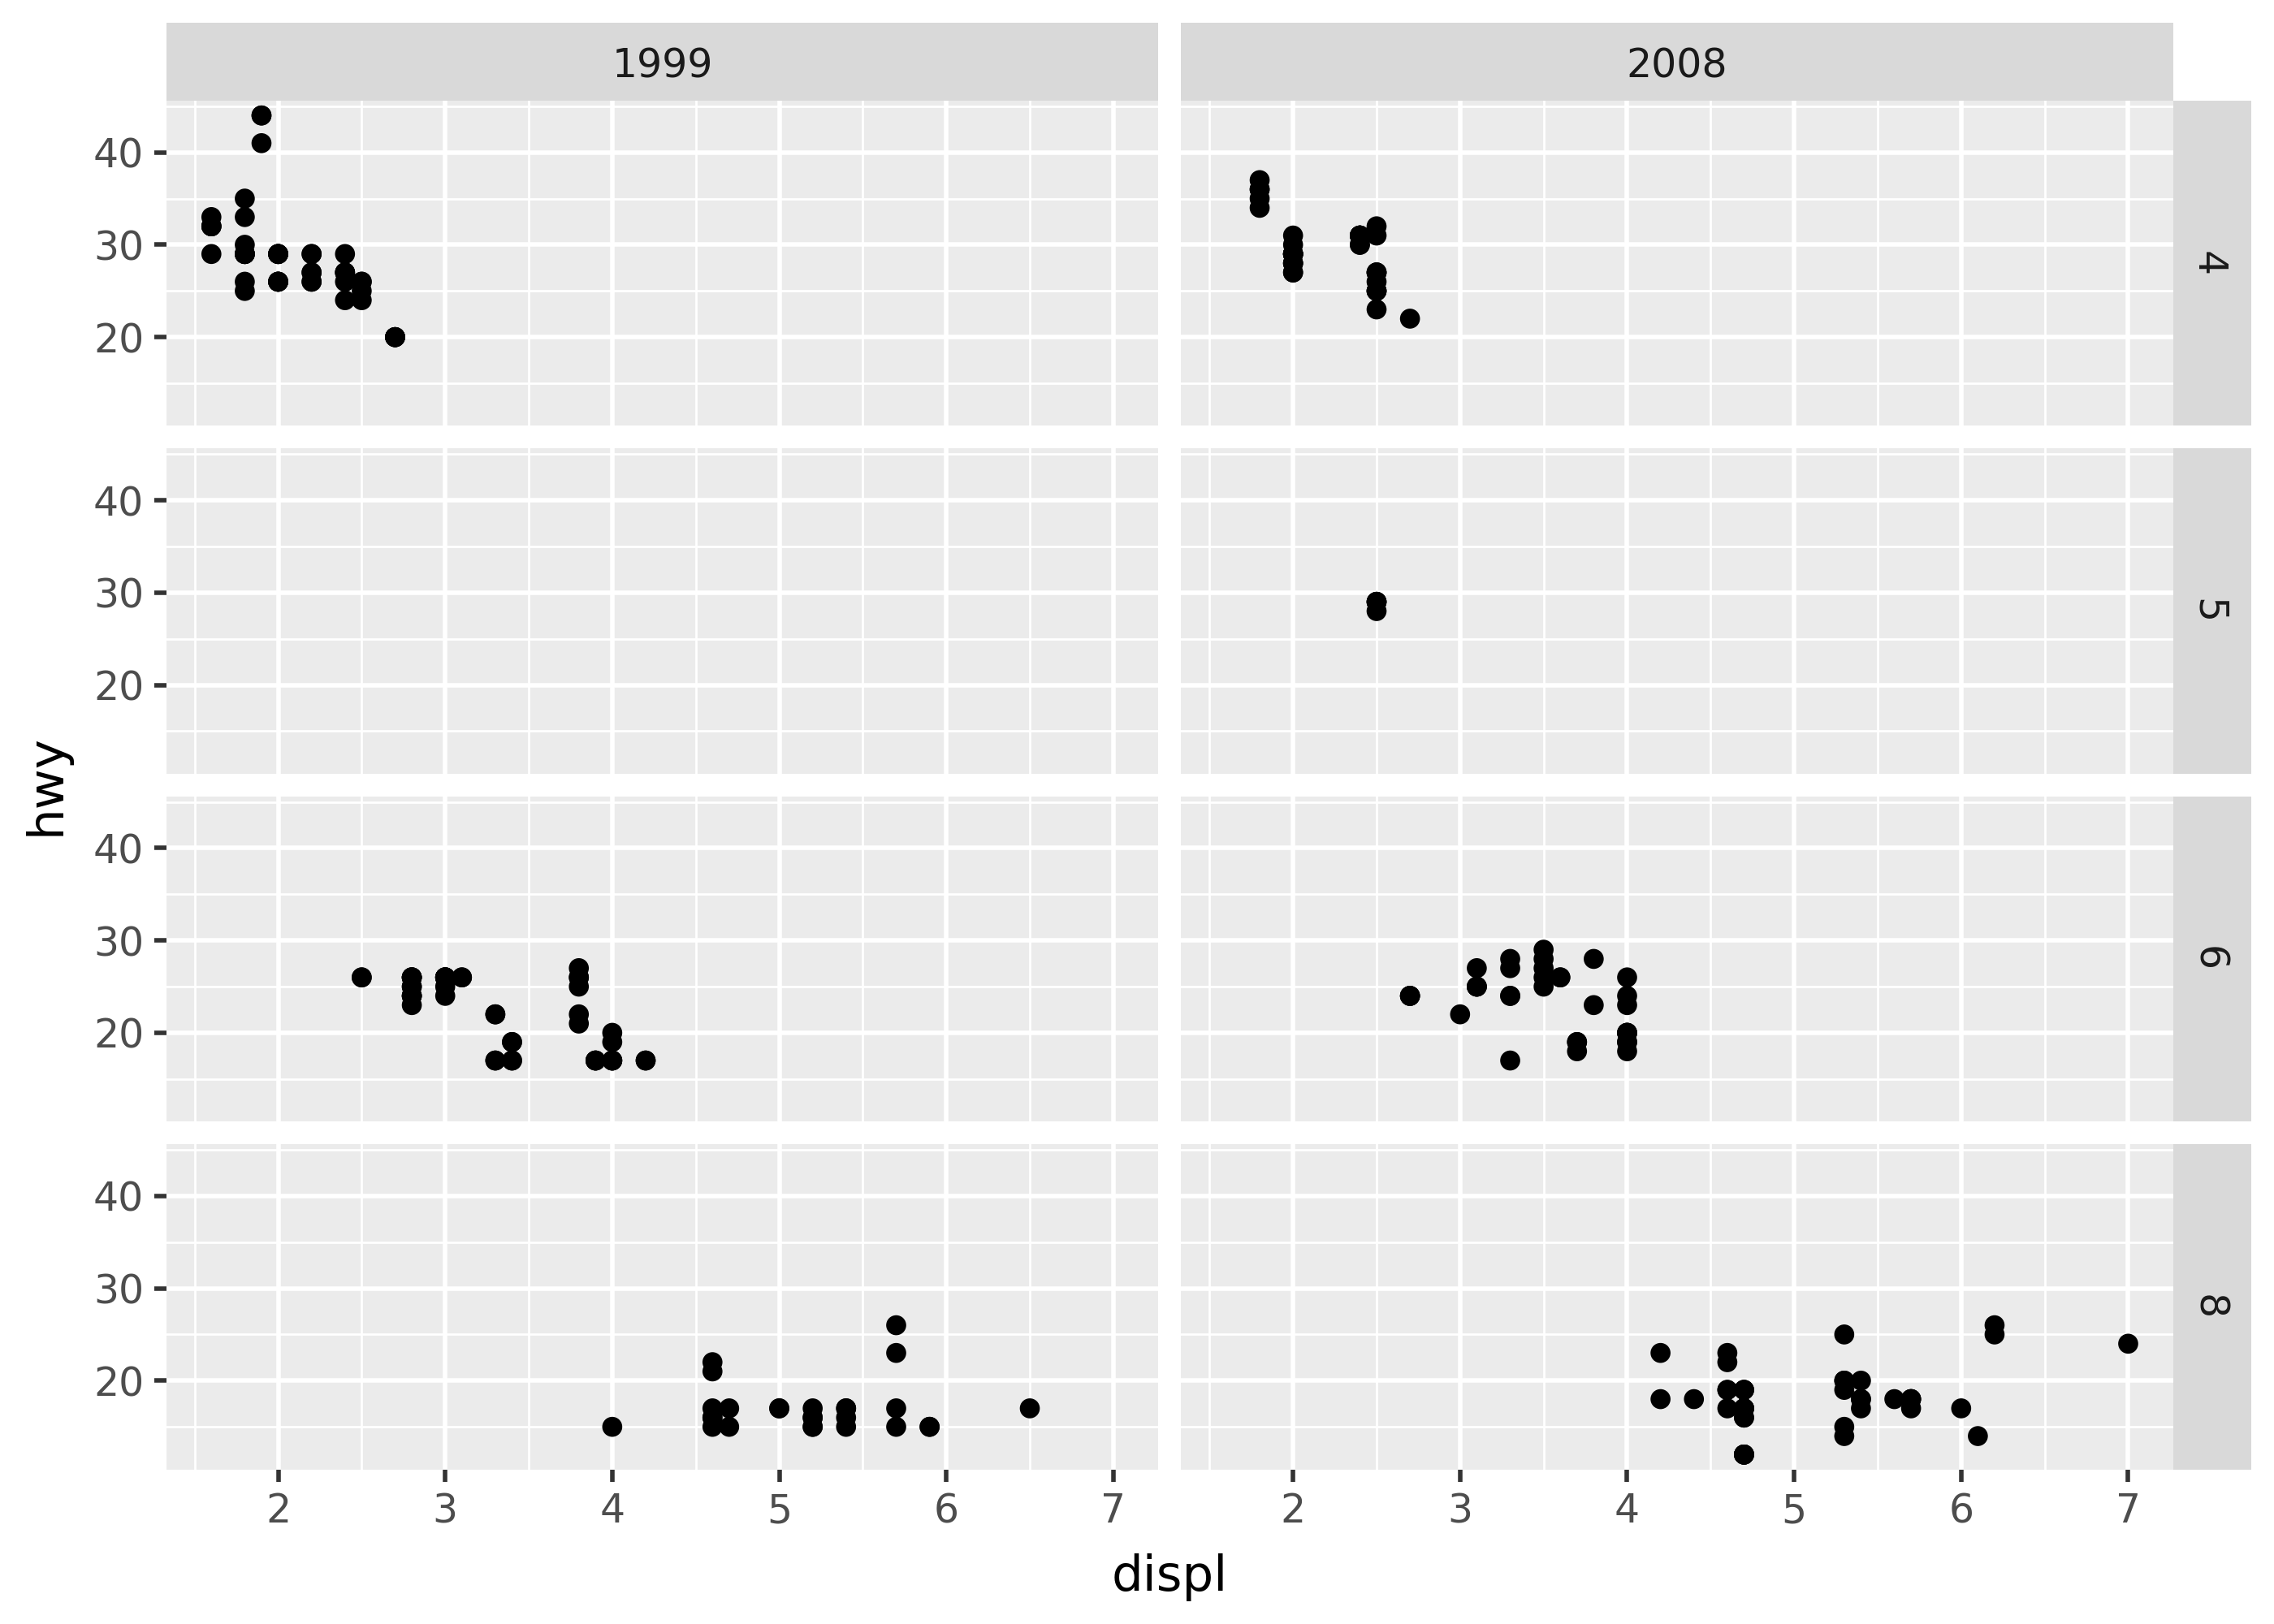
facetting syntax
Both facet_wrap() and facet_grid() support a special syntax for defining subplots. It takes the form "var1 ~ var2 + var3"
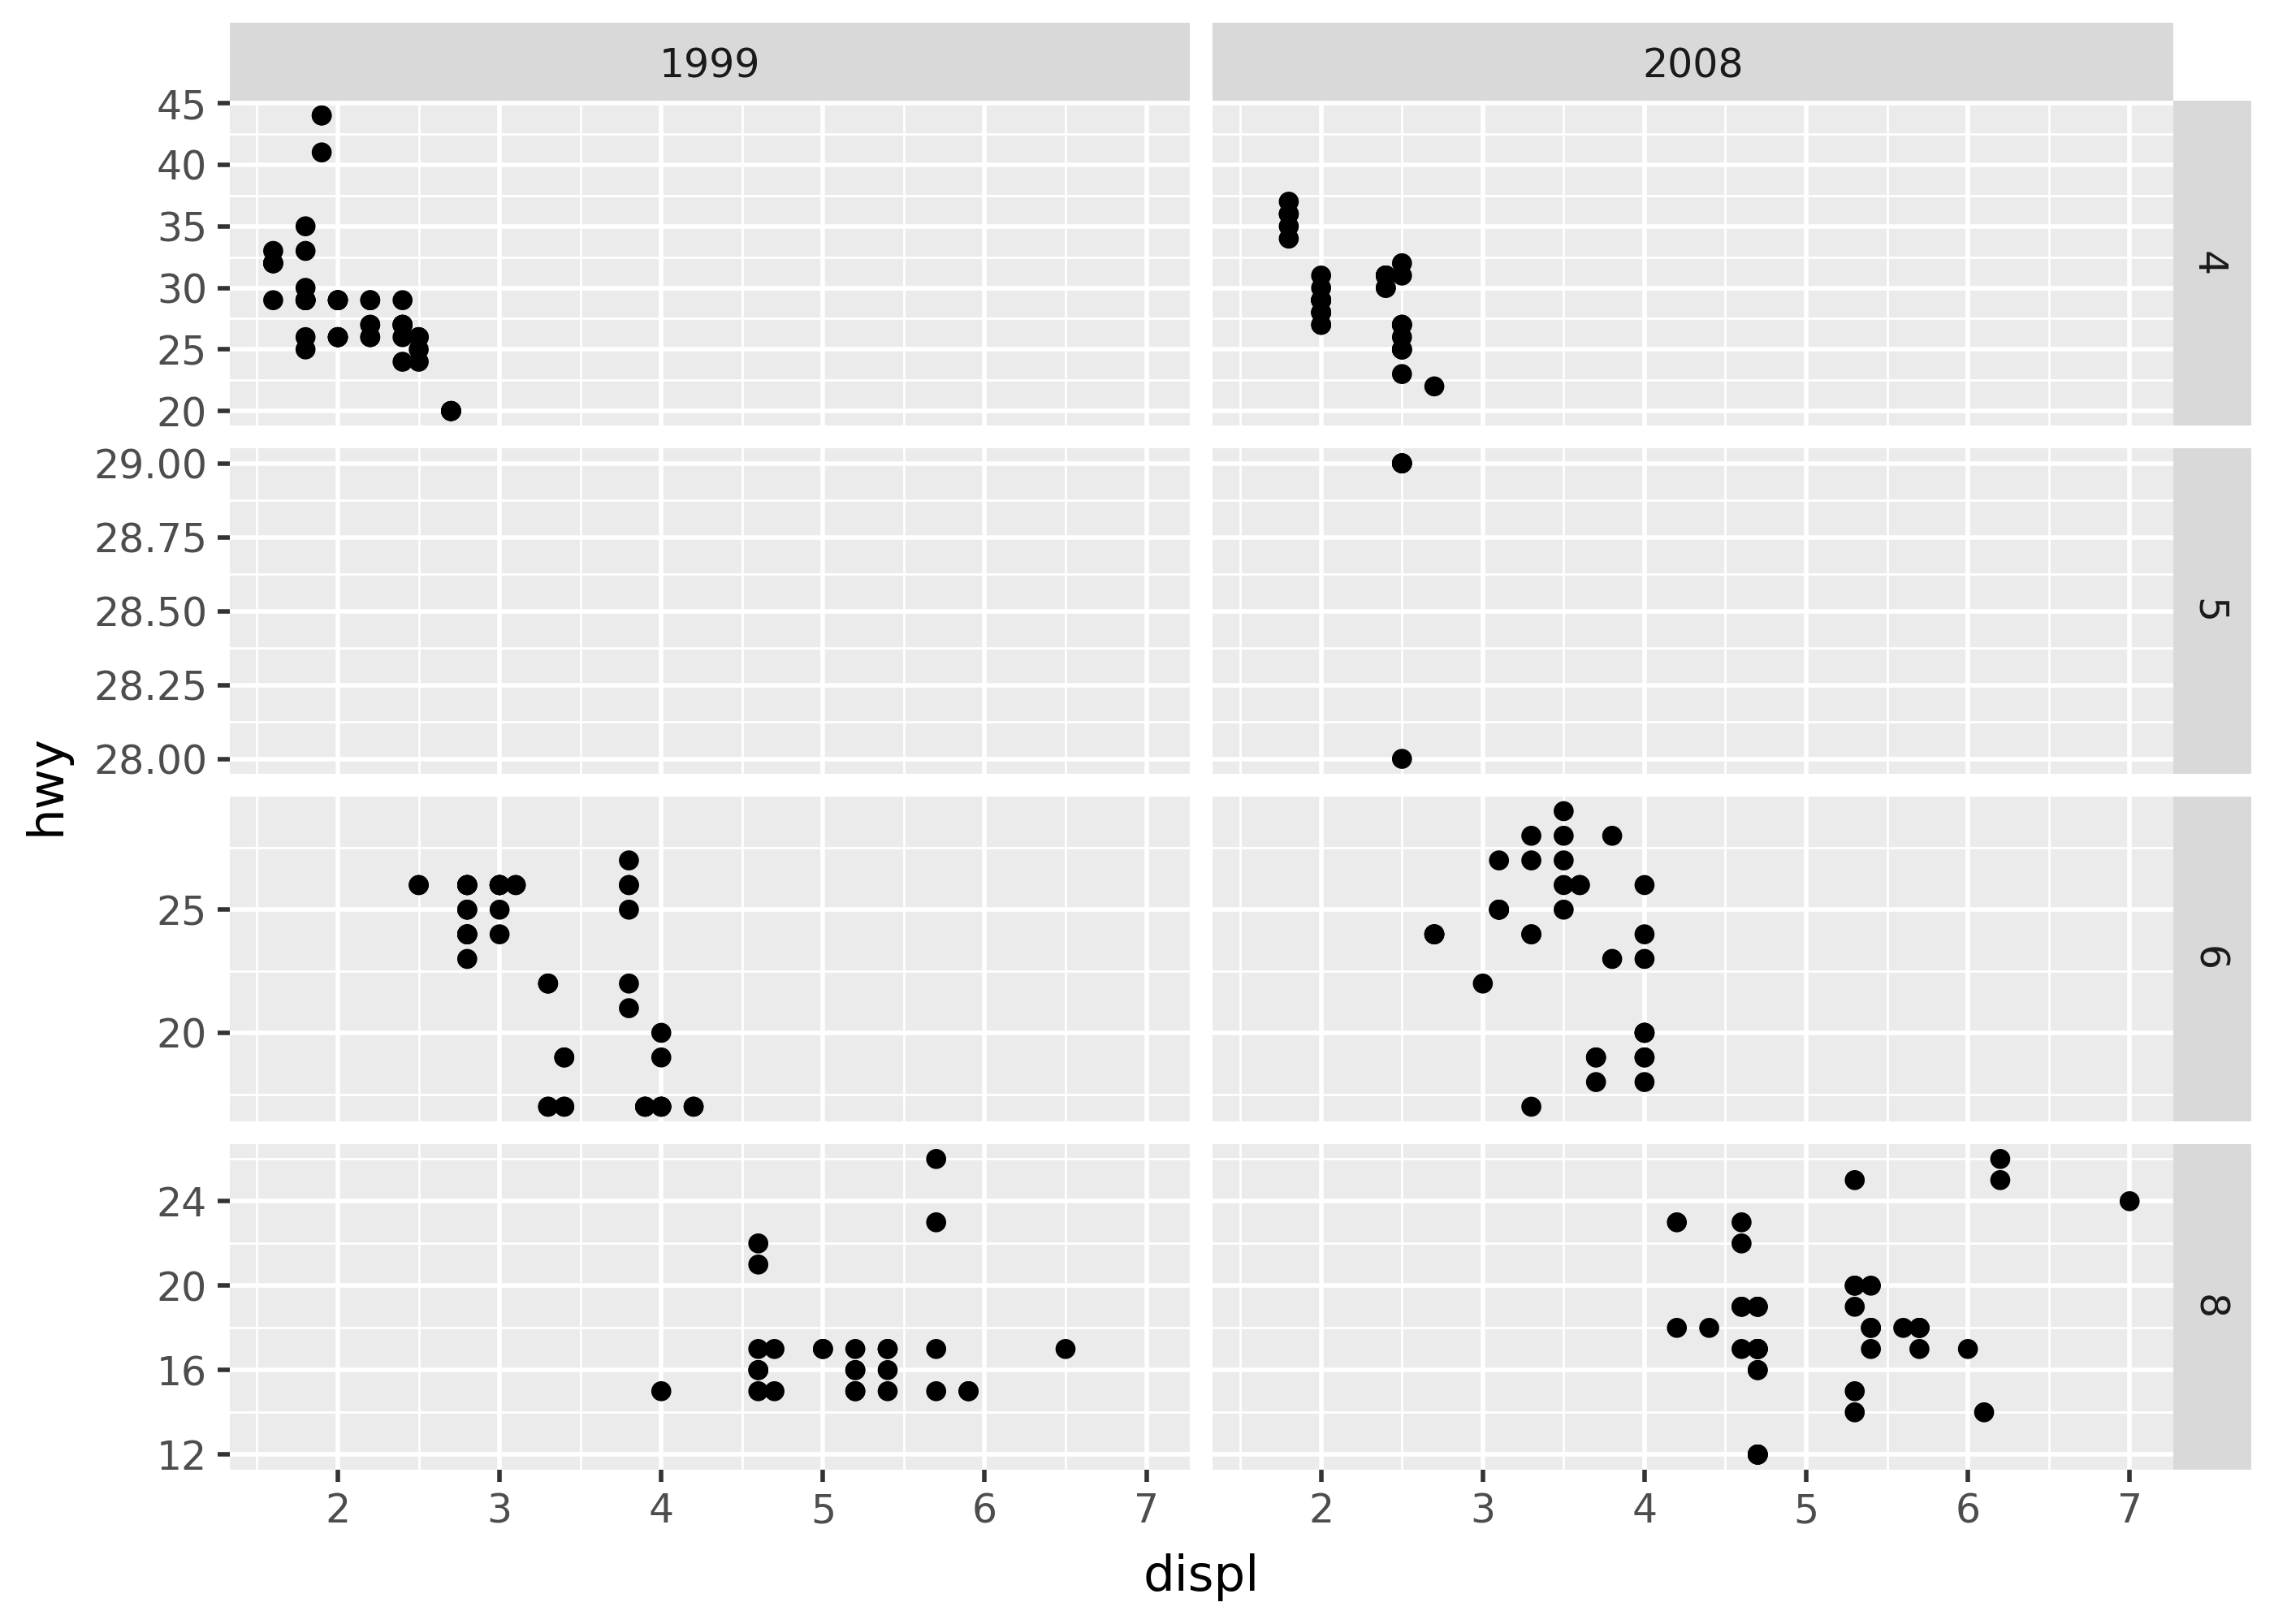
(ggplot(mpg, aes("displ", "hwy")) + geom_point() + facet_grid("cyl ~ year"))
Notice that cyl values (e.g. 4, 5, 6, 8) are on the rows, while year values are on the columns.
The column names to the left of the tilde (~) define subplot rows, while those to the right define subplot columns. The plus sign (+) groups variables for creating subplots.
scales= for freeing axes
By default, the x- and y-axes of each subplot have the same range. Use the scales= argument to allow each row or column to have its own range.
(
    ggplot(mpg, aes("displ", "hwy"))
    + geom_point()
    + facet_grid("cyl ~ year", scales="free_y")
)