from plotnine import *
from plotnine.data import diamonds, mpgCoordinate systems
Coordinate systems determine how the x- and y-axes of a plot are drawn. For example, coord_flip() switches the x- and y-axes, while coord_fixed() ensures they have the same spacing.
TipYou will learn
- What coordinate systems are common for plots.
- How to flip and fix axes.
- The difference between scale and coordinate systems limits.
NoteKey points
- Common coordinate systems include cartesian and polar.
- Use
coord_flip()to switch the x- and y-axes. - Use
coord_fixed()to ensure the x- and y-axes have the same spacing. - Limits at the coordinate level zoom in or out, while limits at the scale level remove data.
- Maps currently use
geom_map(), but will later have acoord_map().
Setup
coord_flip()
Use coord_flip() to switch the x- and y-axes of your plot.
p = ggplot(diamonds, aes("cut")) + geom_bar()

p
p + coord_flip()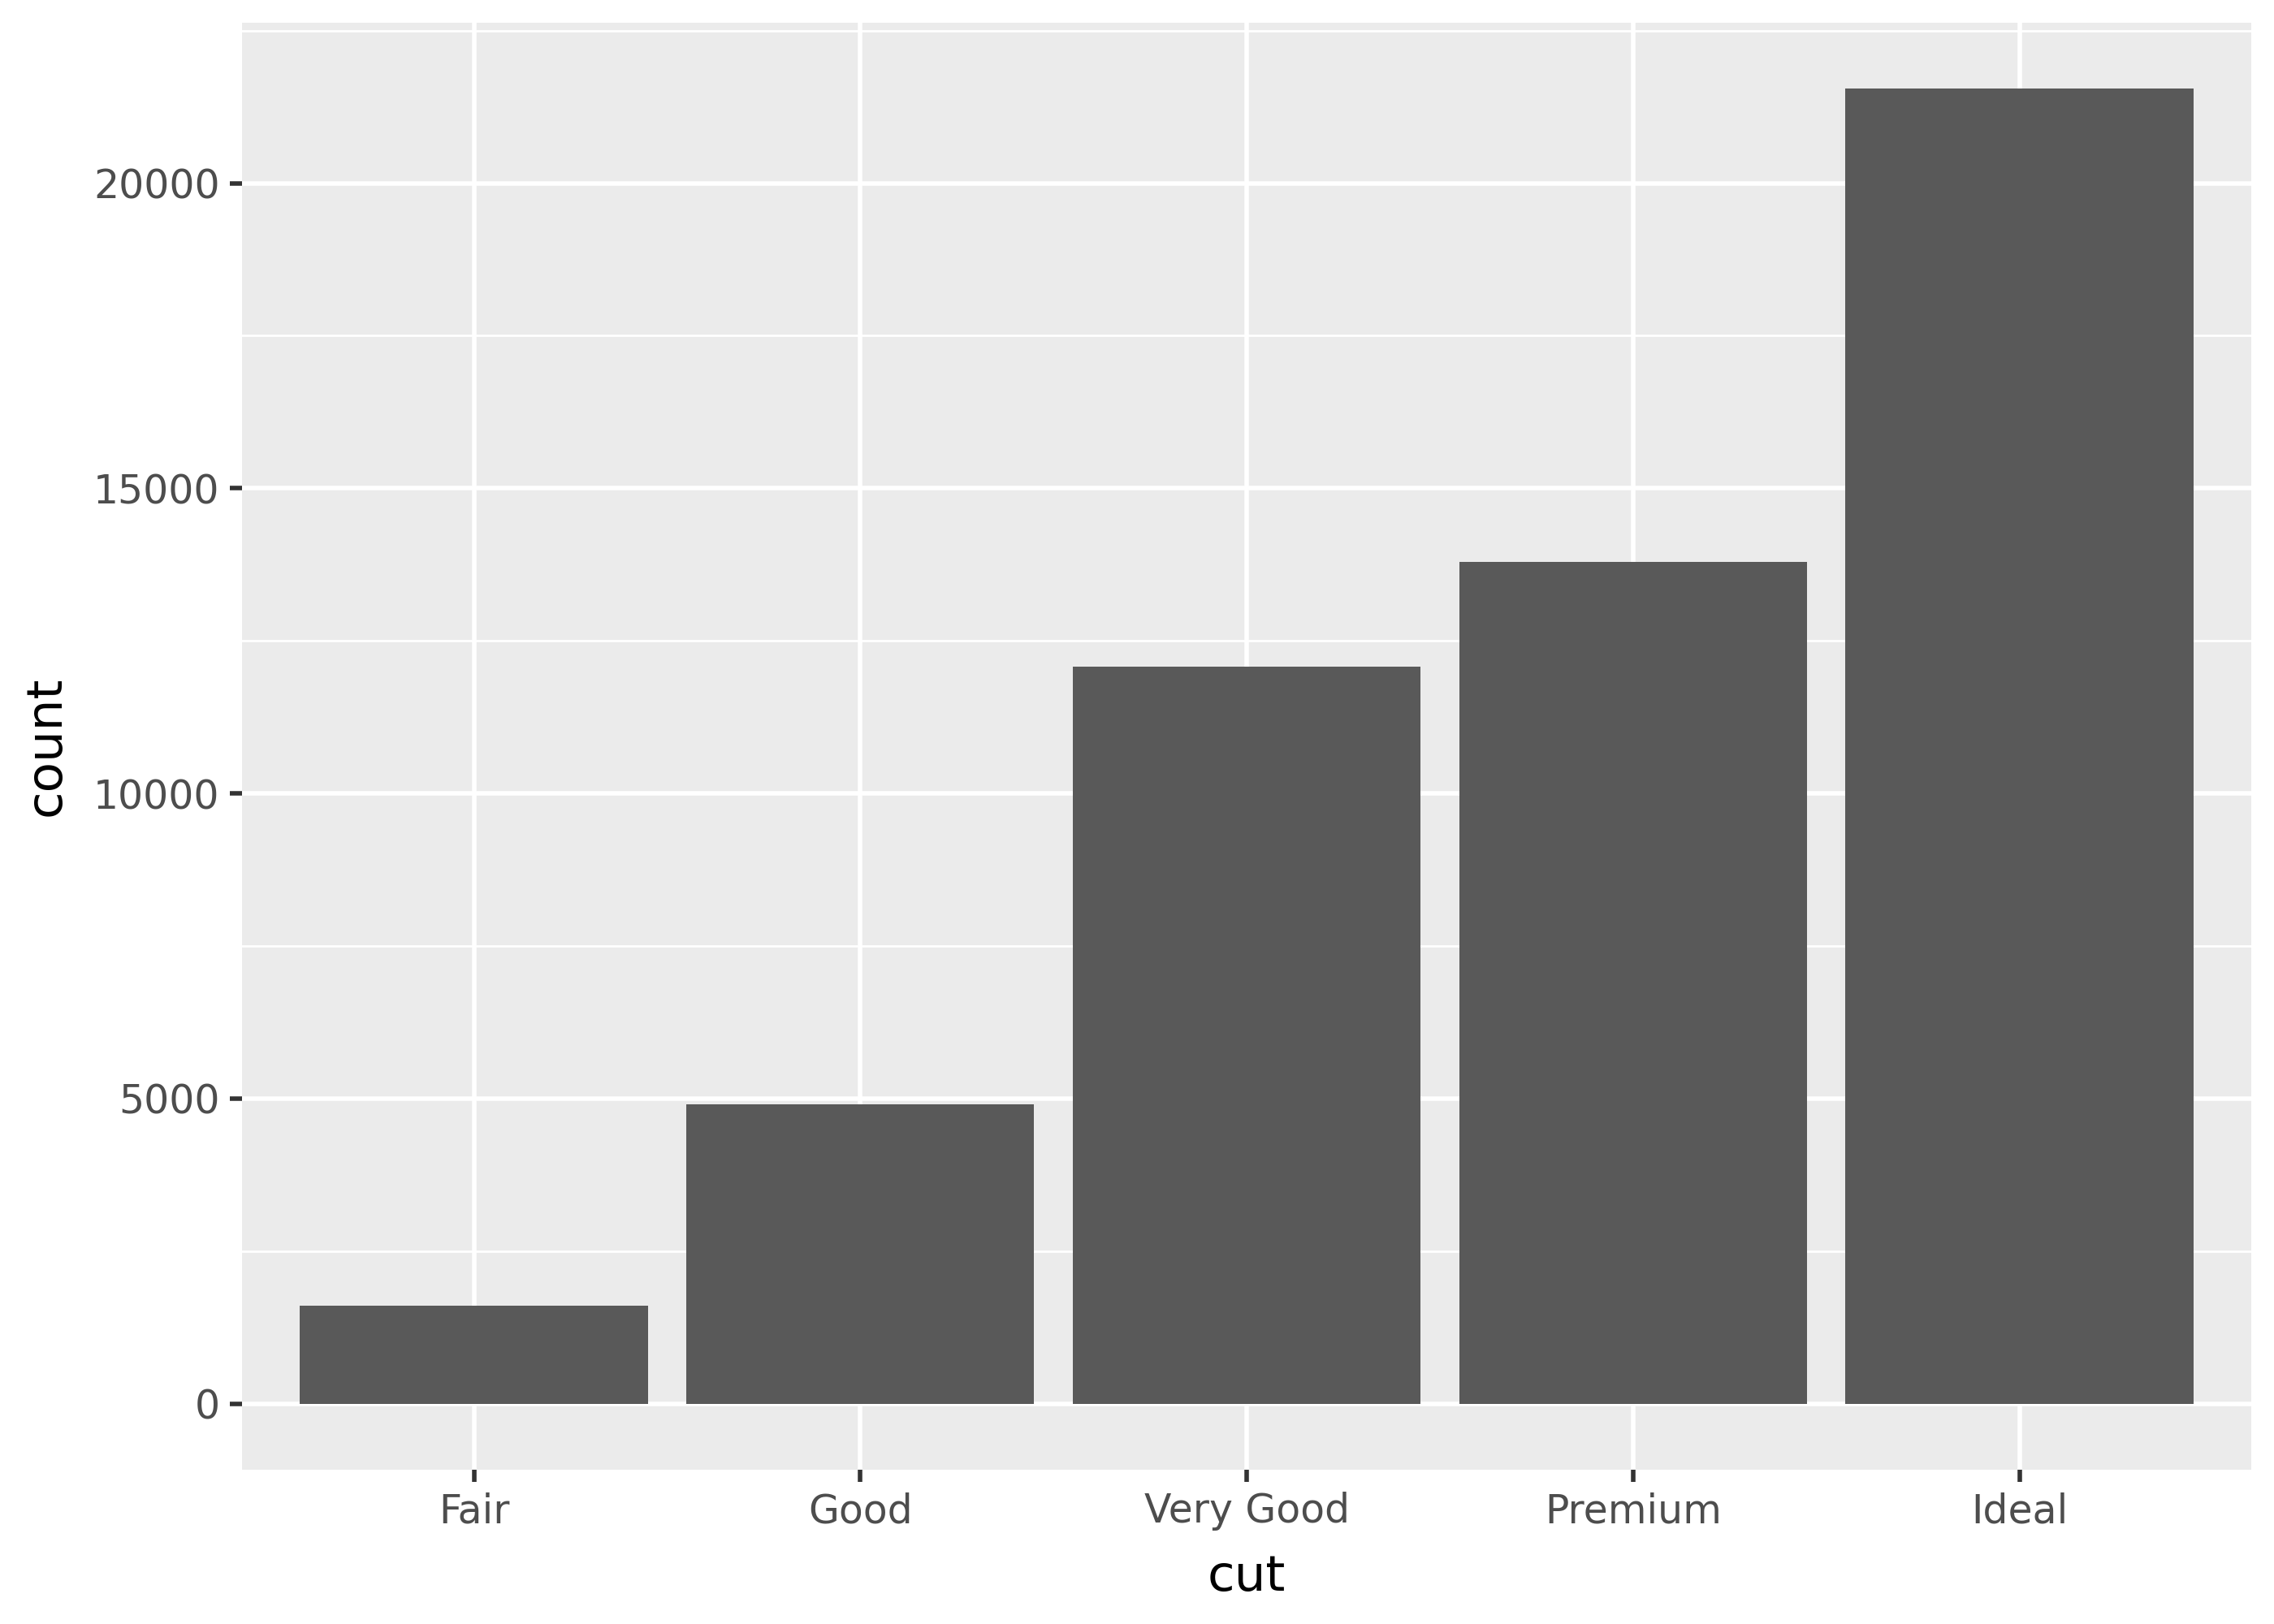
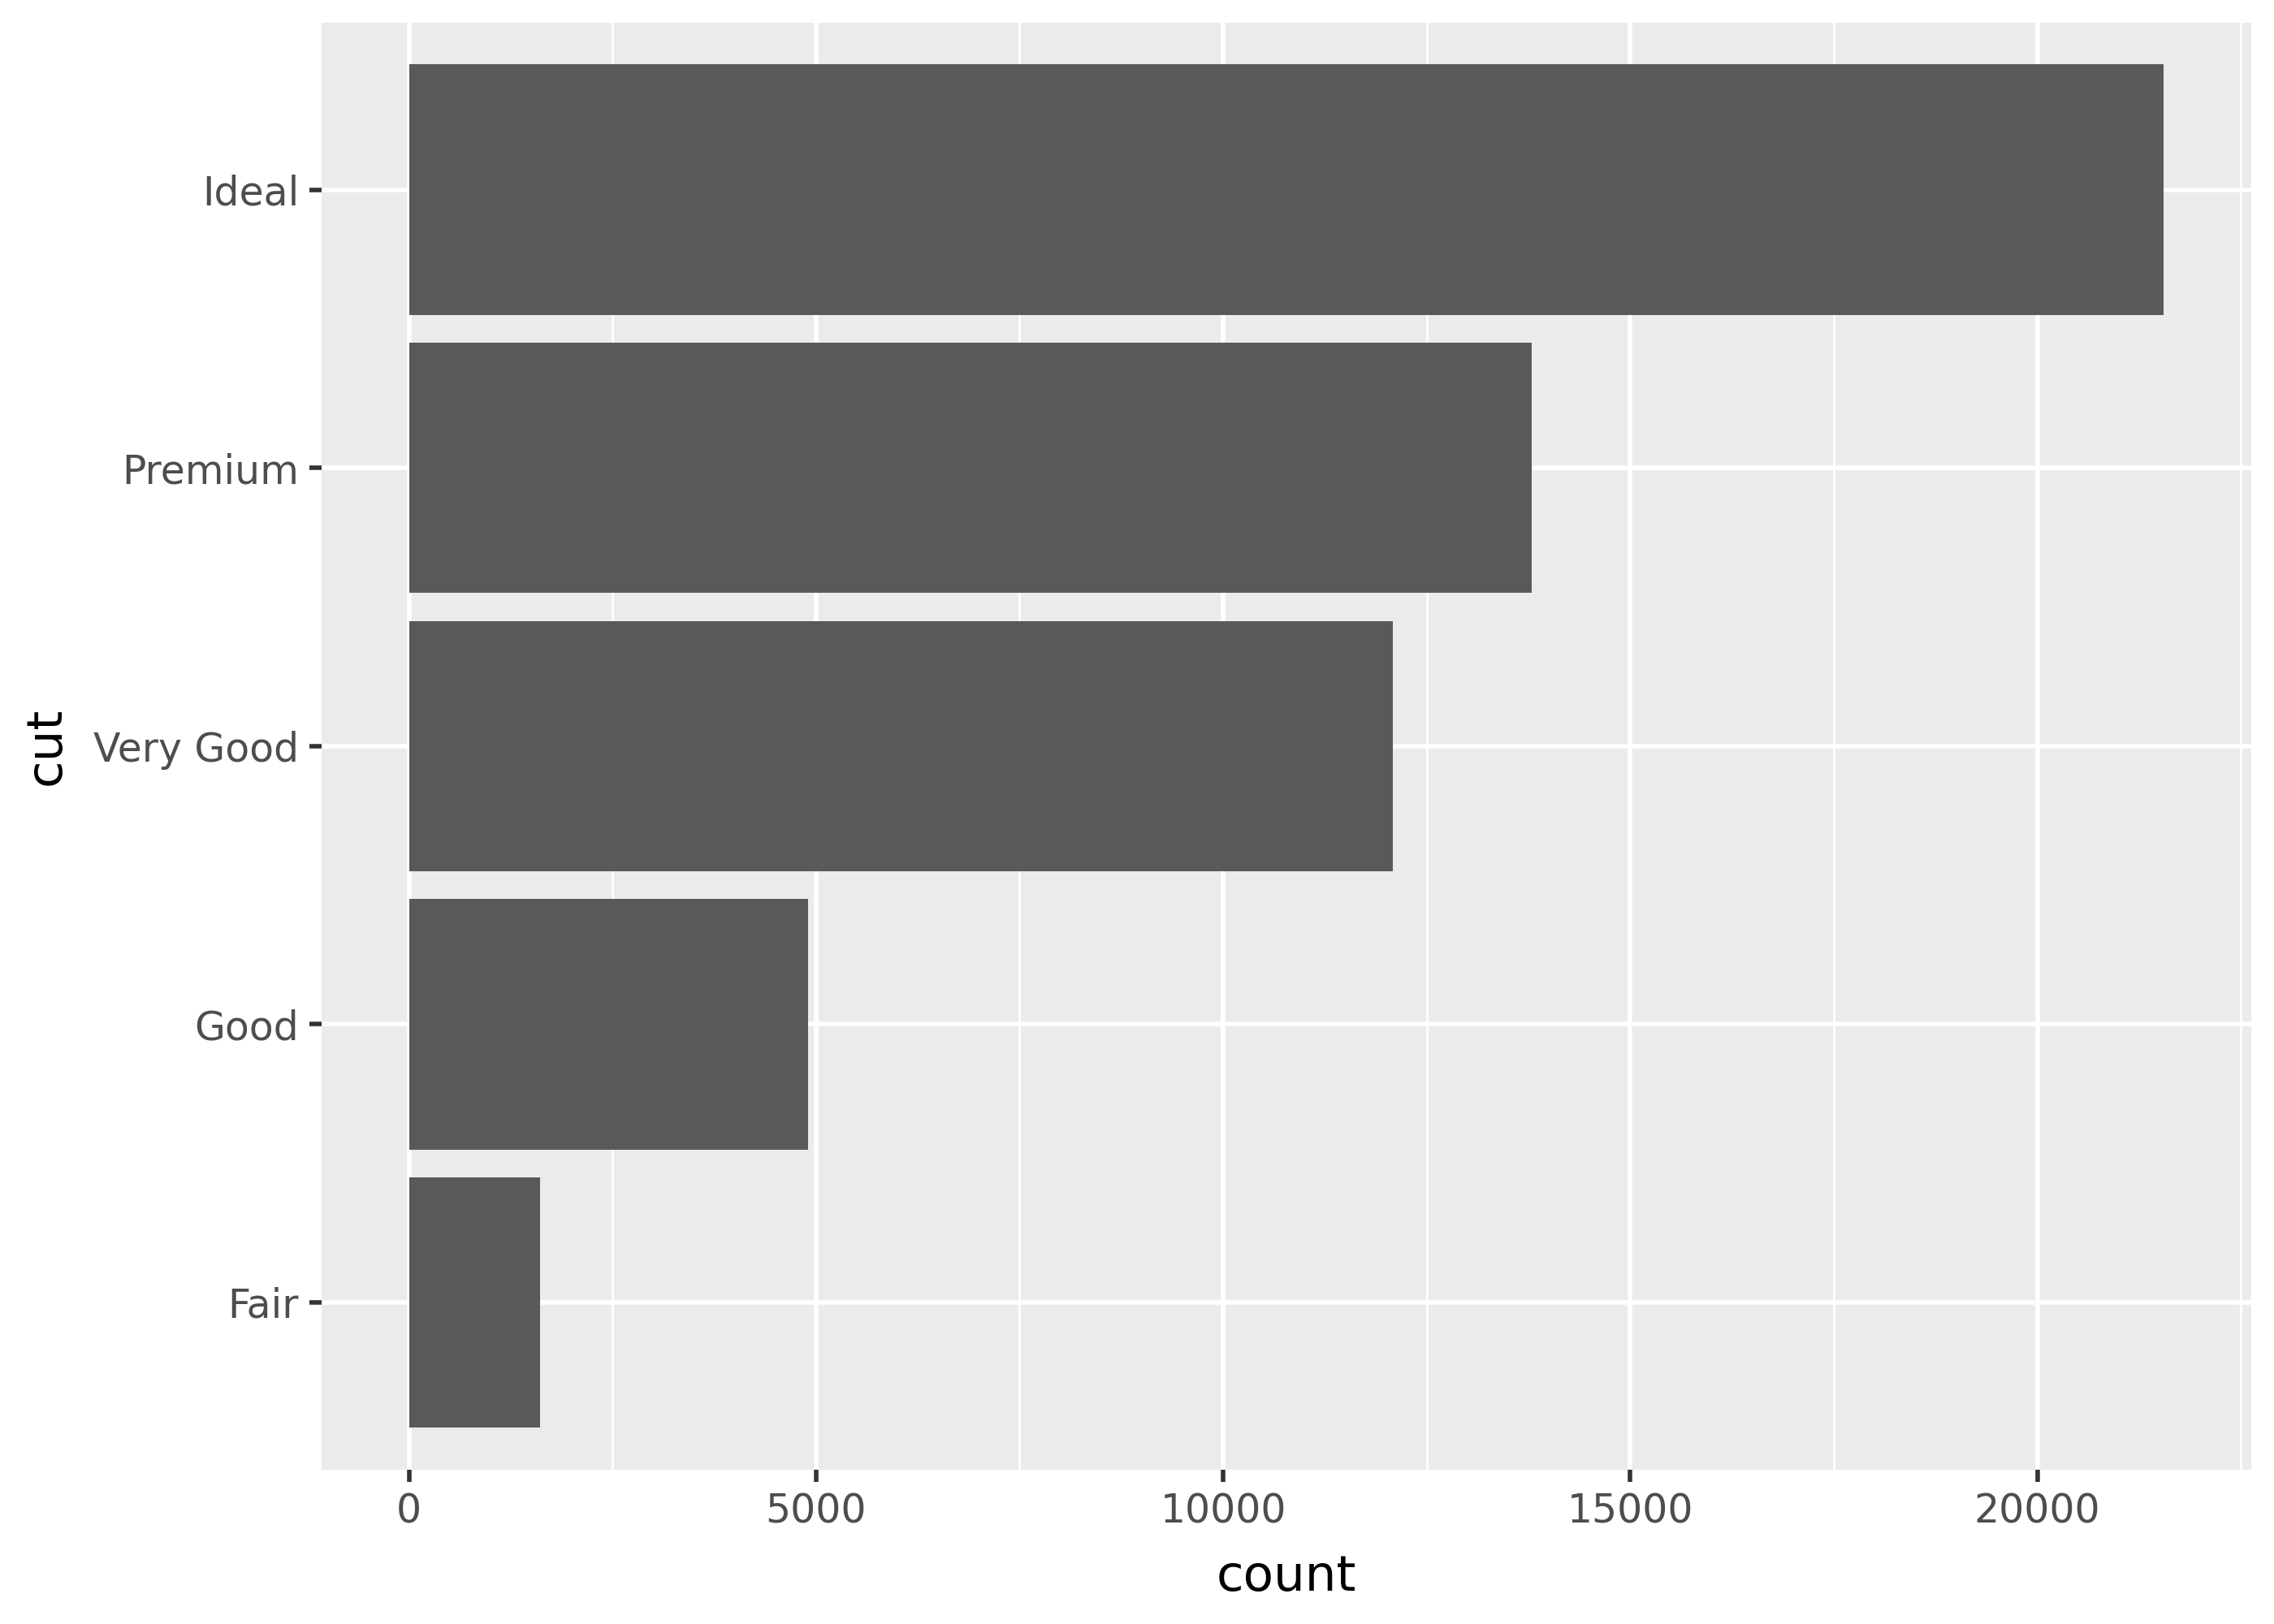
Notice that cut is the x-axis on the default plot (left), but the y-axis of the flipped one (right). This can be helpful for barplots with many individually labeled bars, since the labels won’t overlap with eachother. It can also be useful for taking advantage of wider plots.
Flipped plots use the original axis names for setting titles and scales, but the final plot axis names for theme options.
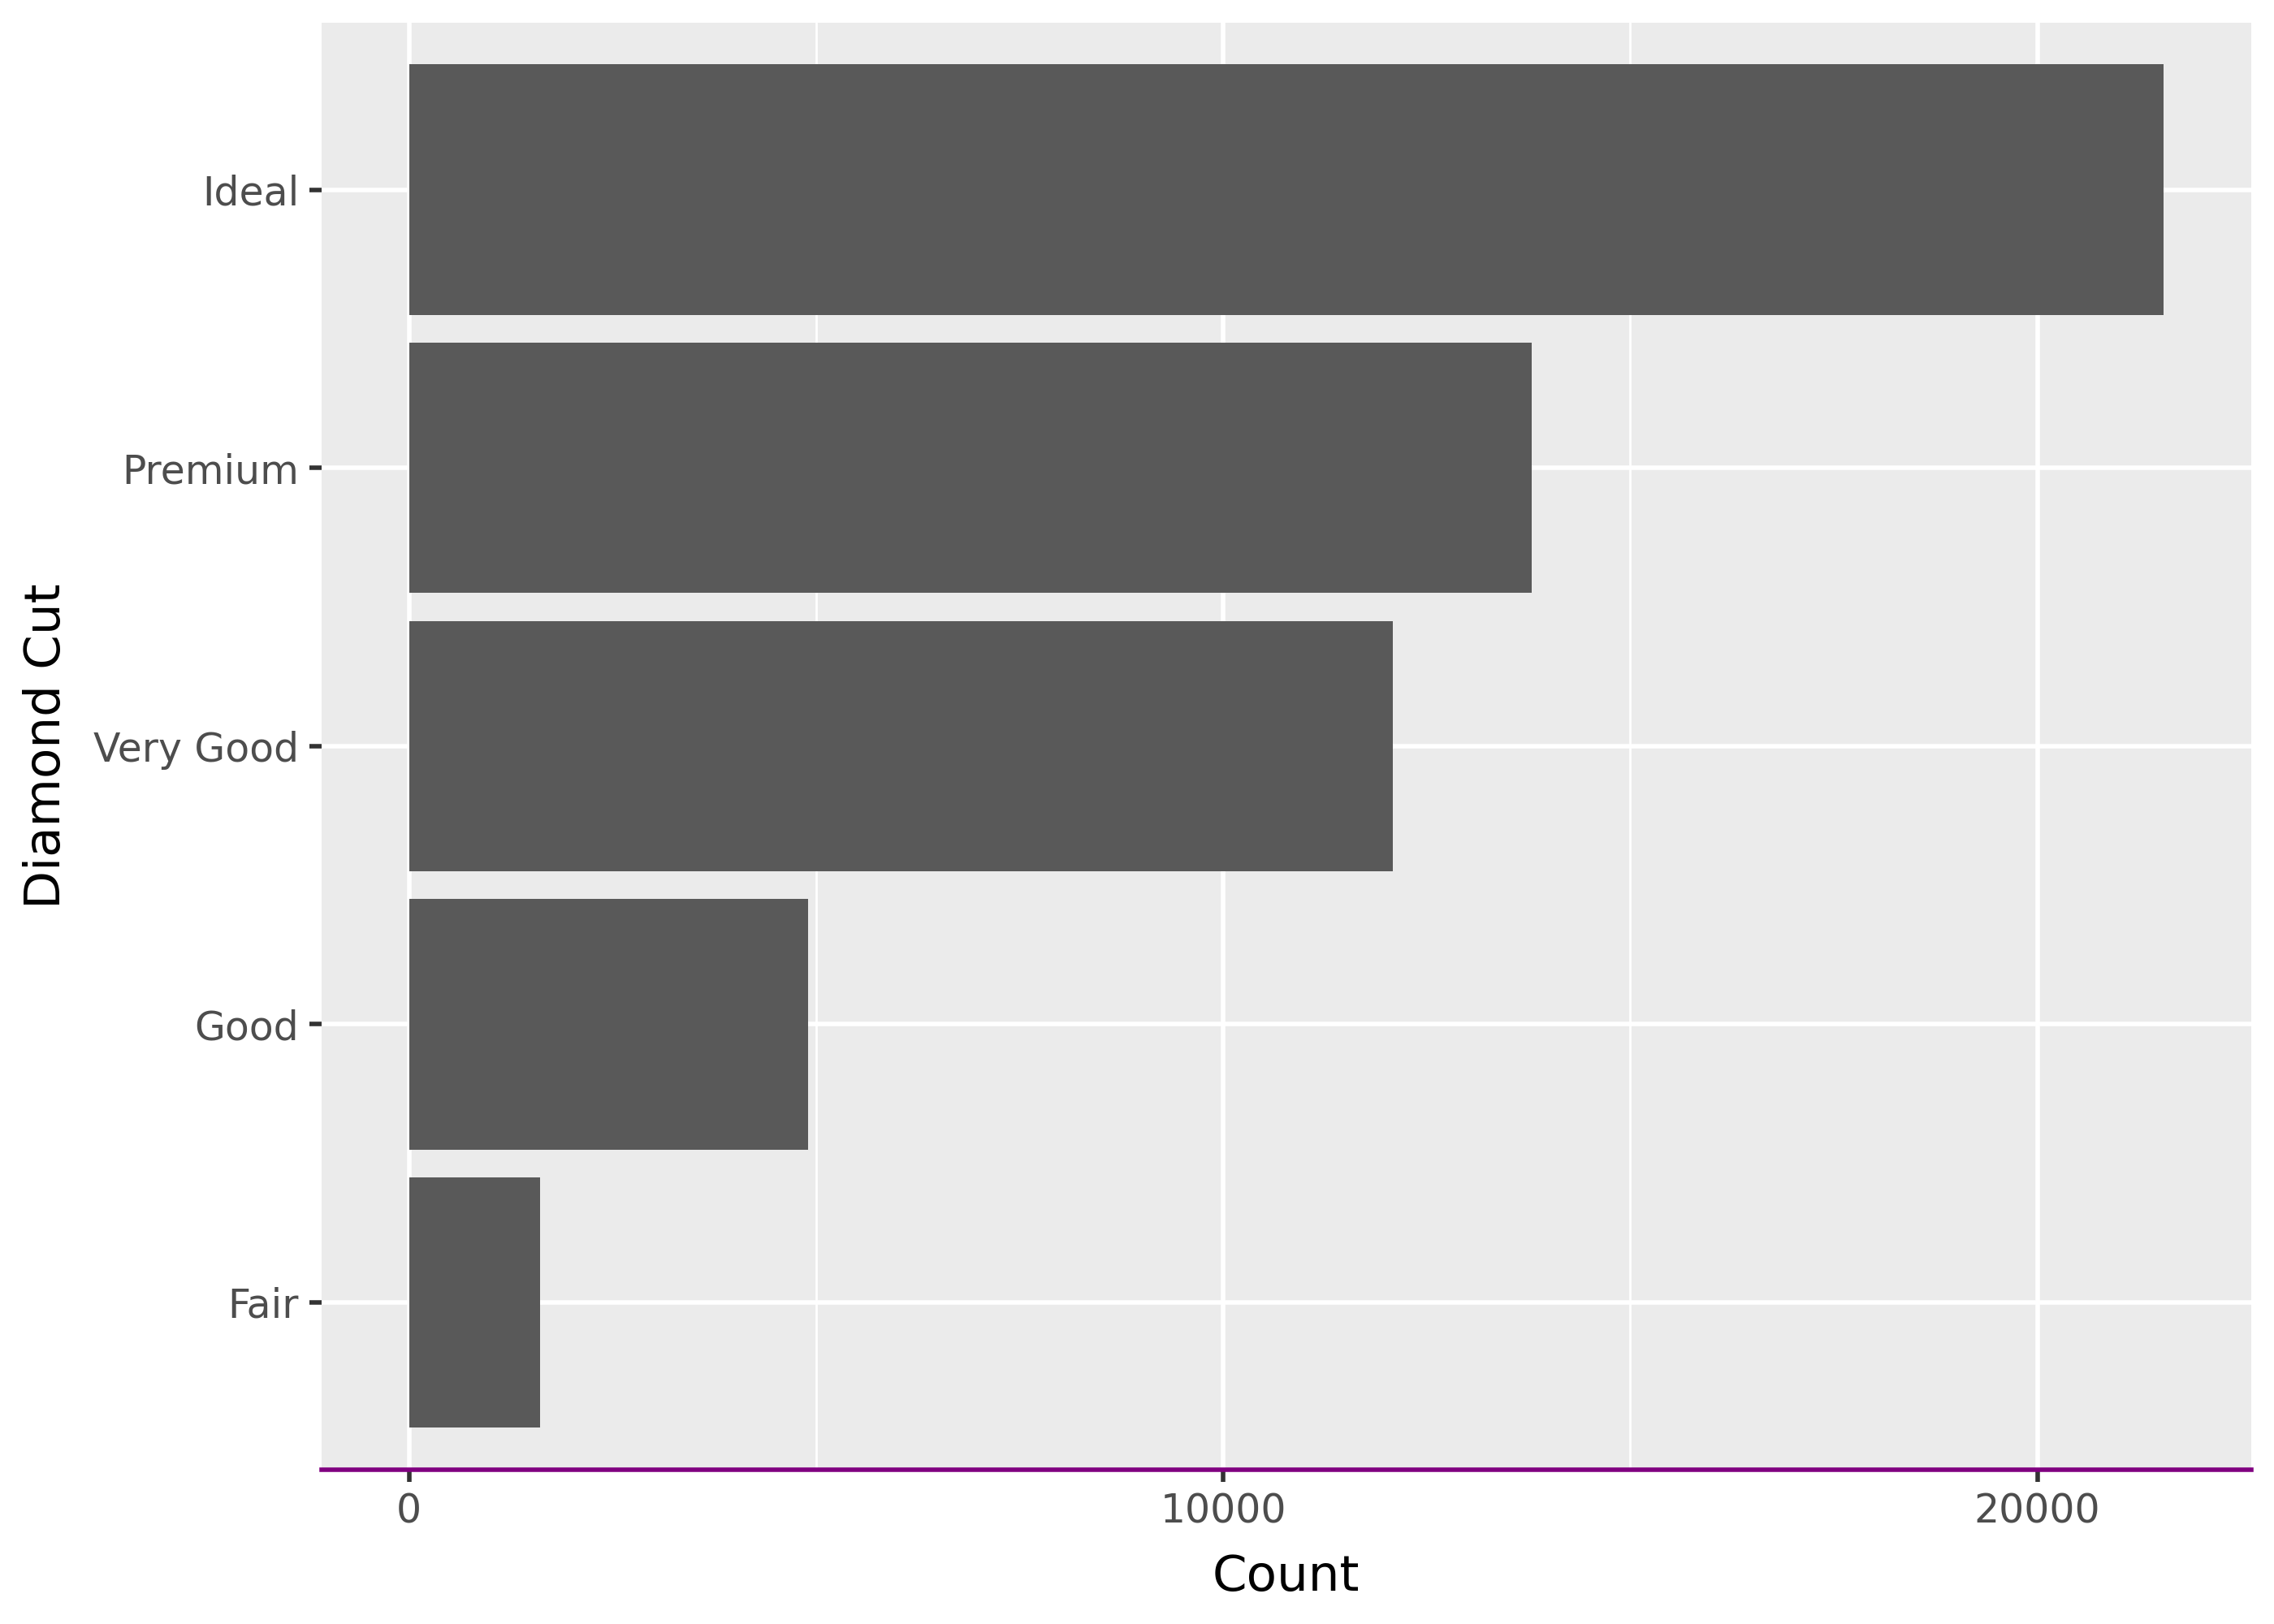
(
    ggplot(diamonds, aes("cut"))
    + geom_bar()
    + coord_flip()

    # labs and scales are based on original, non-flipped plot
    + labs(x="Diamond Cut", y="Count")
    + scale_y_continuous(breaks=[0, 10_000, 20_000])

    # theme options are based on the flipped plot
    + theme(axis_line_x=element_line(color="purple"))
)
coord_cartesian()
Use coord_cartesian() to zoom in on a plot.
p = ggplot(diamonds, aes("cut", "price")) + geom_boxplot()

p
p + coord_cartesian(ylim=[5000, None])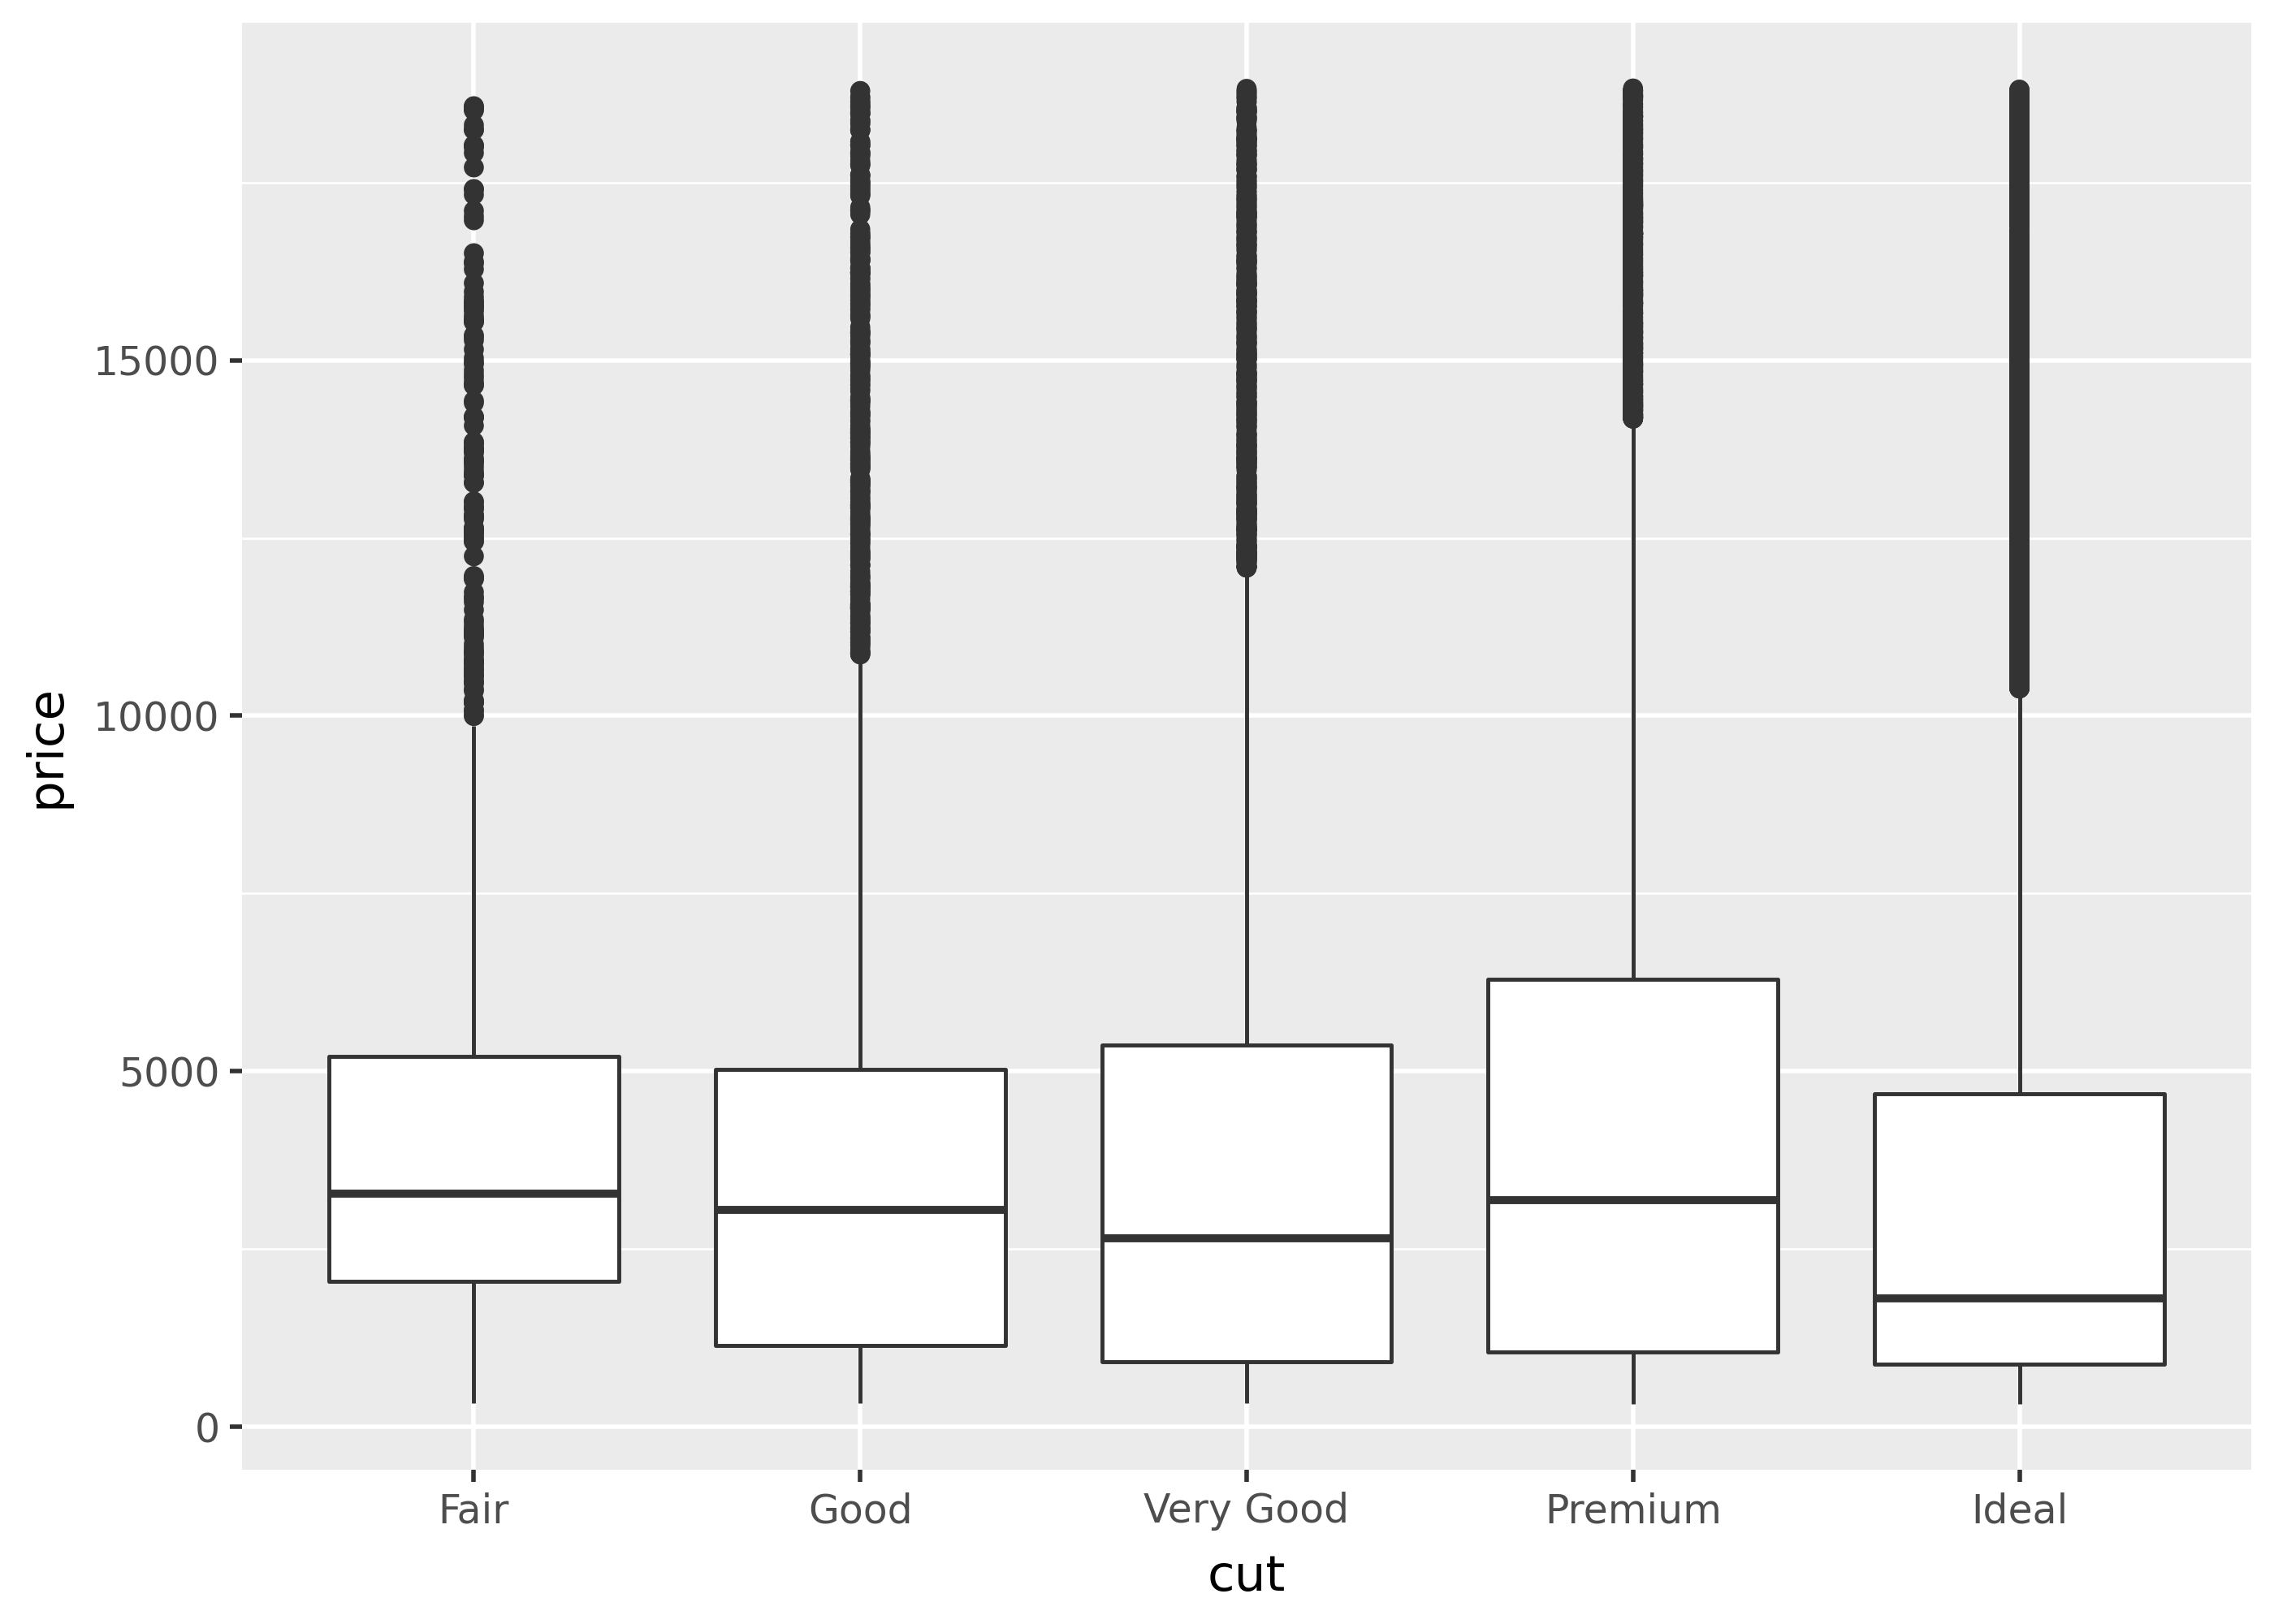
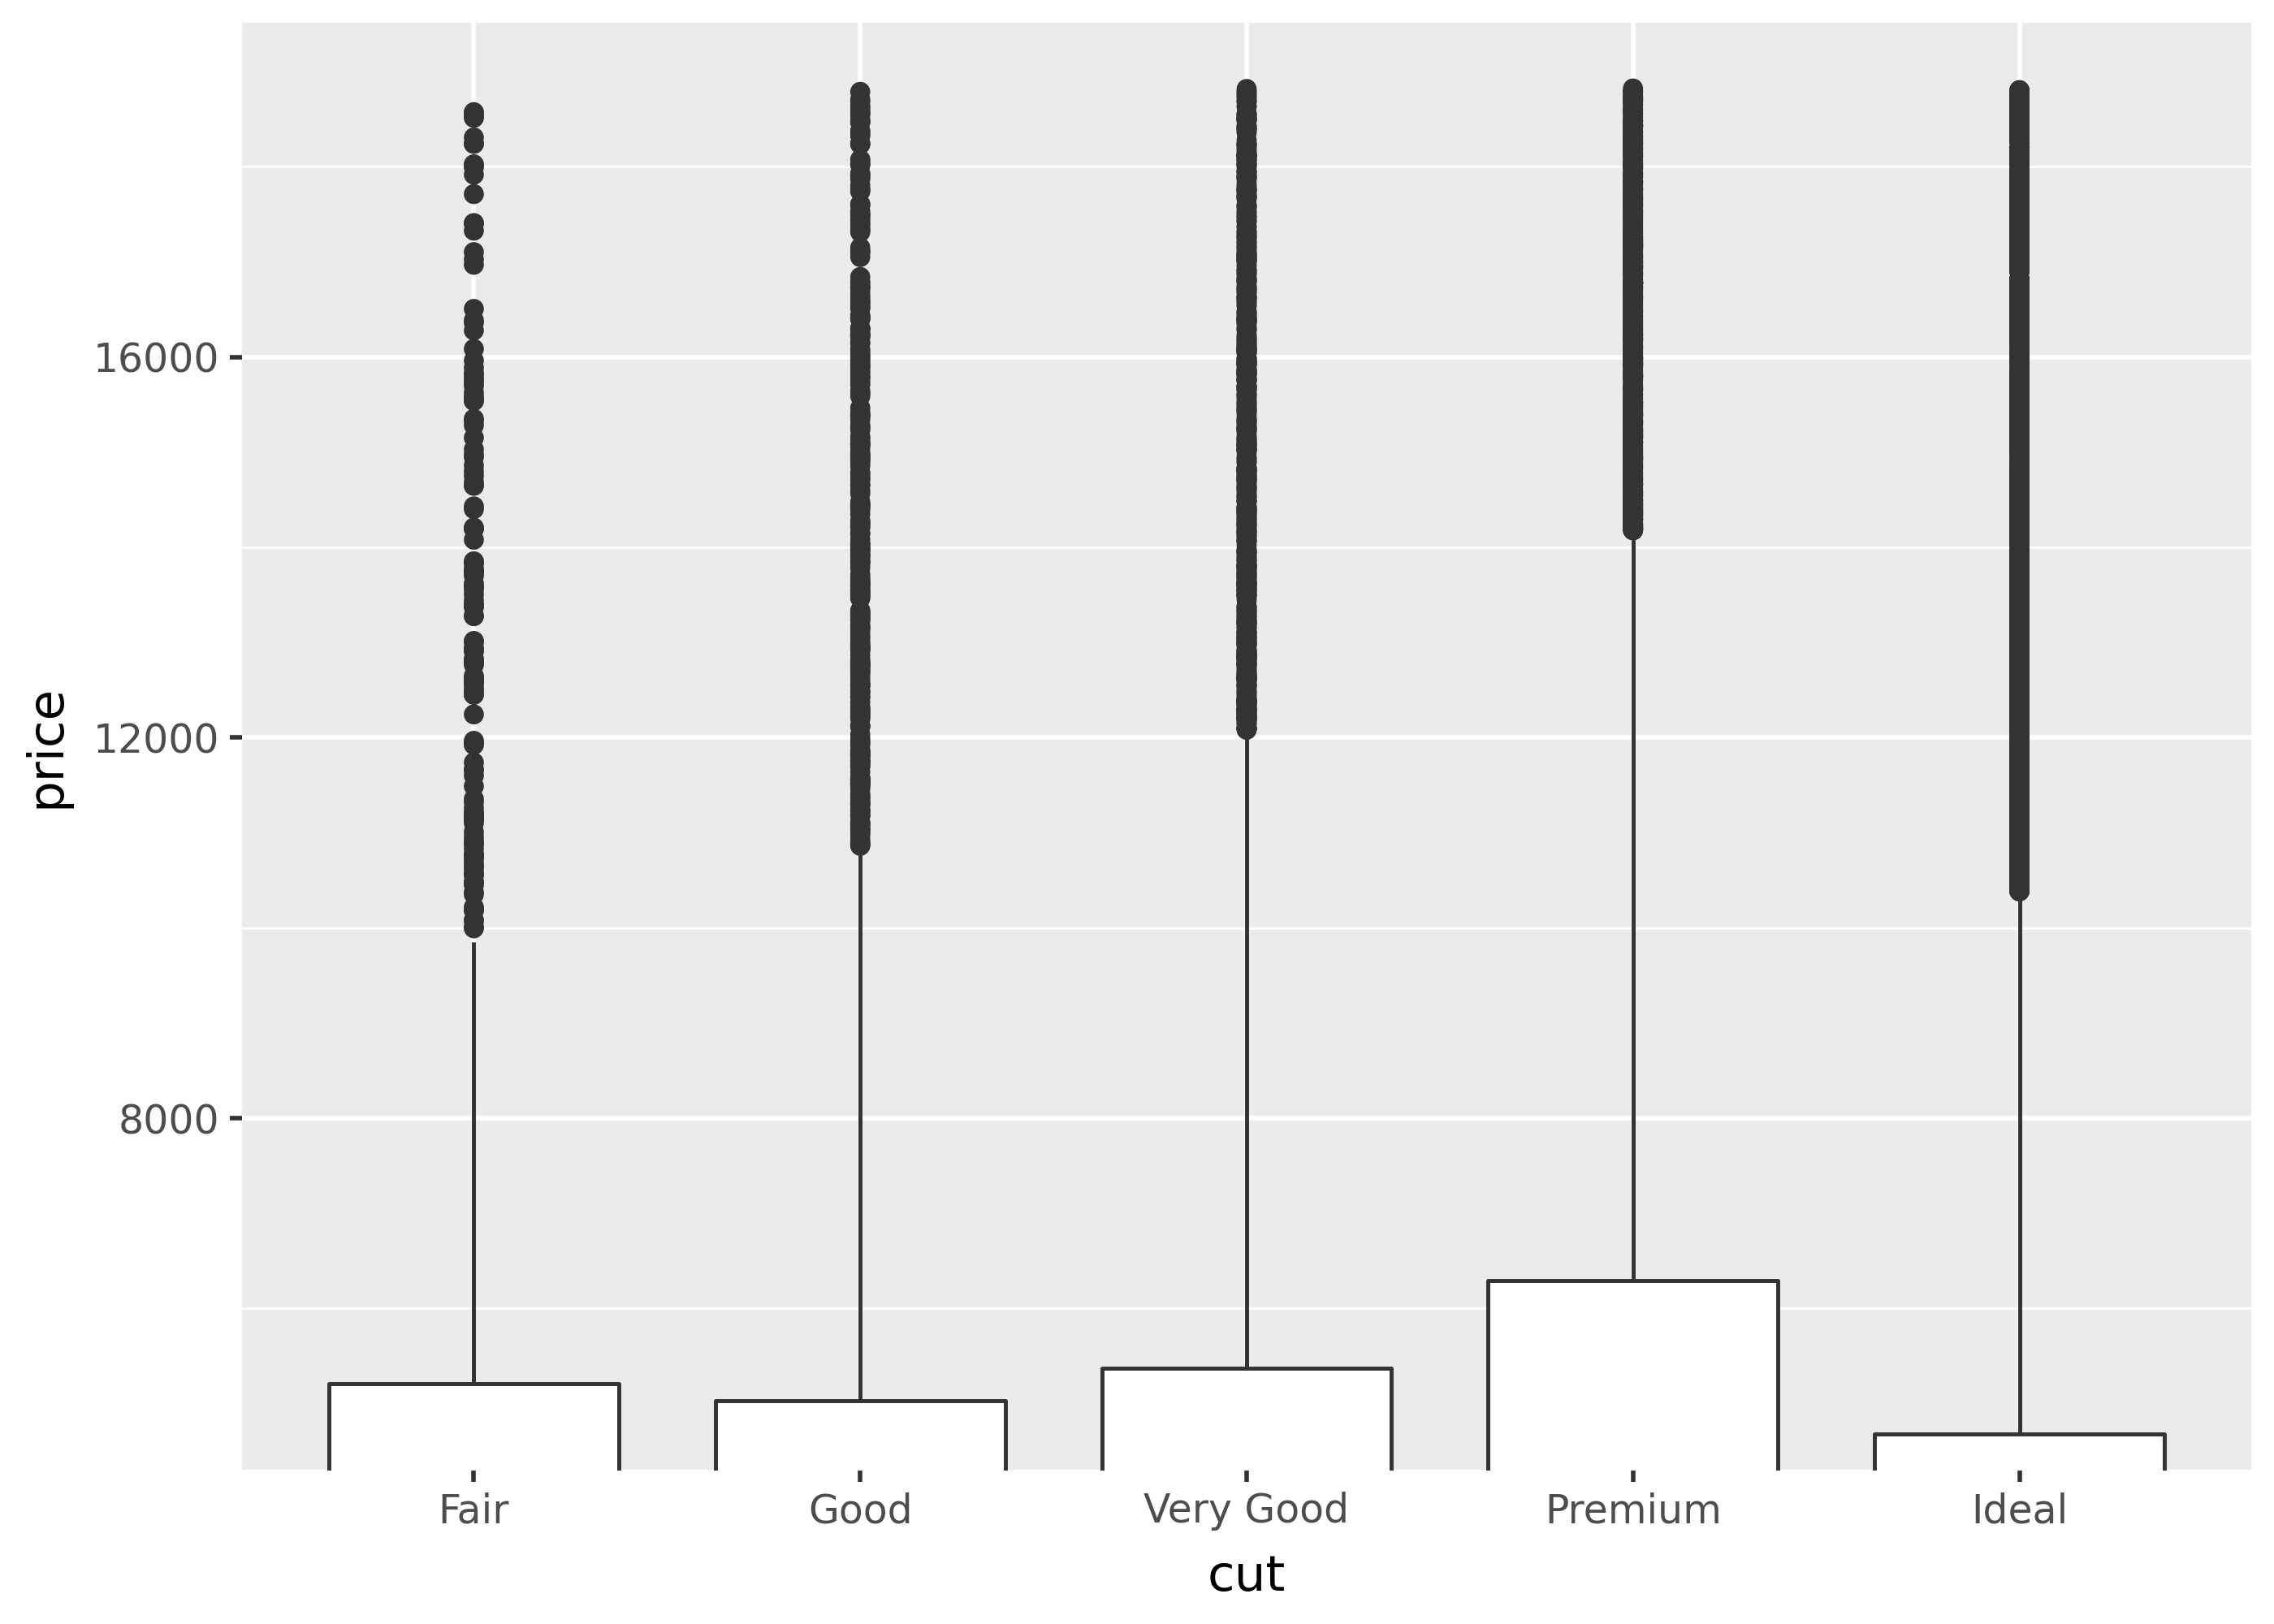
Notice that the second plot is zoomed in, so the y-axis starts at the top of the boxplots. Importantly, coord_cartesian() doesn’t affect any statistical calculations.
By contrast, setting limits in scales excludes any data outside those limits.
p + scale_y_continuous(limits=[5000, None])/home/runner/work/plotnine.org/plotnine.org/.venv/lib/python3.13/site-packages/plotnine/layer.py:293: PlotnineWarning: stat_boxplot : Removed 39213 rows containing non-finite values.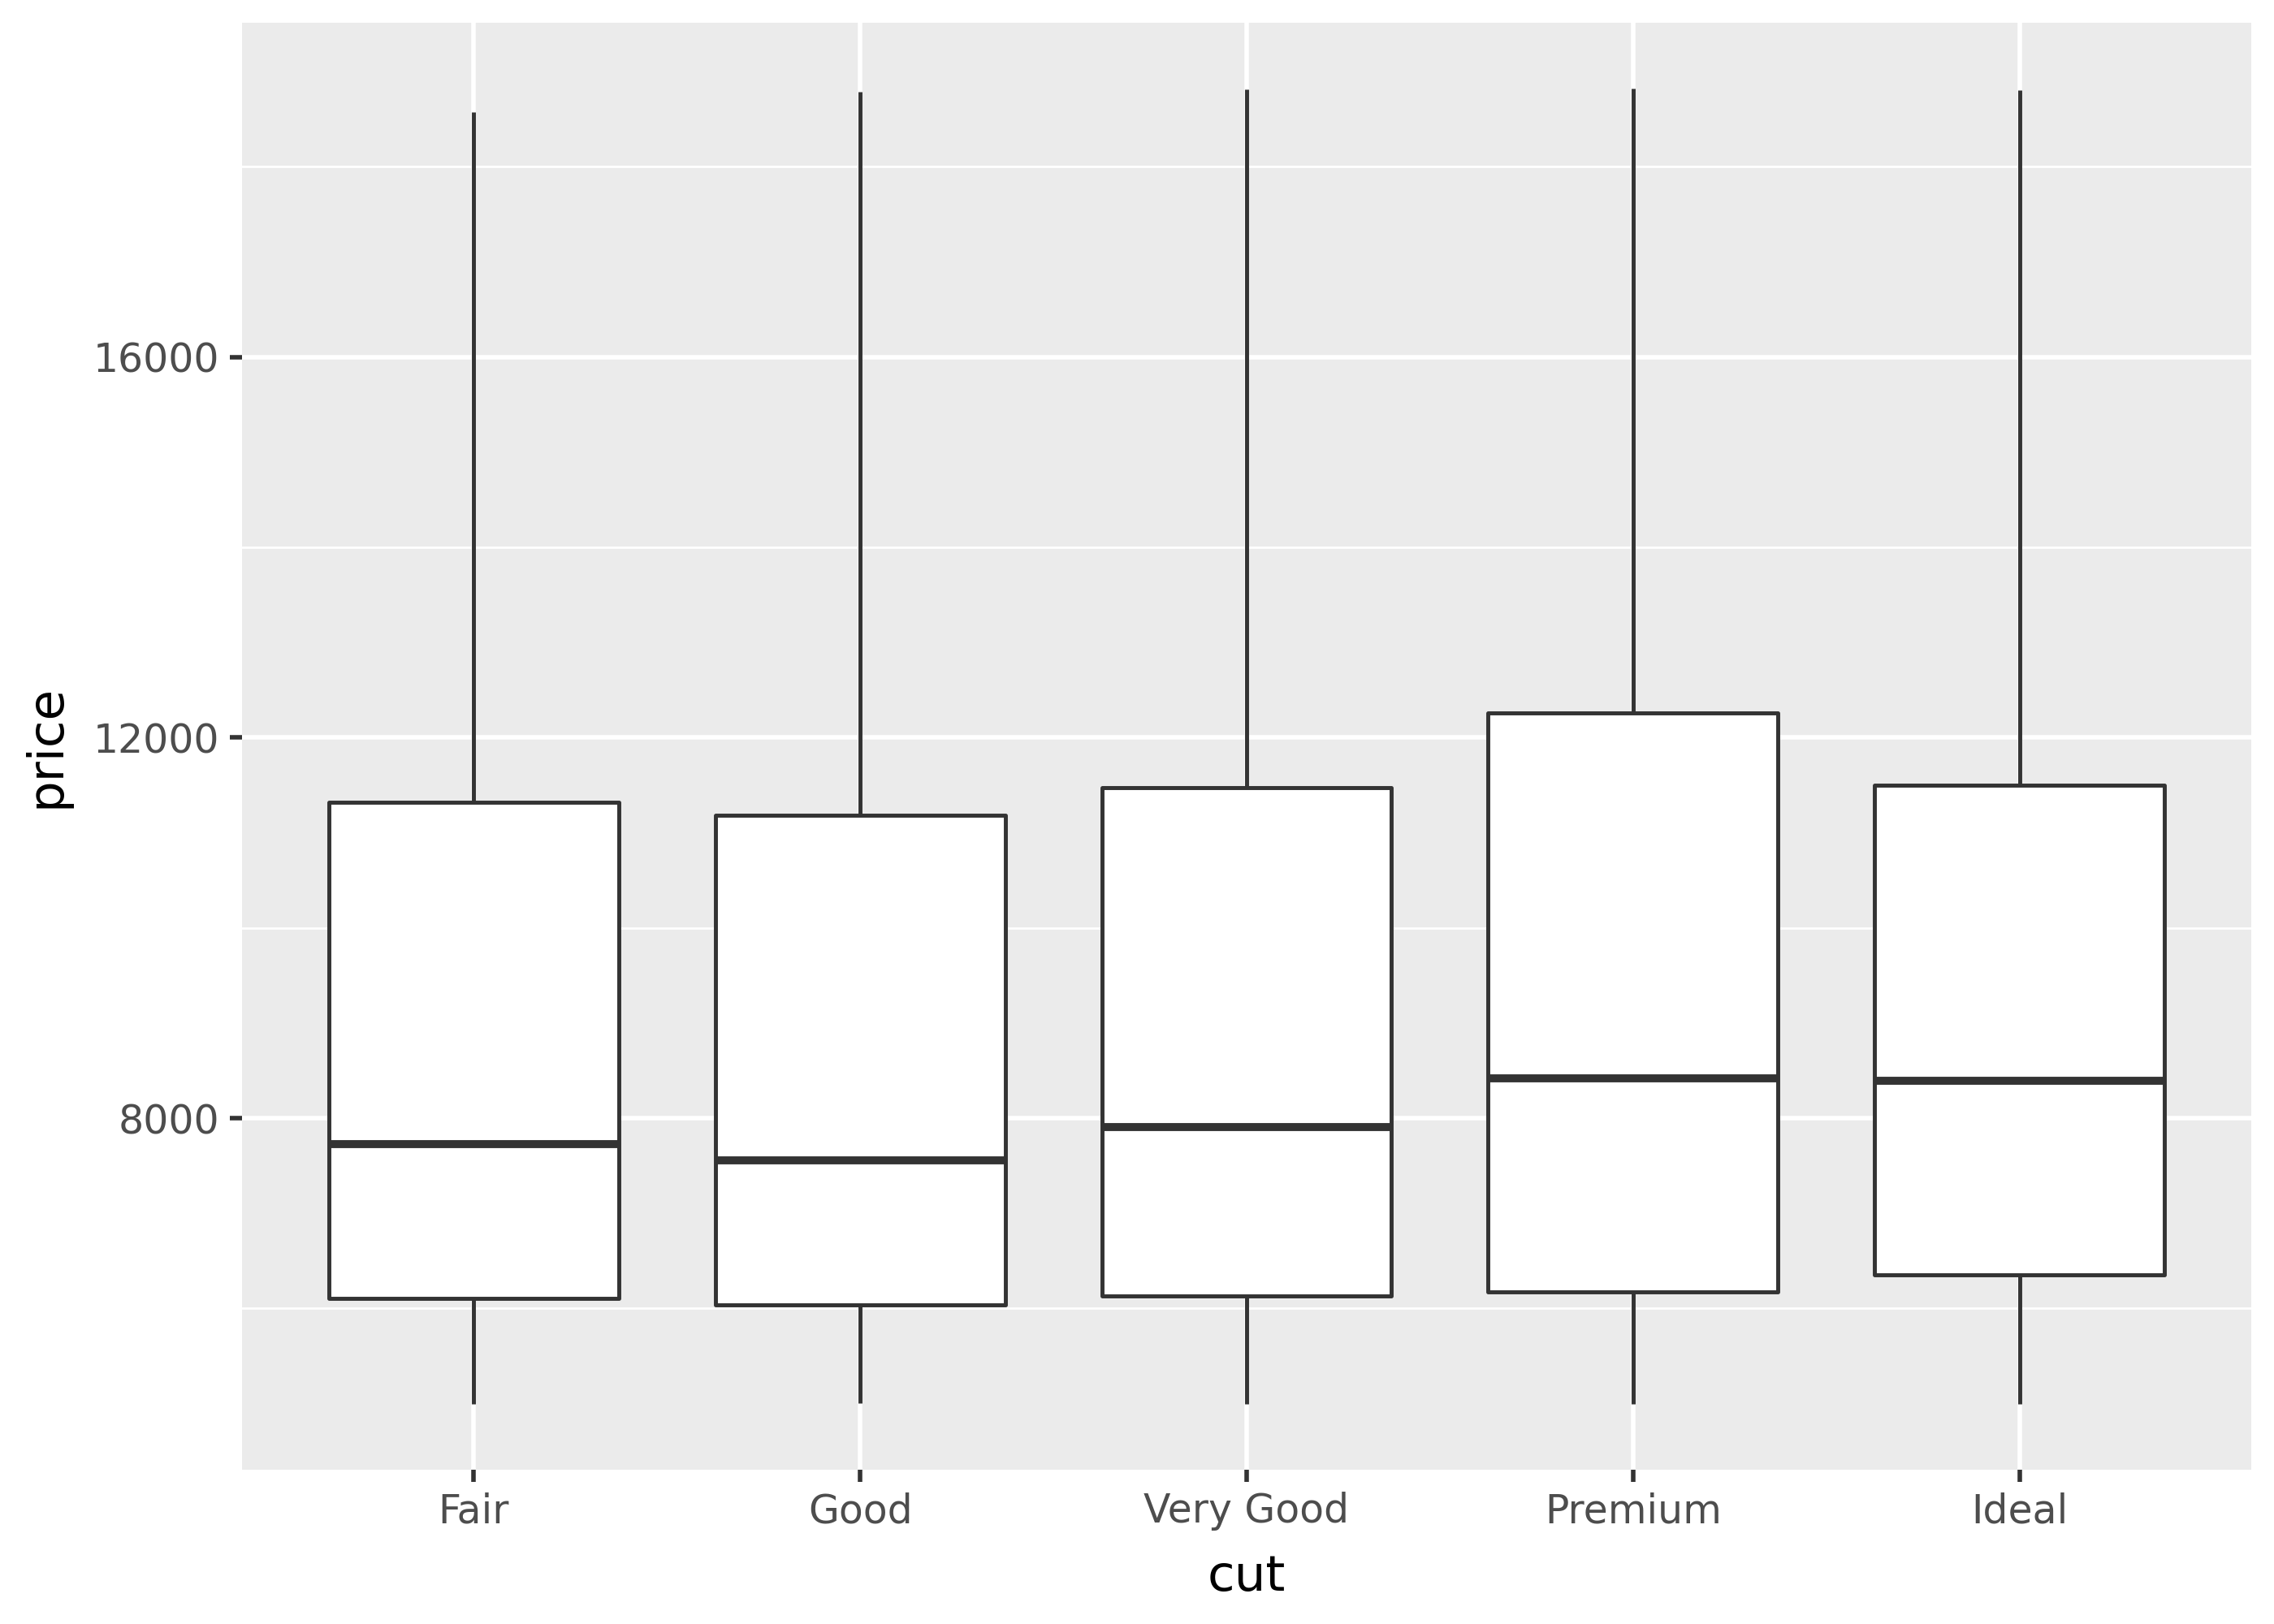
Notice that in the plot above, scale_y_continuous excluded y-values under 5,000 from being used in calculating the boxplot.
coord_fixed()
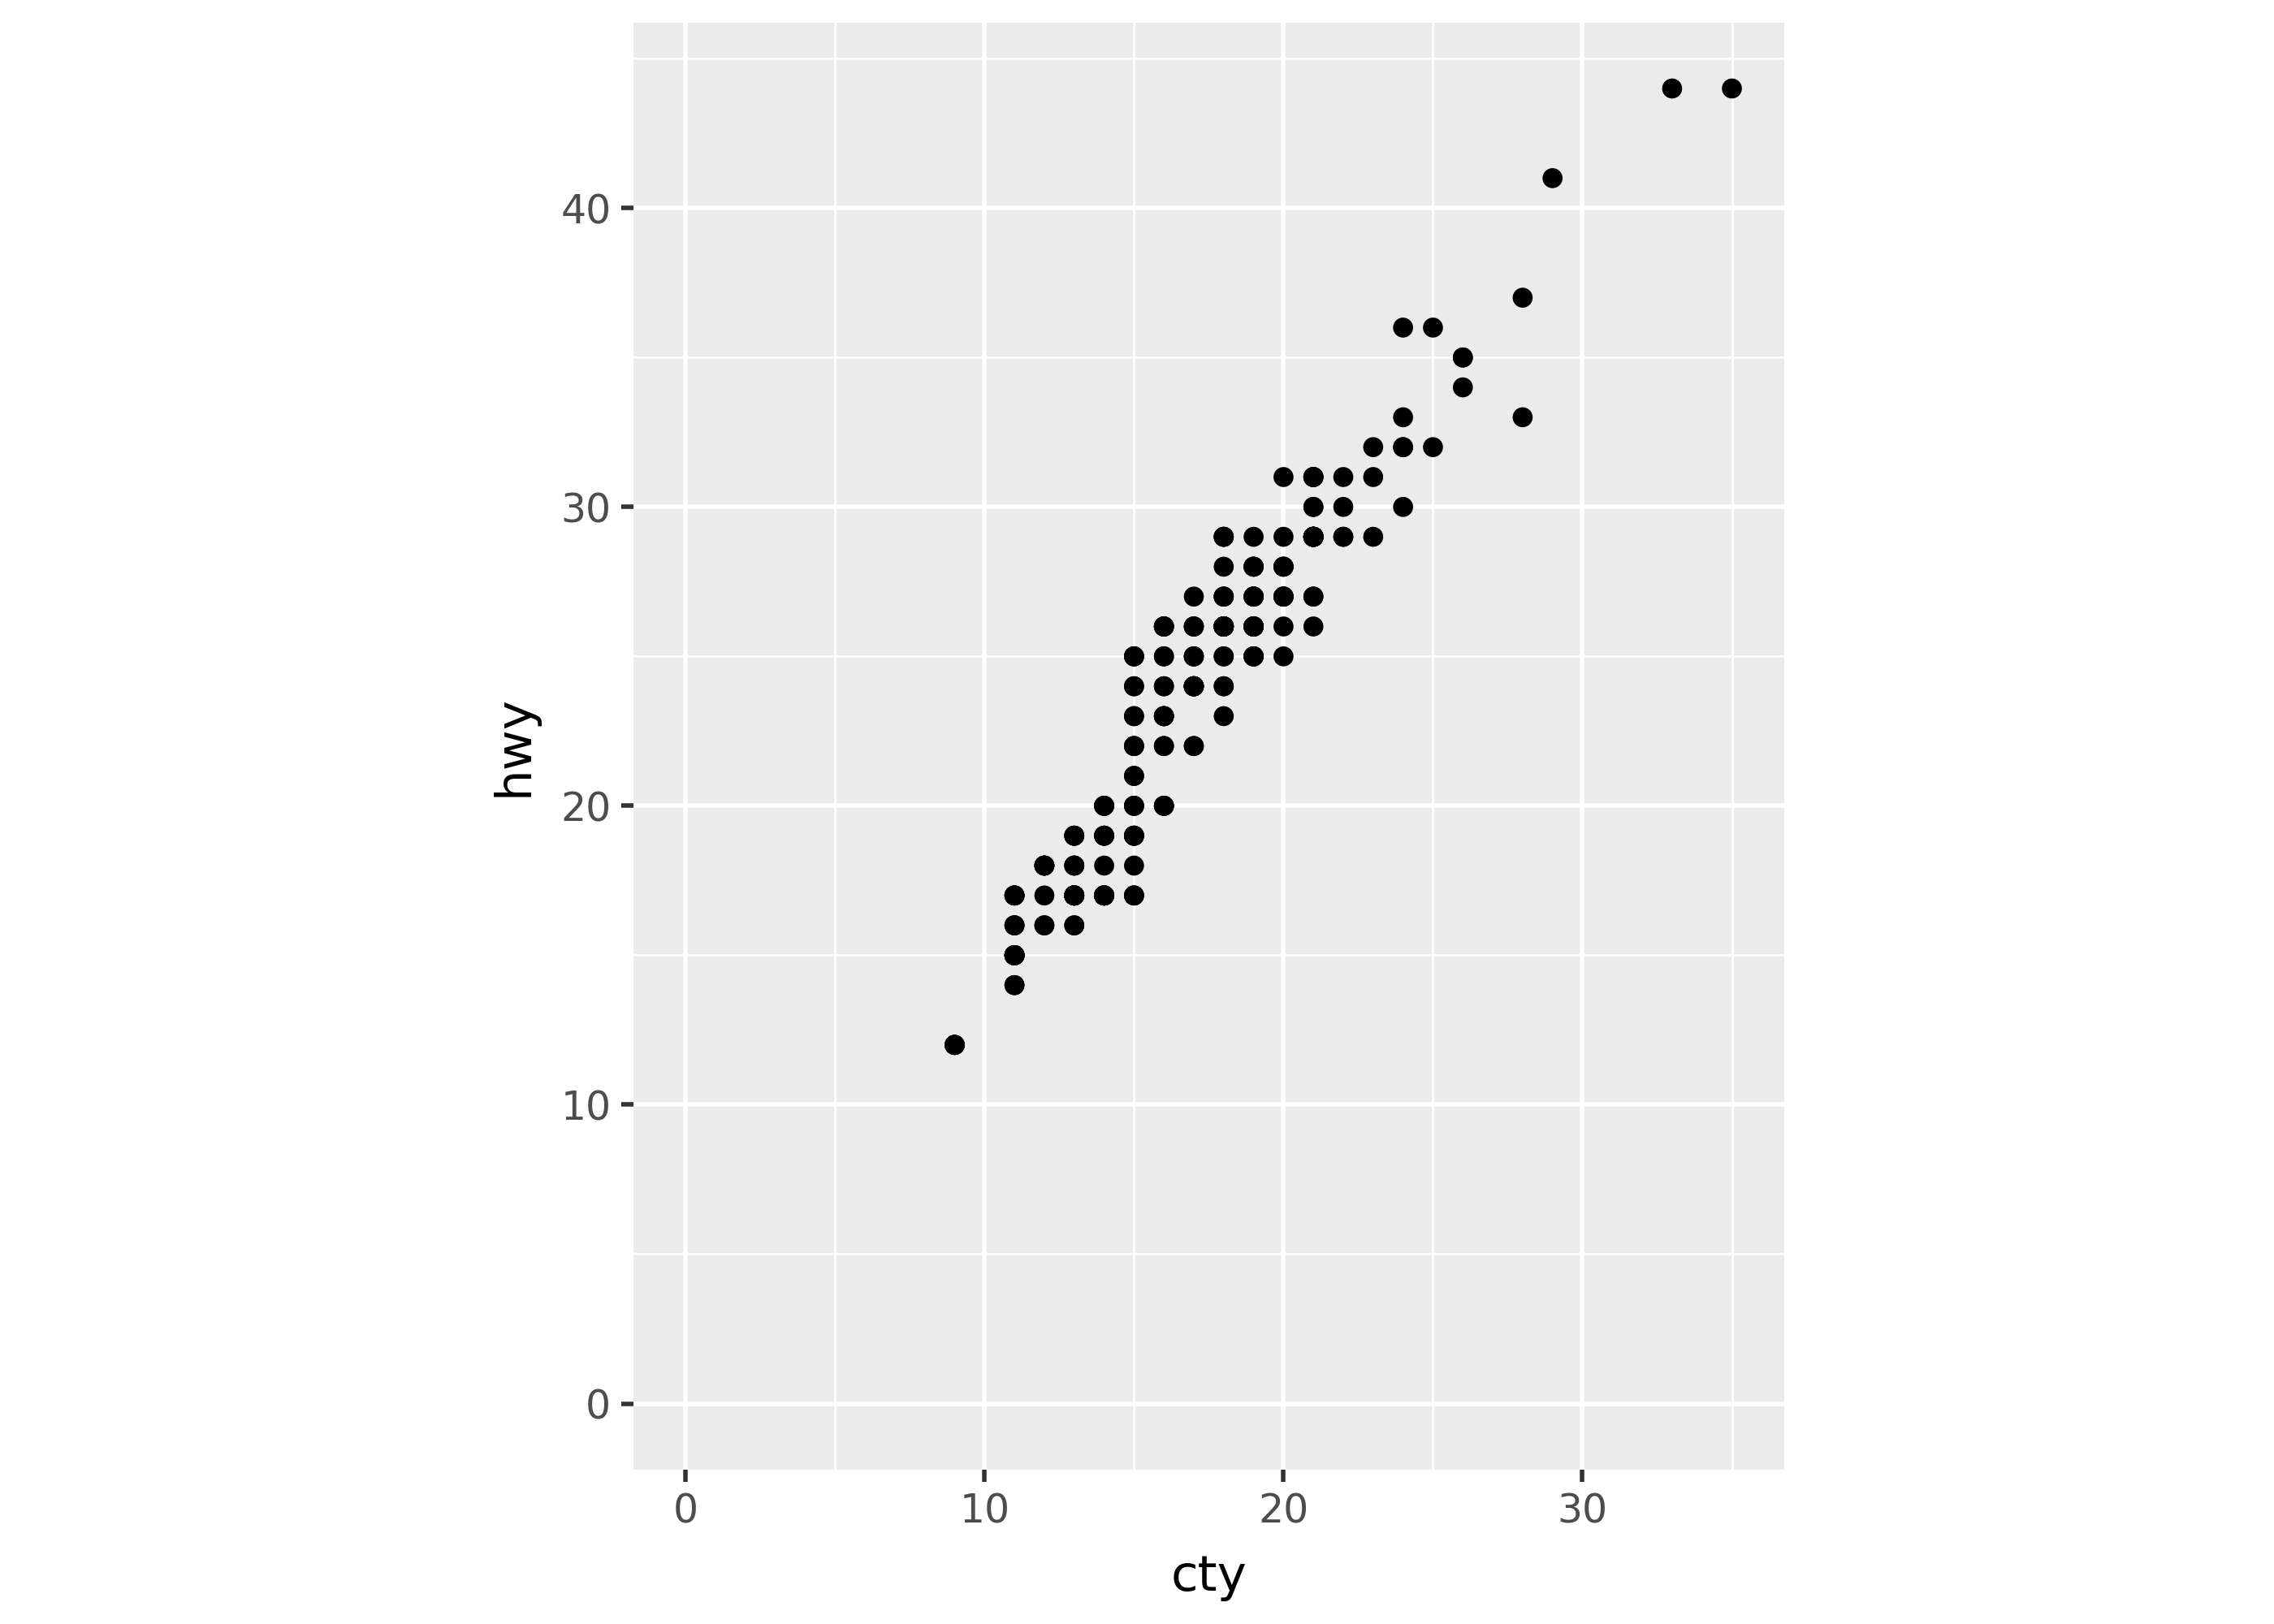
Use coord_fixed() to ensure the x- and y-axes have the same spacing.
(
    ggplot(mpg, aes("cty", "hwy"))
    + coord_fixed(xlim=[0, None], ylim=[0,None])
    + geom_point()
)
Cartographic maps
While currently not available as a coordinate system, Plotnine supports maps using geom_map(). In the future, maps will have a coord_map() function.
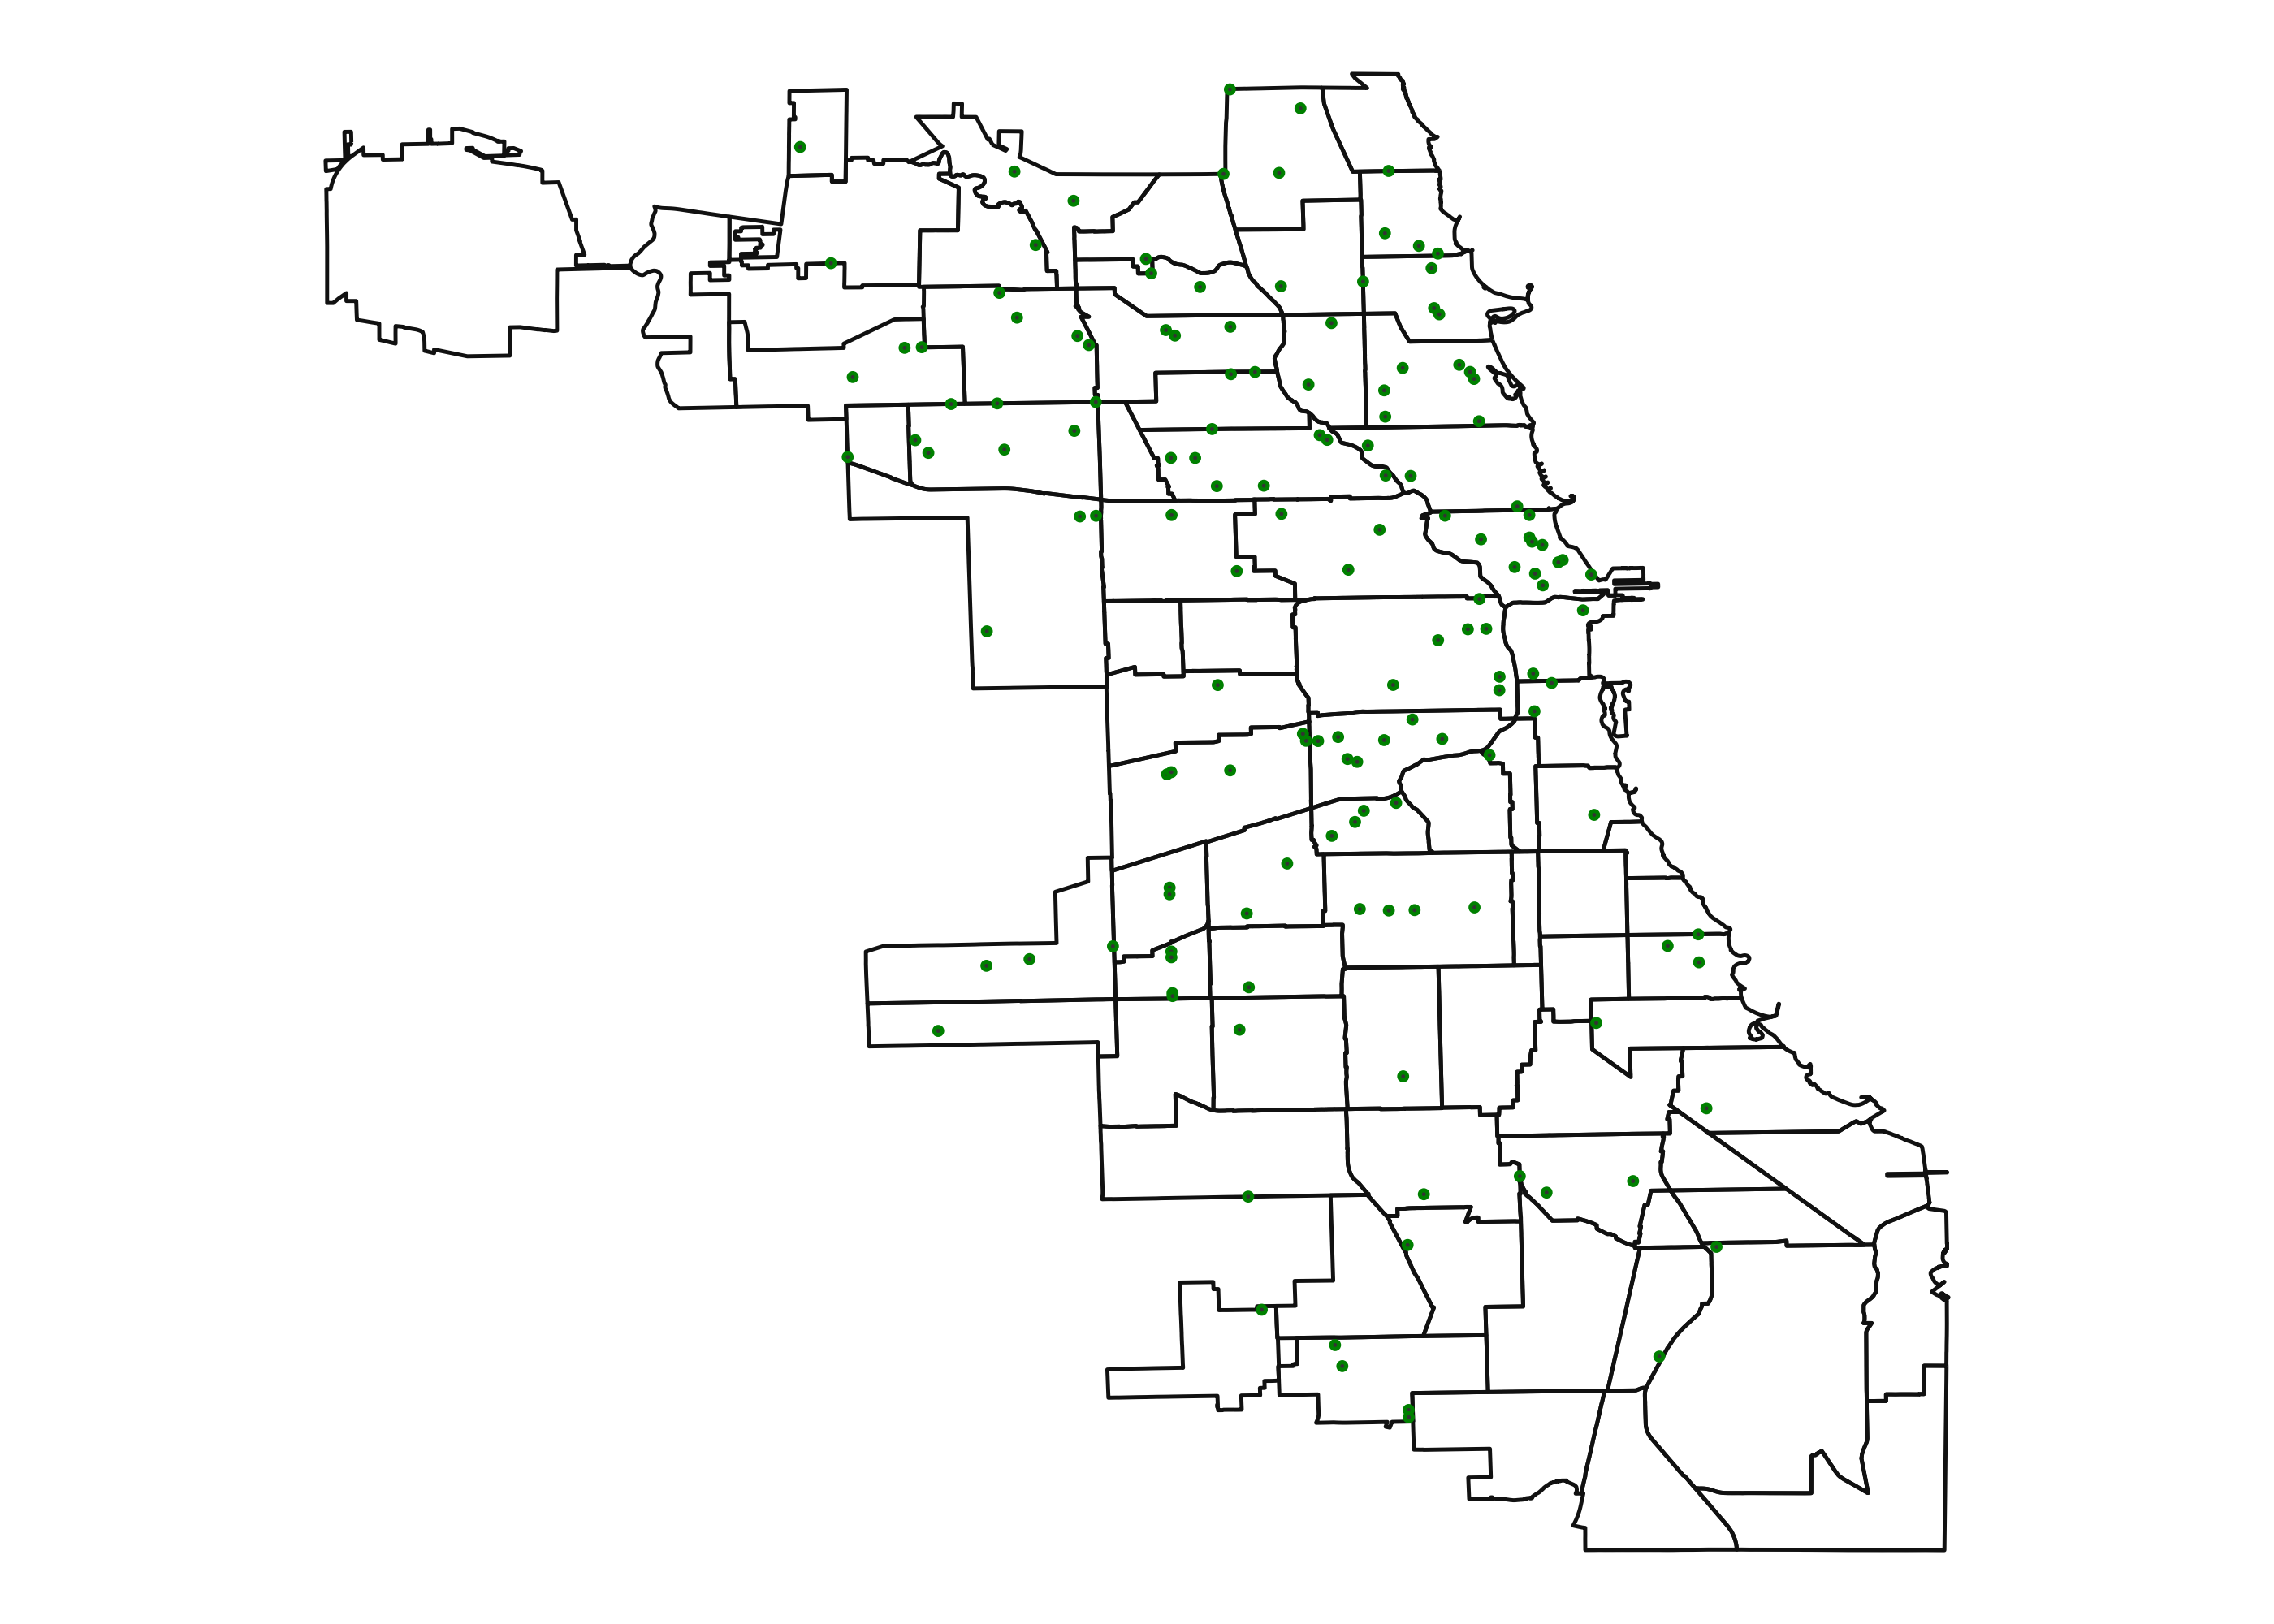
Here is an example which uses geopandas to plot grocery stores in Chicago.
import geopandas as gp
import geodatasets

chicago = gp.read_file(geodatasets.get_path("geoda.chicago_commpop"))
groceries = gp.read_file(geodatasets.get_path("geoda.groceries"))

(
    ggplot(chicago)
    + geom_map(fill=None)
    + theme_void()
    + coord_fixed()
)
Downloading file 'chicago_commpop.zip' from 'https://geodacenter.github.io/data-and-lab//data/chicago_commpop.zip' to '/home/runner/.cache/geodatasets'.
Extracting 'chicago_commpop/chicago_commpop.geojson' from '/home/runner/.cache/geodatasets/chicago_commpop.zip' to '/home/runner/.cache/geodatasets/chicago_commpop.zip.unzip'
Downloading file 'grocery.zip' from 'https://geodacenter.github.io/data-and-lab//data/grocery.zip' to '/home/runner/.cache/geodatasets'.
Extracting 'grocery/chicago_sup.shp' from '/home/runner/.cache/geodatasets/grocery.zip' to '/home/runner/.cache/geodatasets/grocery.zip.unzip'
Extracting 'grocery/chicago_sup.dbf' from '/home/runner/.cache/geodatasets/grocery.zip' to '/home/runner/.cache/geodatasets/grocery.zip.unzip'
Extracting 'grocery/chicago_sup.shx' from '/home/runner/.cache/geodatasets/grocery.zip' to '/home/runner/.cache/geodatasets/grocery.zip.unzip'
Extracting 'grocery/chicago_sup.prj' from '/home/runner/.cache/geodatasets/grocery.zip' to '/home/runner/.cache/geodatasets/grocery.zip.unzip'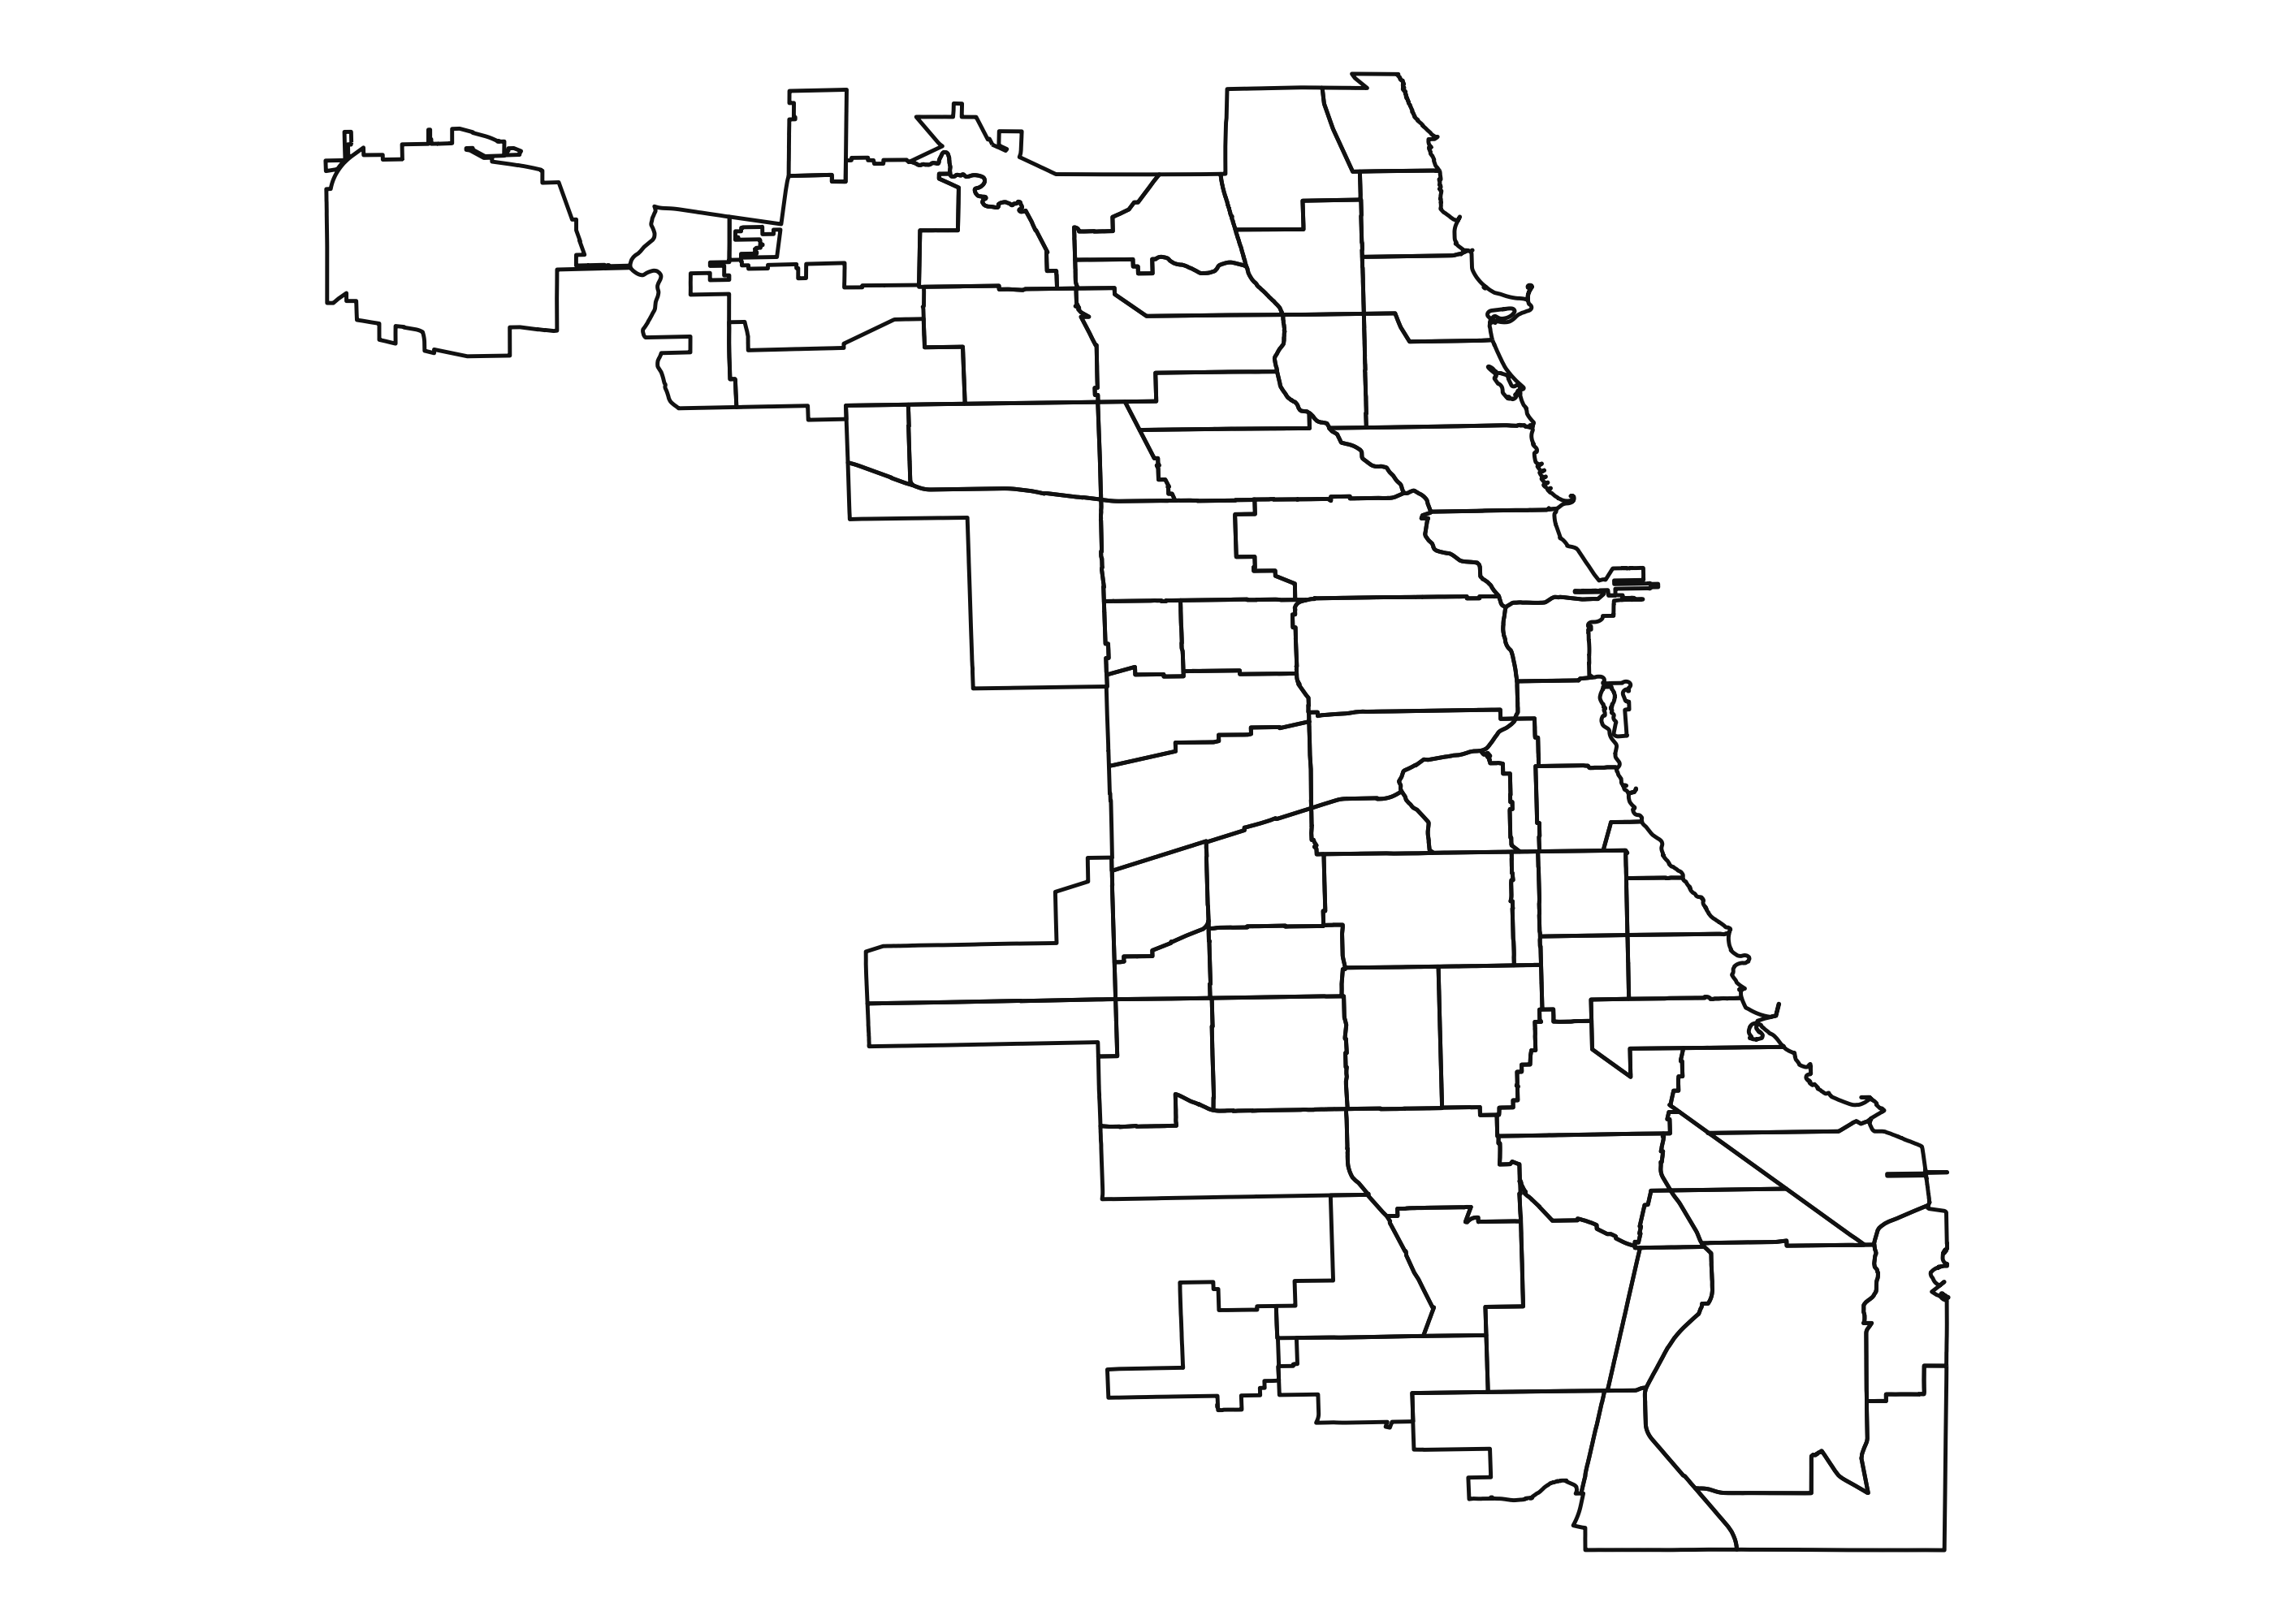
Notice that coord_fixed() was used to avoid stretching the map along the x- or y-axis. In addition, theme_void() removed the x- and y- tick marks, and labels.
You can plot multiple layers on the same map by using multiple geom_map() calls with different data= arguments.
crs_groceries = groceries.to_crs(chicago.crs)

(
    ggplot()
    + geom_map(data=chicago, fill=None)
    + geom_map(data=crs_groceries, color="green")
    + theme_void()
    + coord_fixed()
)