from plotnine import *
from plotnine.data import penguins

p = (
    ggplot(penguins, aes("flipper_length_mm", "body_mass_g", color="species"))
    + geom_point()
)Labels and titles
TipYou will learn
- How to categorize the three kinds of labels in a plot.
- How to set each kind of label.
- How to style labels (e.g. with color).
NoteKey points
- The three kinds of labels are plot labels, guide labels, and scale break labels.
- The
labs()function quickly sets plot labels and guide names. - The
scale_*()functions can set scale break labels. - The
theme()function can style labels, by changing their color, size, or more.
Setup
Three kinds of labels
Here is a plot, with the three kinds of labels marked.
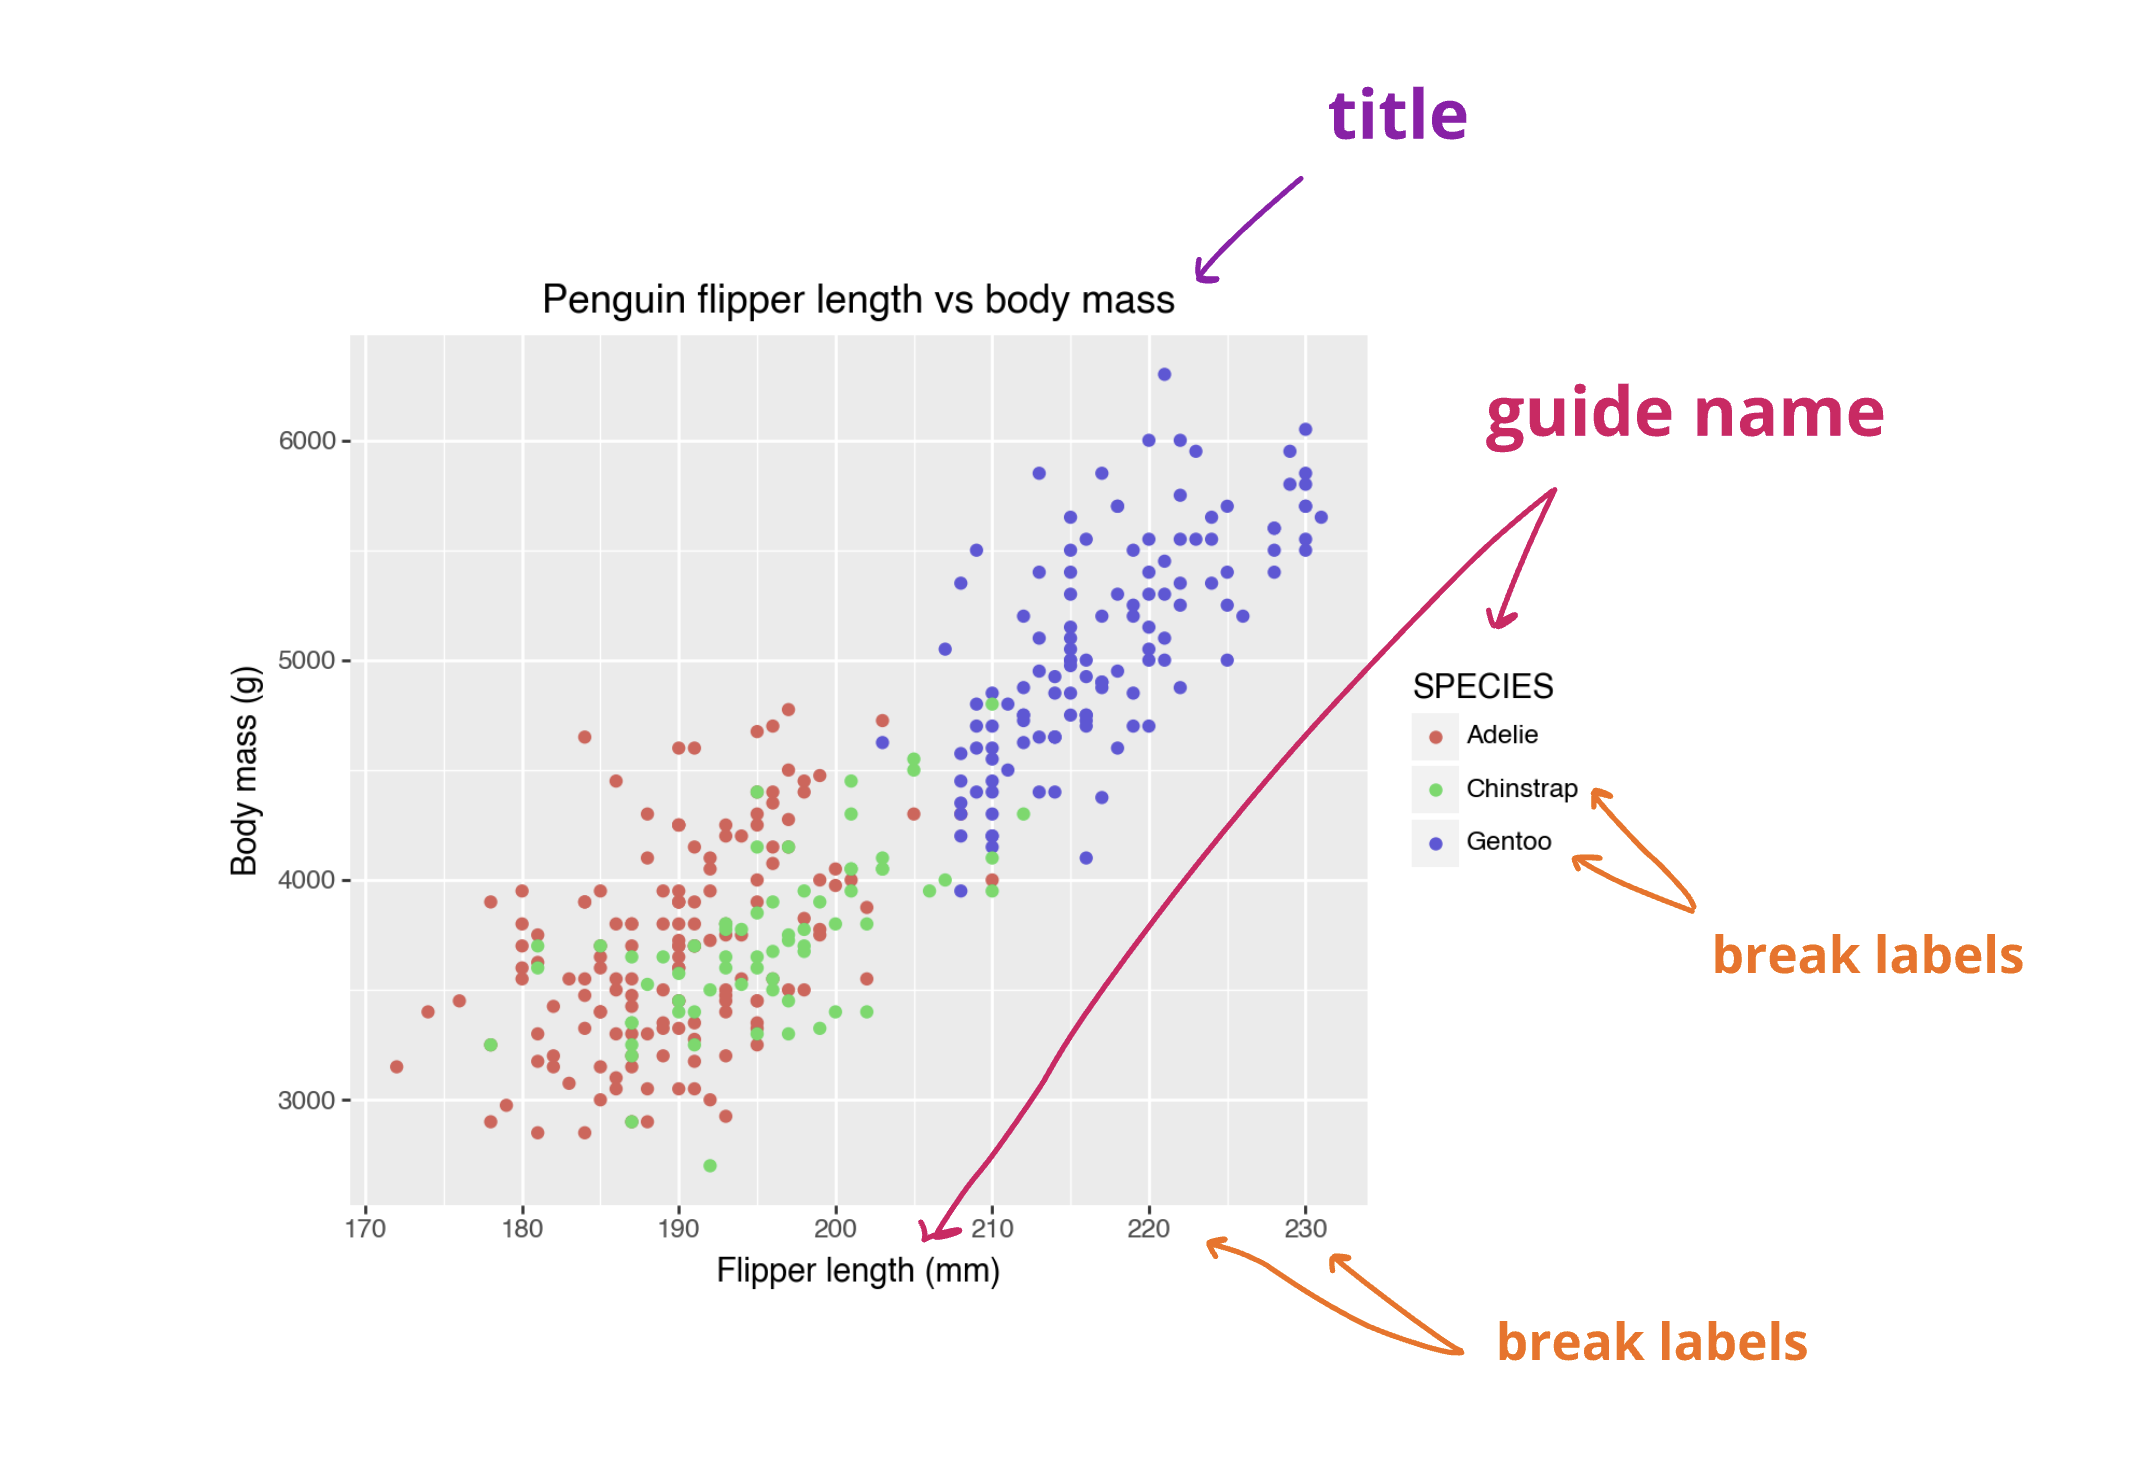
- Plot labels: titles, subtitles, captions. (Shown in purple).
- Guide names: axis labels, legend titles. (Shown in red).
- Scale breaks: tick labels, color glyph labels. (Shown in orange).
In the following sections, we’ll cover how the first two kinds of labels can quickly be set with the labs() function, and how scale breaks can be labeled using scale_*() functions.
Labelling quickly with labs()
Use the labs() function to quickly set plot labels and guide names.
p + labs(
    title="Penguin flipper length vs body mass",
    x="Flipper length (mm)",
    y="Body mass (g)",
    color="SPECIES",
)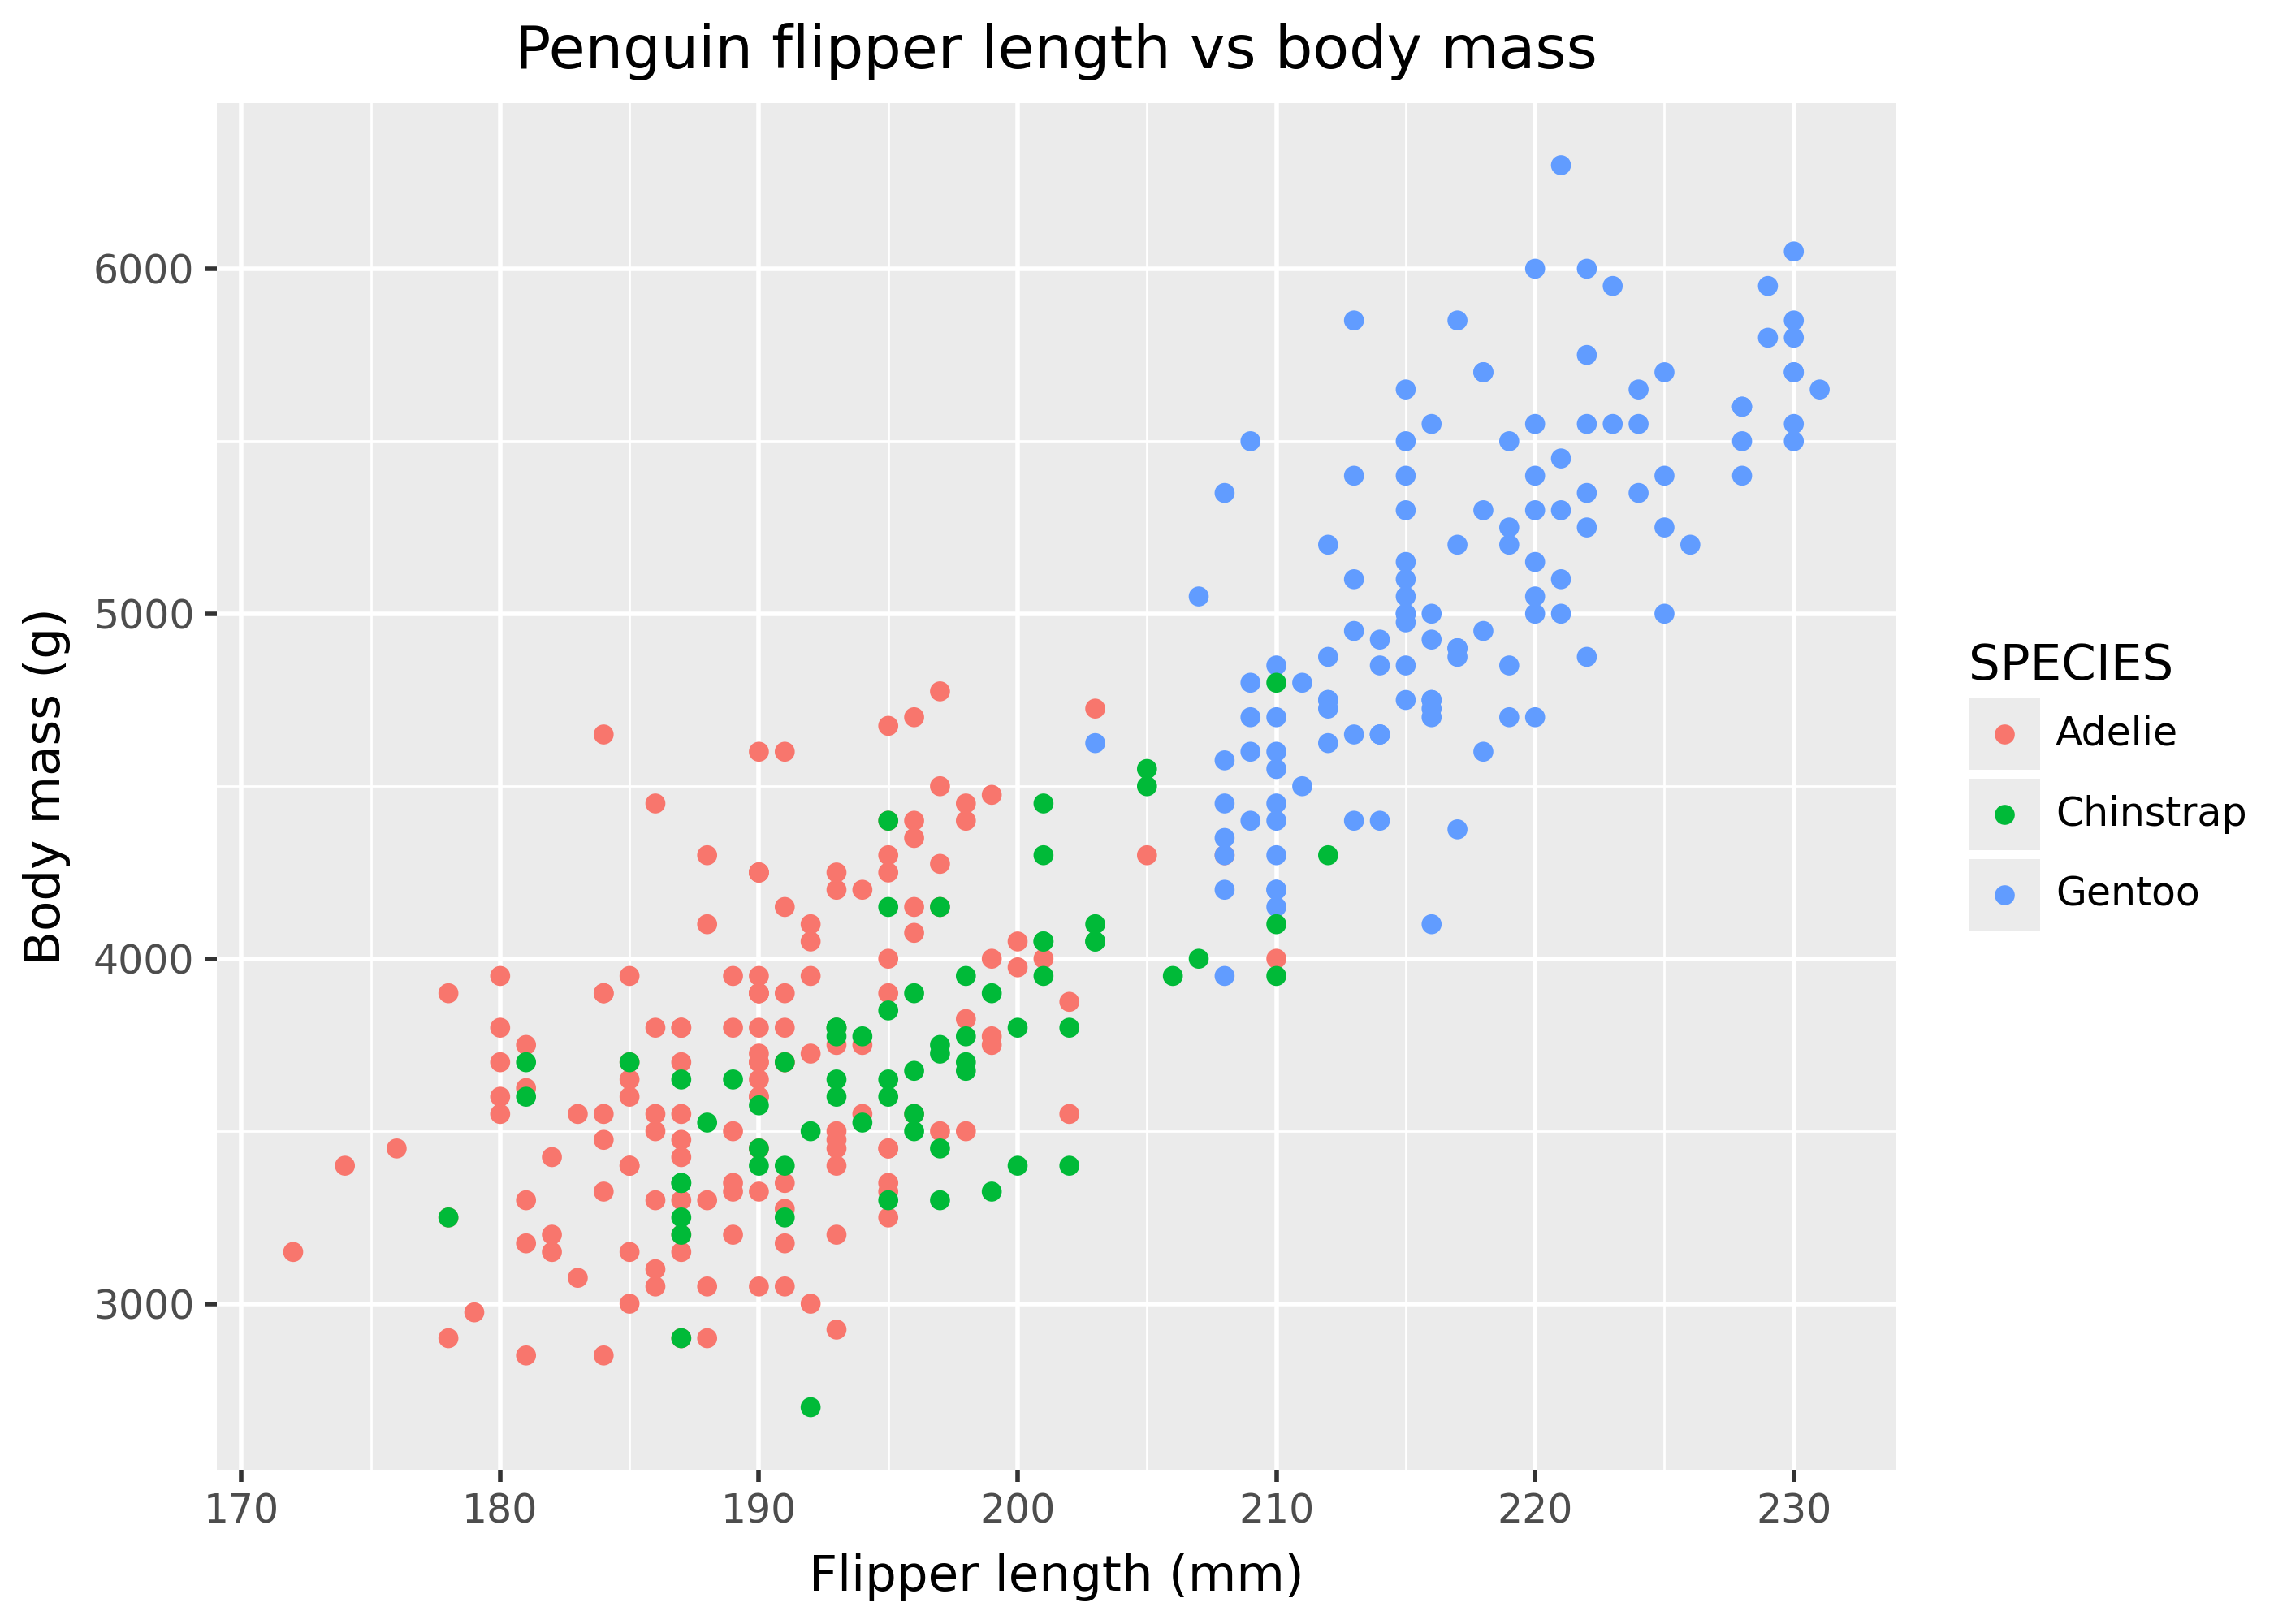
Notice that the only piece it can’t set is the break labels (e.g. the x-axis tick labels), which is often enough for most plots.
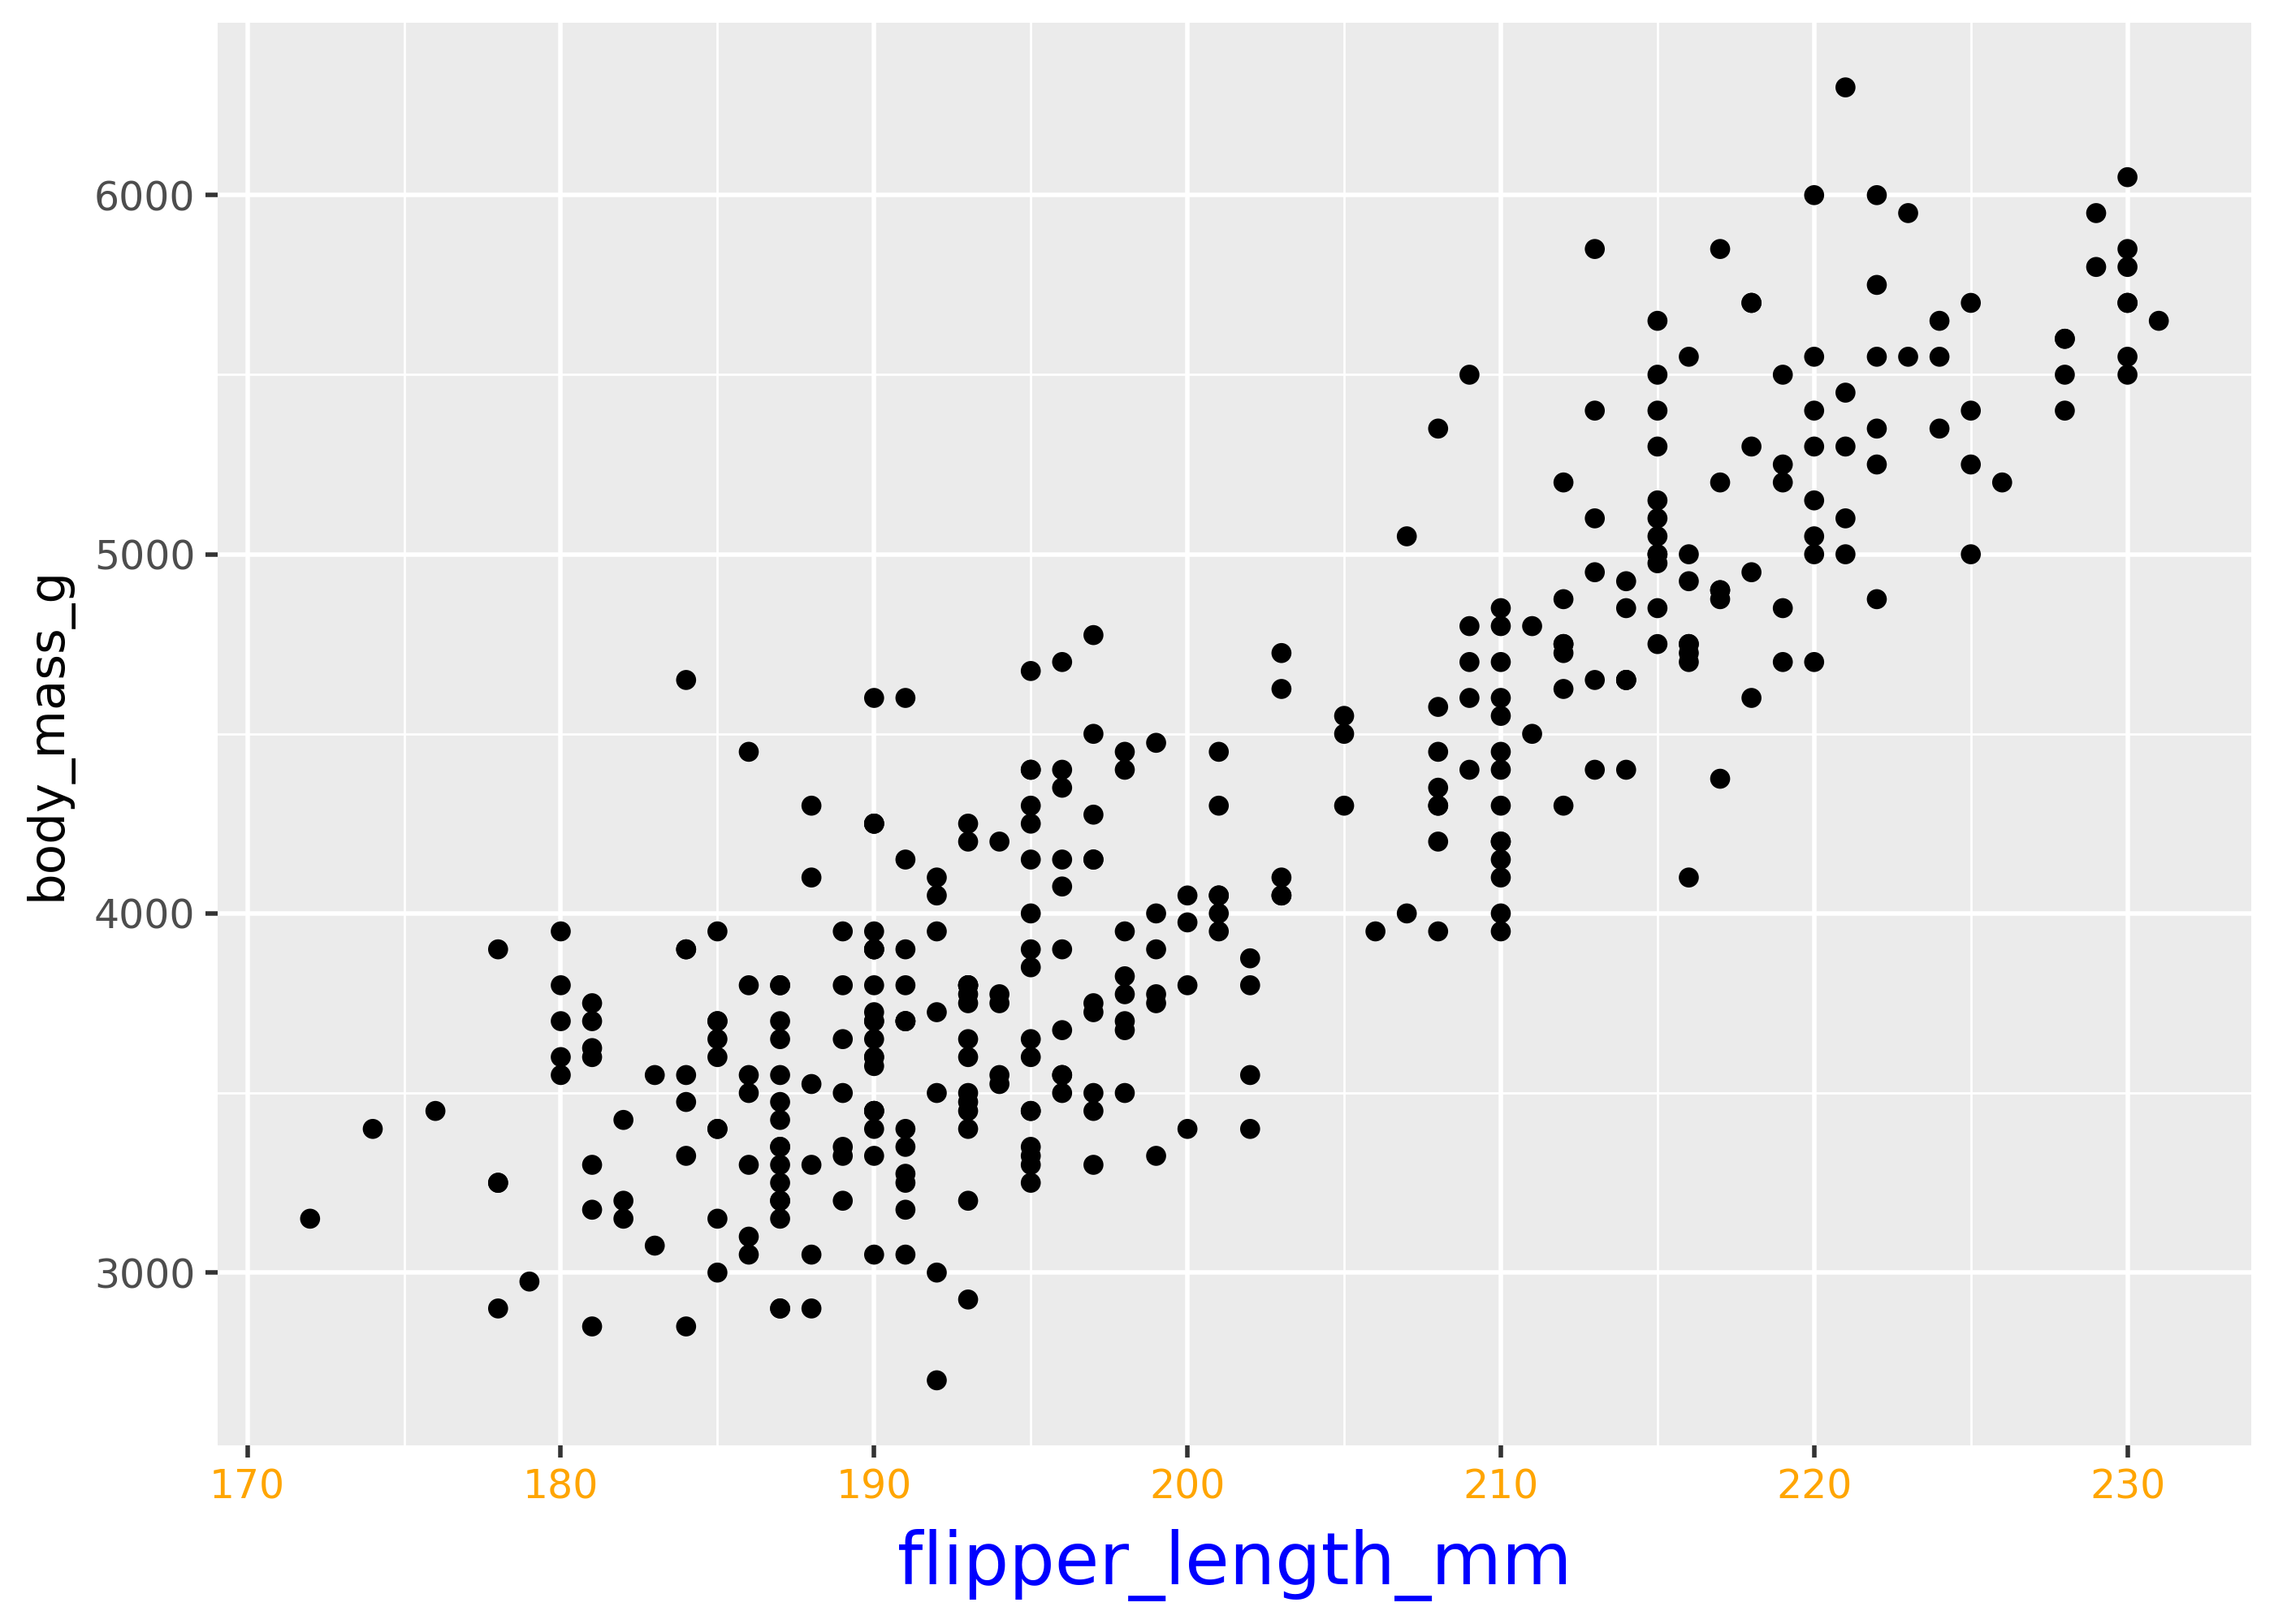
Styling labels with theme()
Use the theme() function to style labels. For example, by changing their color or size.
(
    ggplot(penguins, aes("flipper_length_mm", "body_mass_g"))
    + geom_point()
    + theme(
        axis_text_x=element_text(color="orange"),
        axis_title_x=element_text(color="blue", size=16),
    )
)
Scale breaks labels
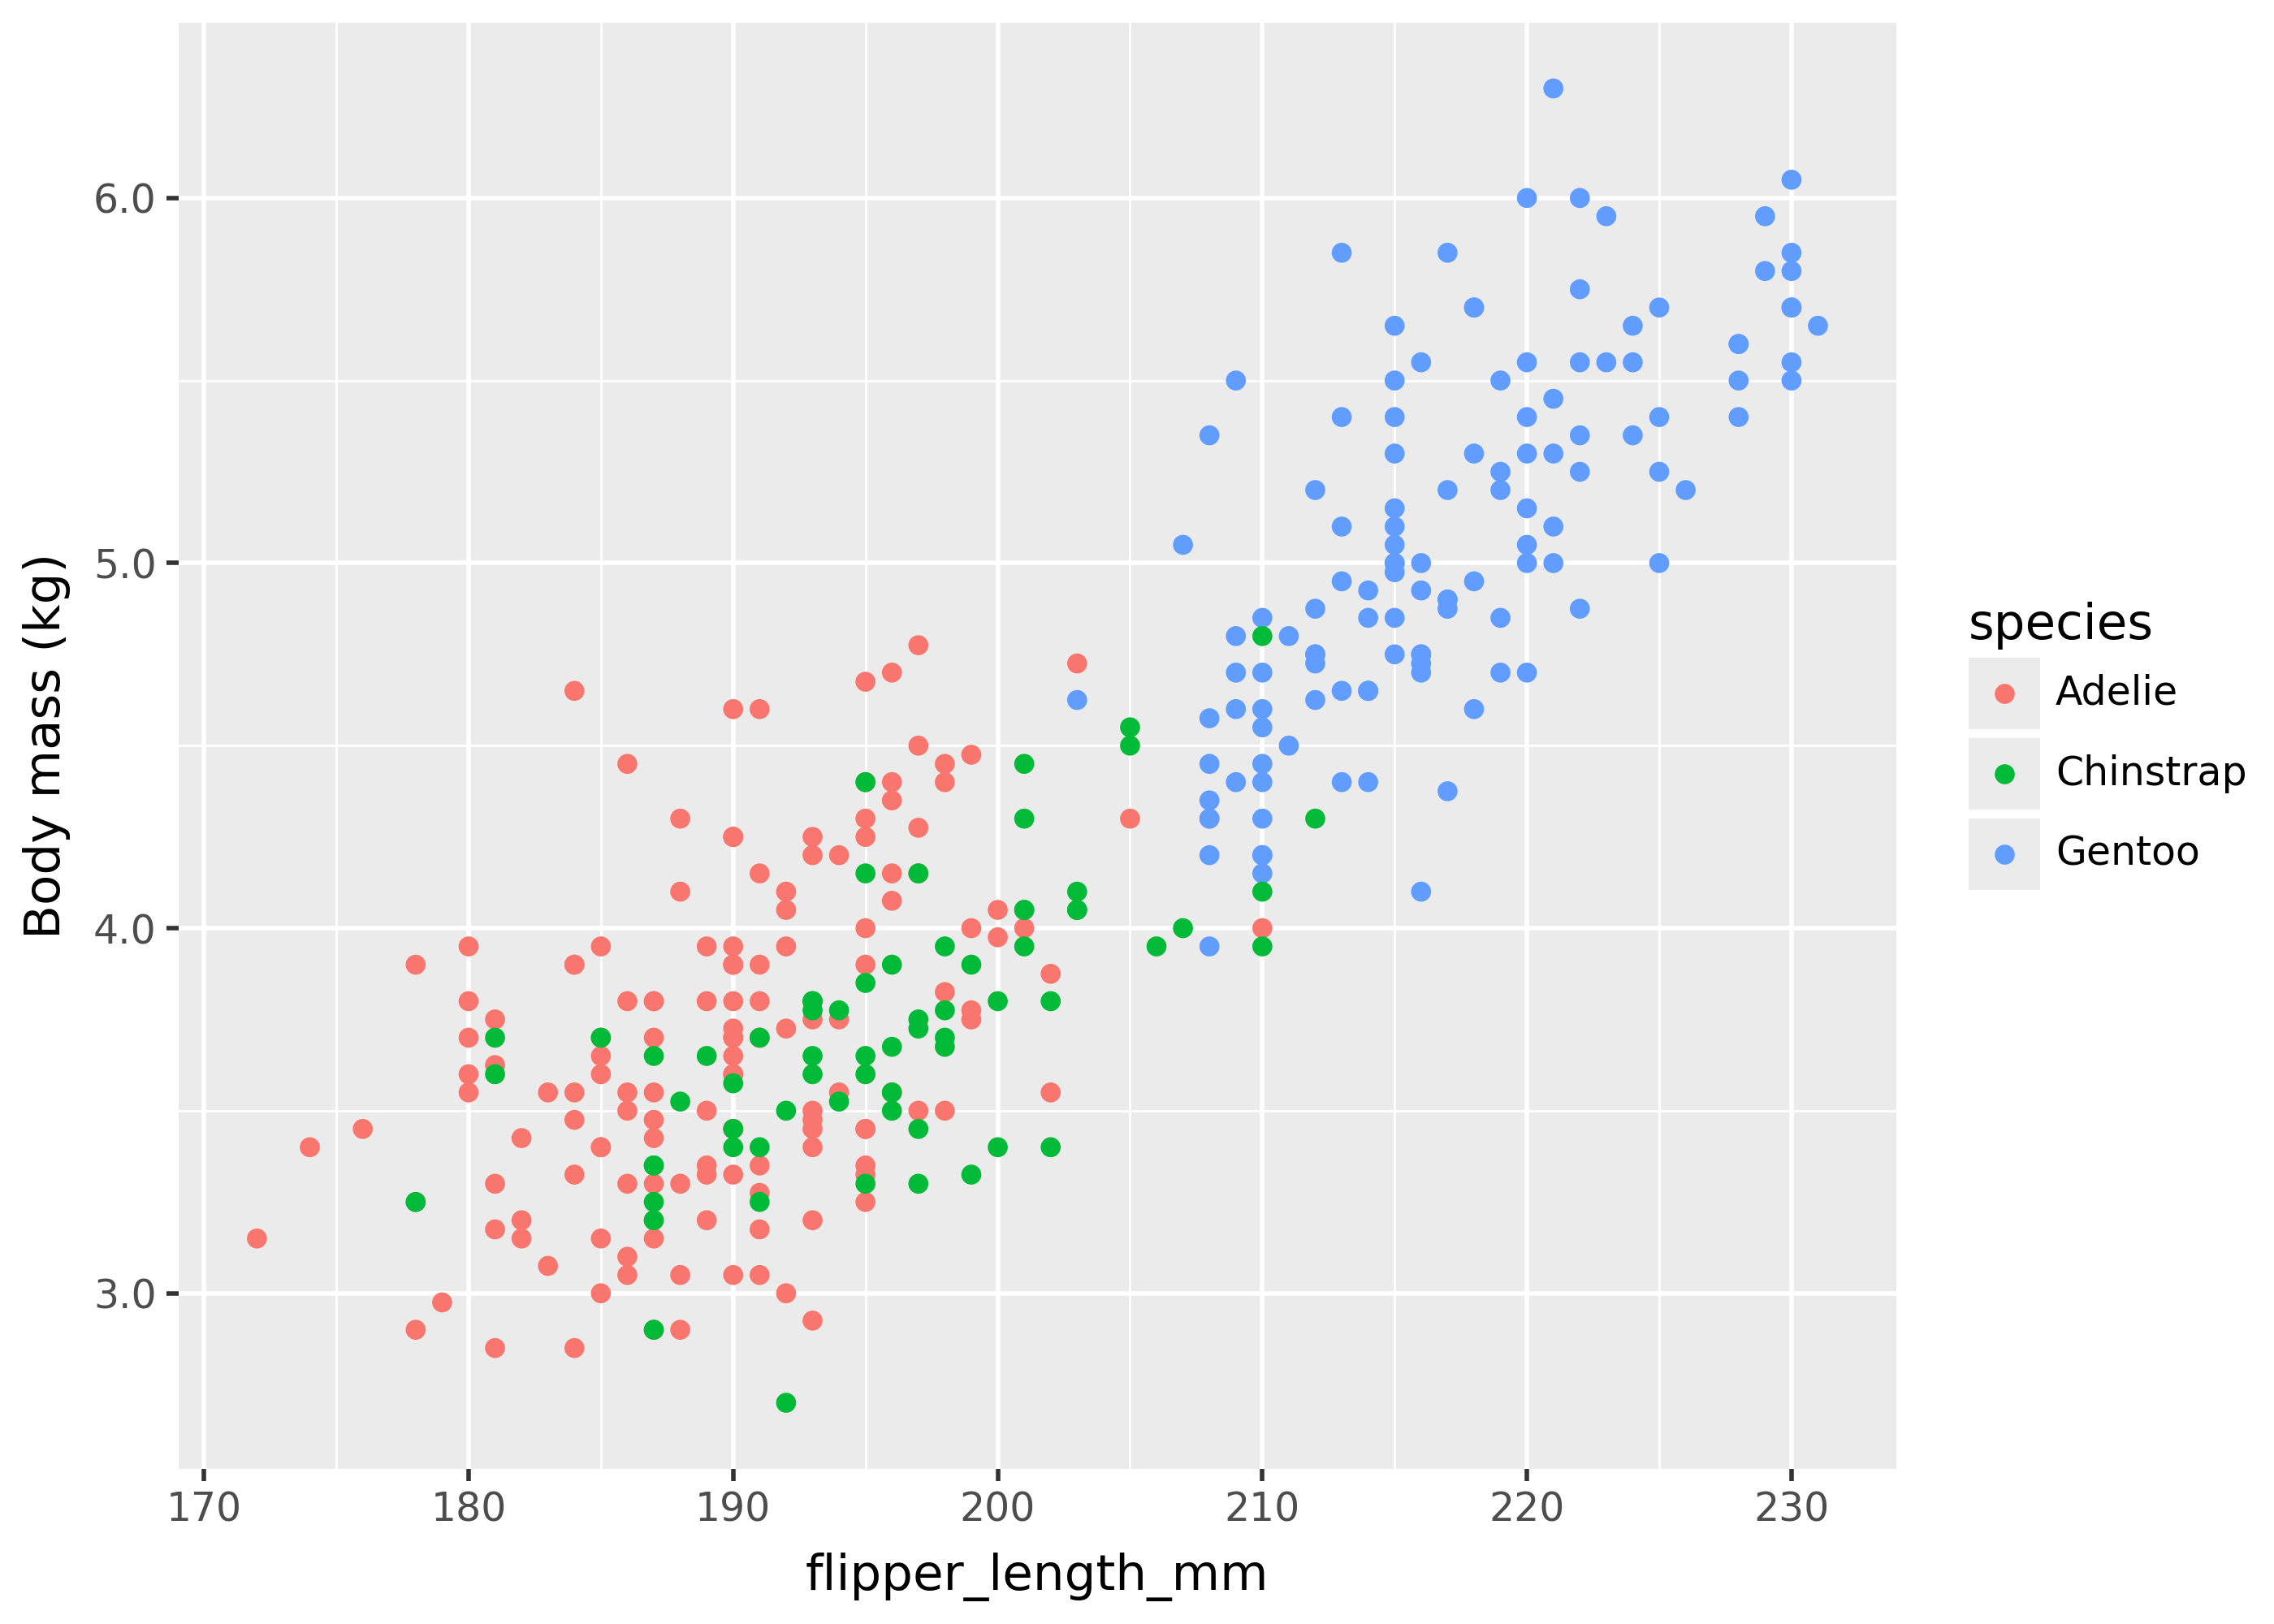
Use the labels= arguments to the appropriate scale_*() function, in order to customize break labels.
For example, the code below changes the y-axis labels from grams to kilograms.
(
    p
    + scale_y_continuous(labels=lambda x: [val / 1_000 for val in x])
    + labs(y="Body mass (kg)")
)
See Scale basics for more on setting break labels.