from plotnine import *
from plotnine.data import penguinsTheme basics
The theme() function customizes the style of plot elements—like the background color, grid lines, tick mark length, and much more. Premade themes like theme_minimal() and theme_538() allow for quick theming.
TipYou will learn
- How to customize the appearance of plots with themes.
- How to set
theme()arguments with theelement_*()functions. - How to identify the 5 main areas themes are divided into.
- How to create a reusable, custom theme.
NoteKey points
- The 5 main areas of a plot are axis, legend, panel, plot, and strip.
- Use
element_text()to customize pieces like axis text. - Use
element_line()to customize pieces like tick marks. - Use
element_blank()to remove theme elements from a plot. theme()arguments likeaxis_text=...set the default for y- and x-axis text.- Assign a
theme()result to a variable to reuse it across plots.
Setup
Premade themes
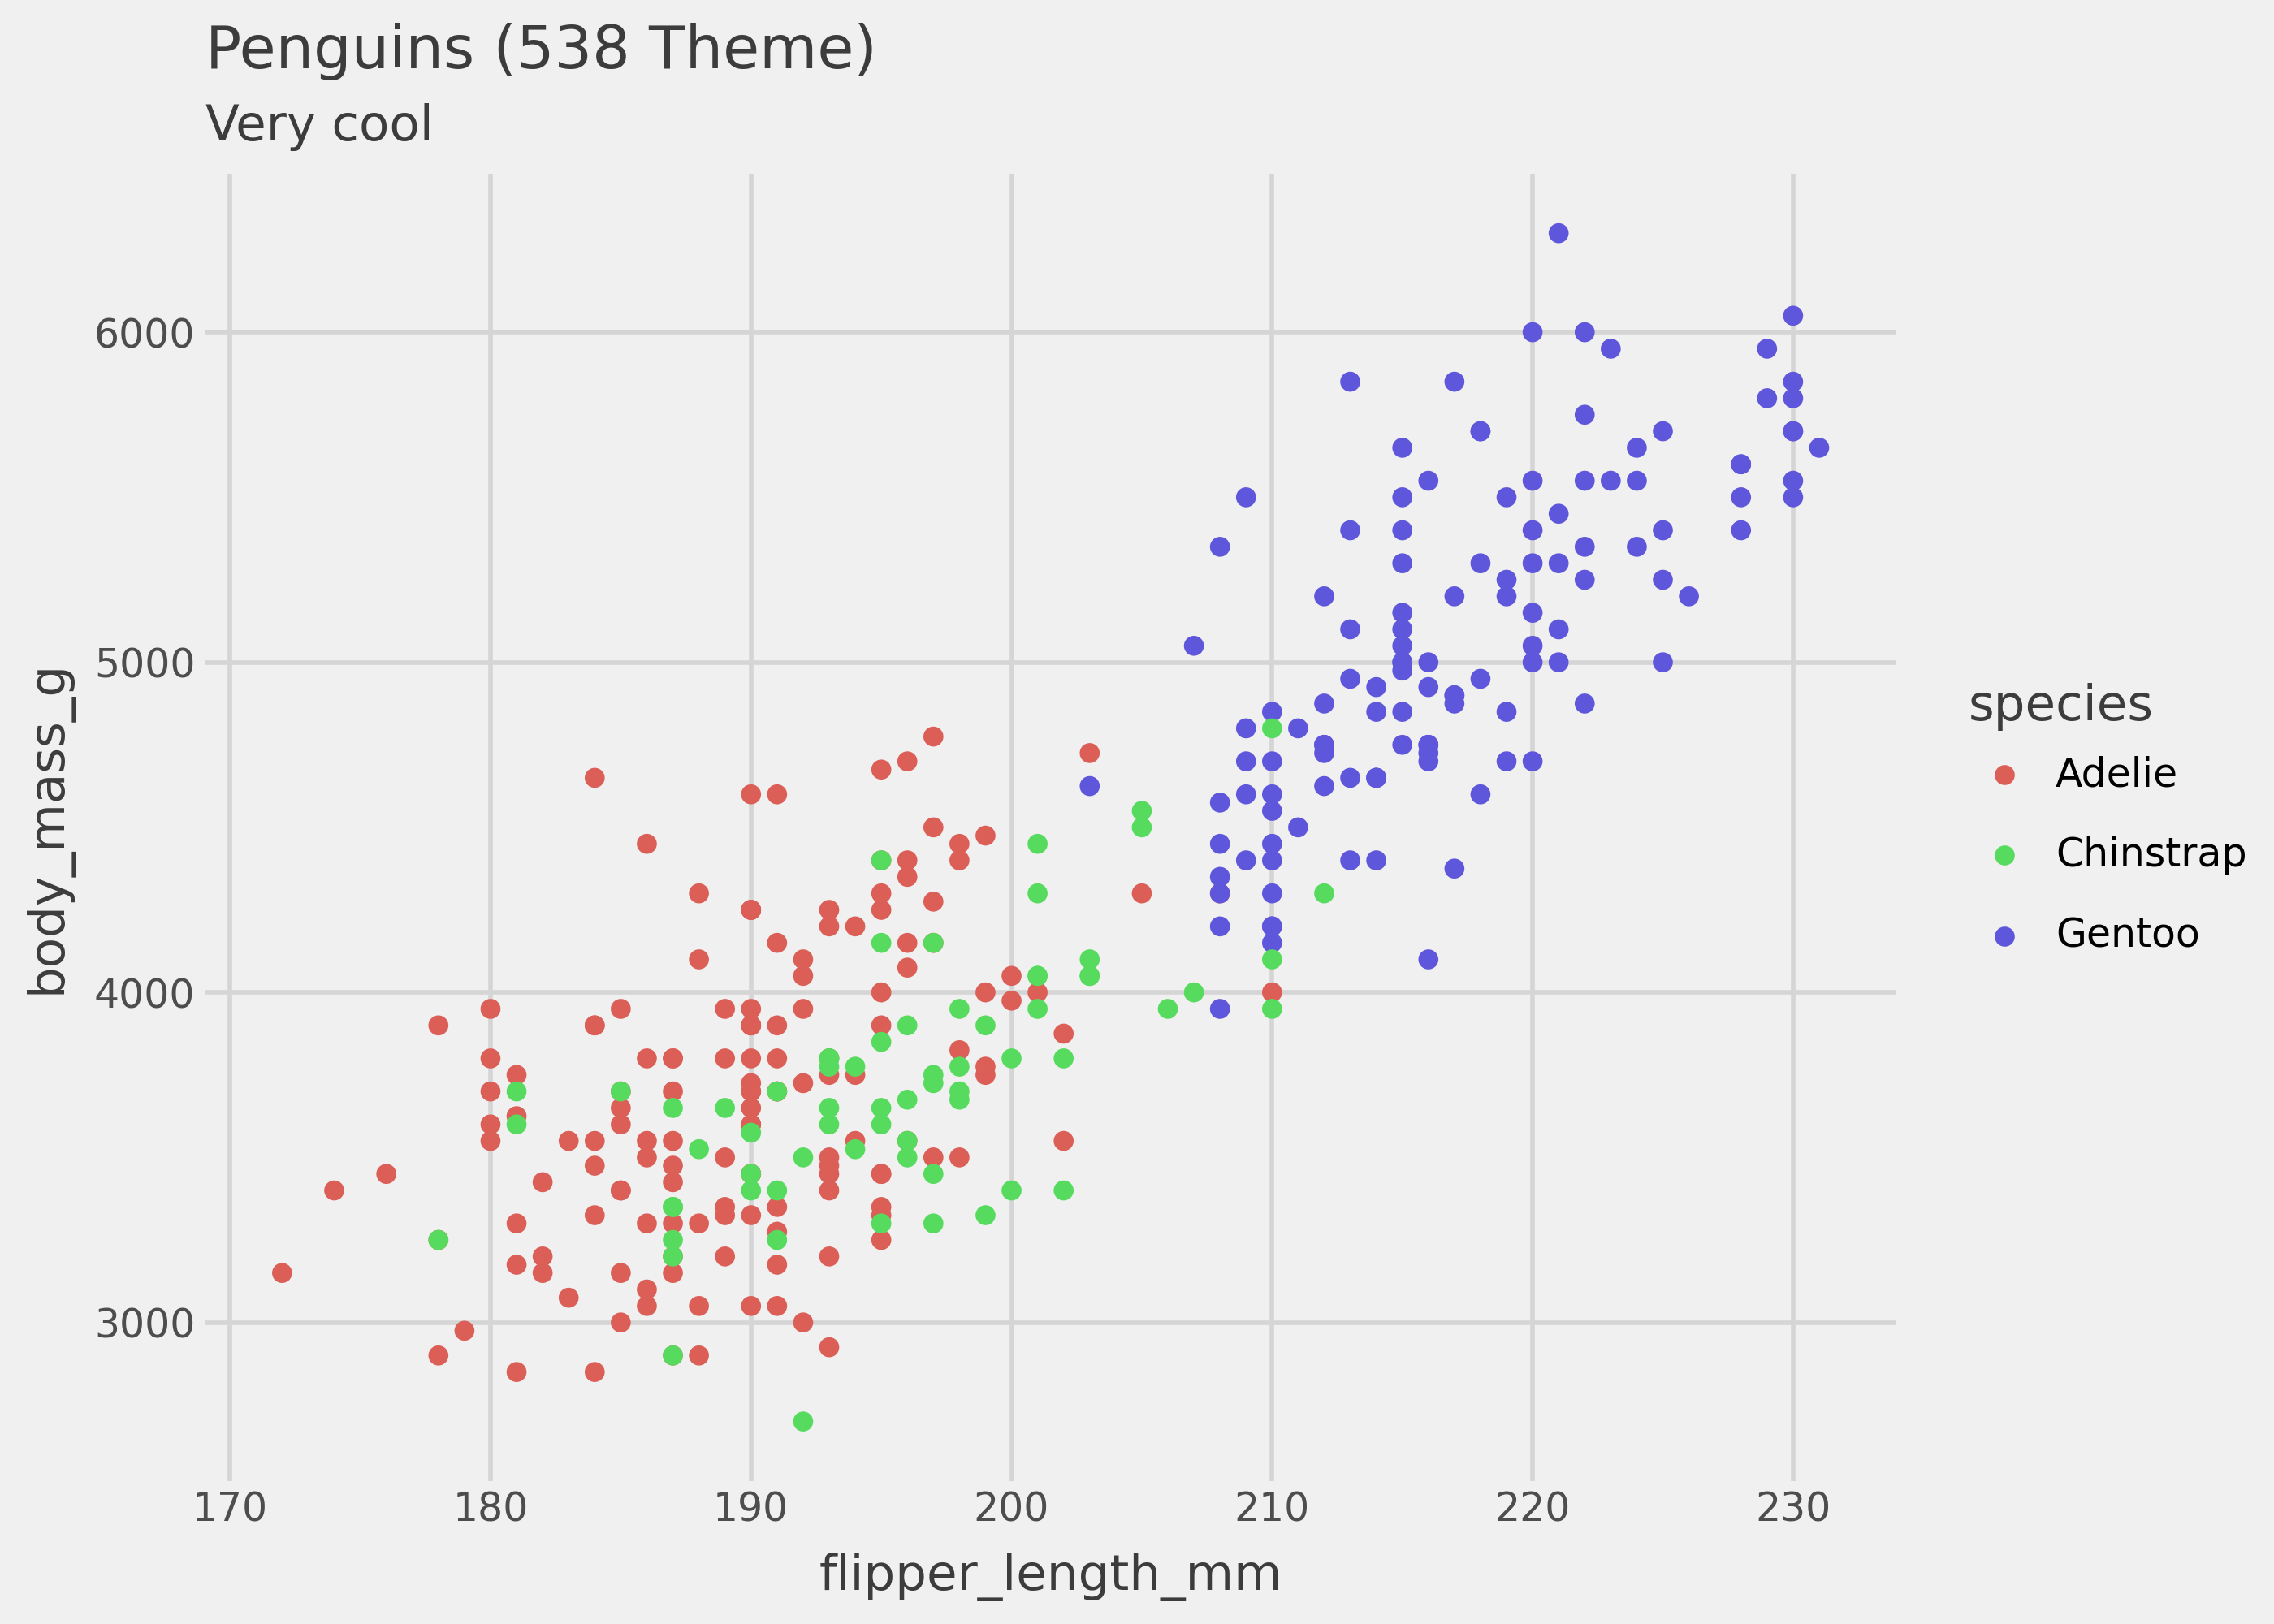
The quickest way to explore themes is by applying a premade one. These start with theme_*(), and include theme_minimal(), theme_bw(), and theme_538().
p = (
    ggplot(penguins, aes(x="flipper_length_mm", y="body_mass_g", color="species"))
    + labs(title="Penguins (538 Theme)", subtitle="Very cool")
    + geom_point()
)

p
p + theme_538()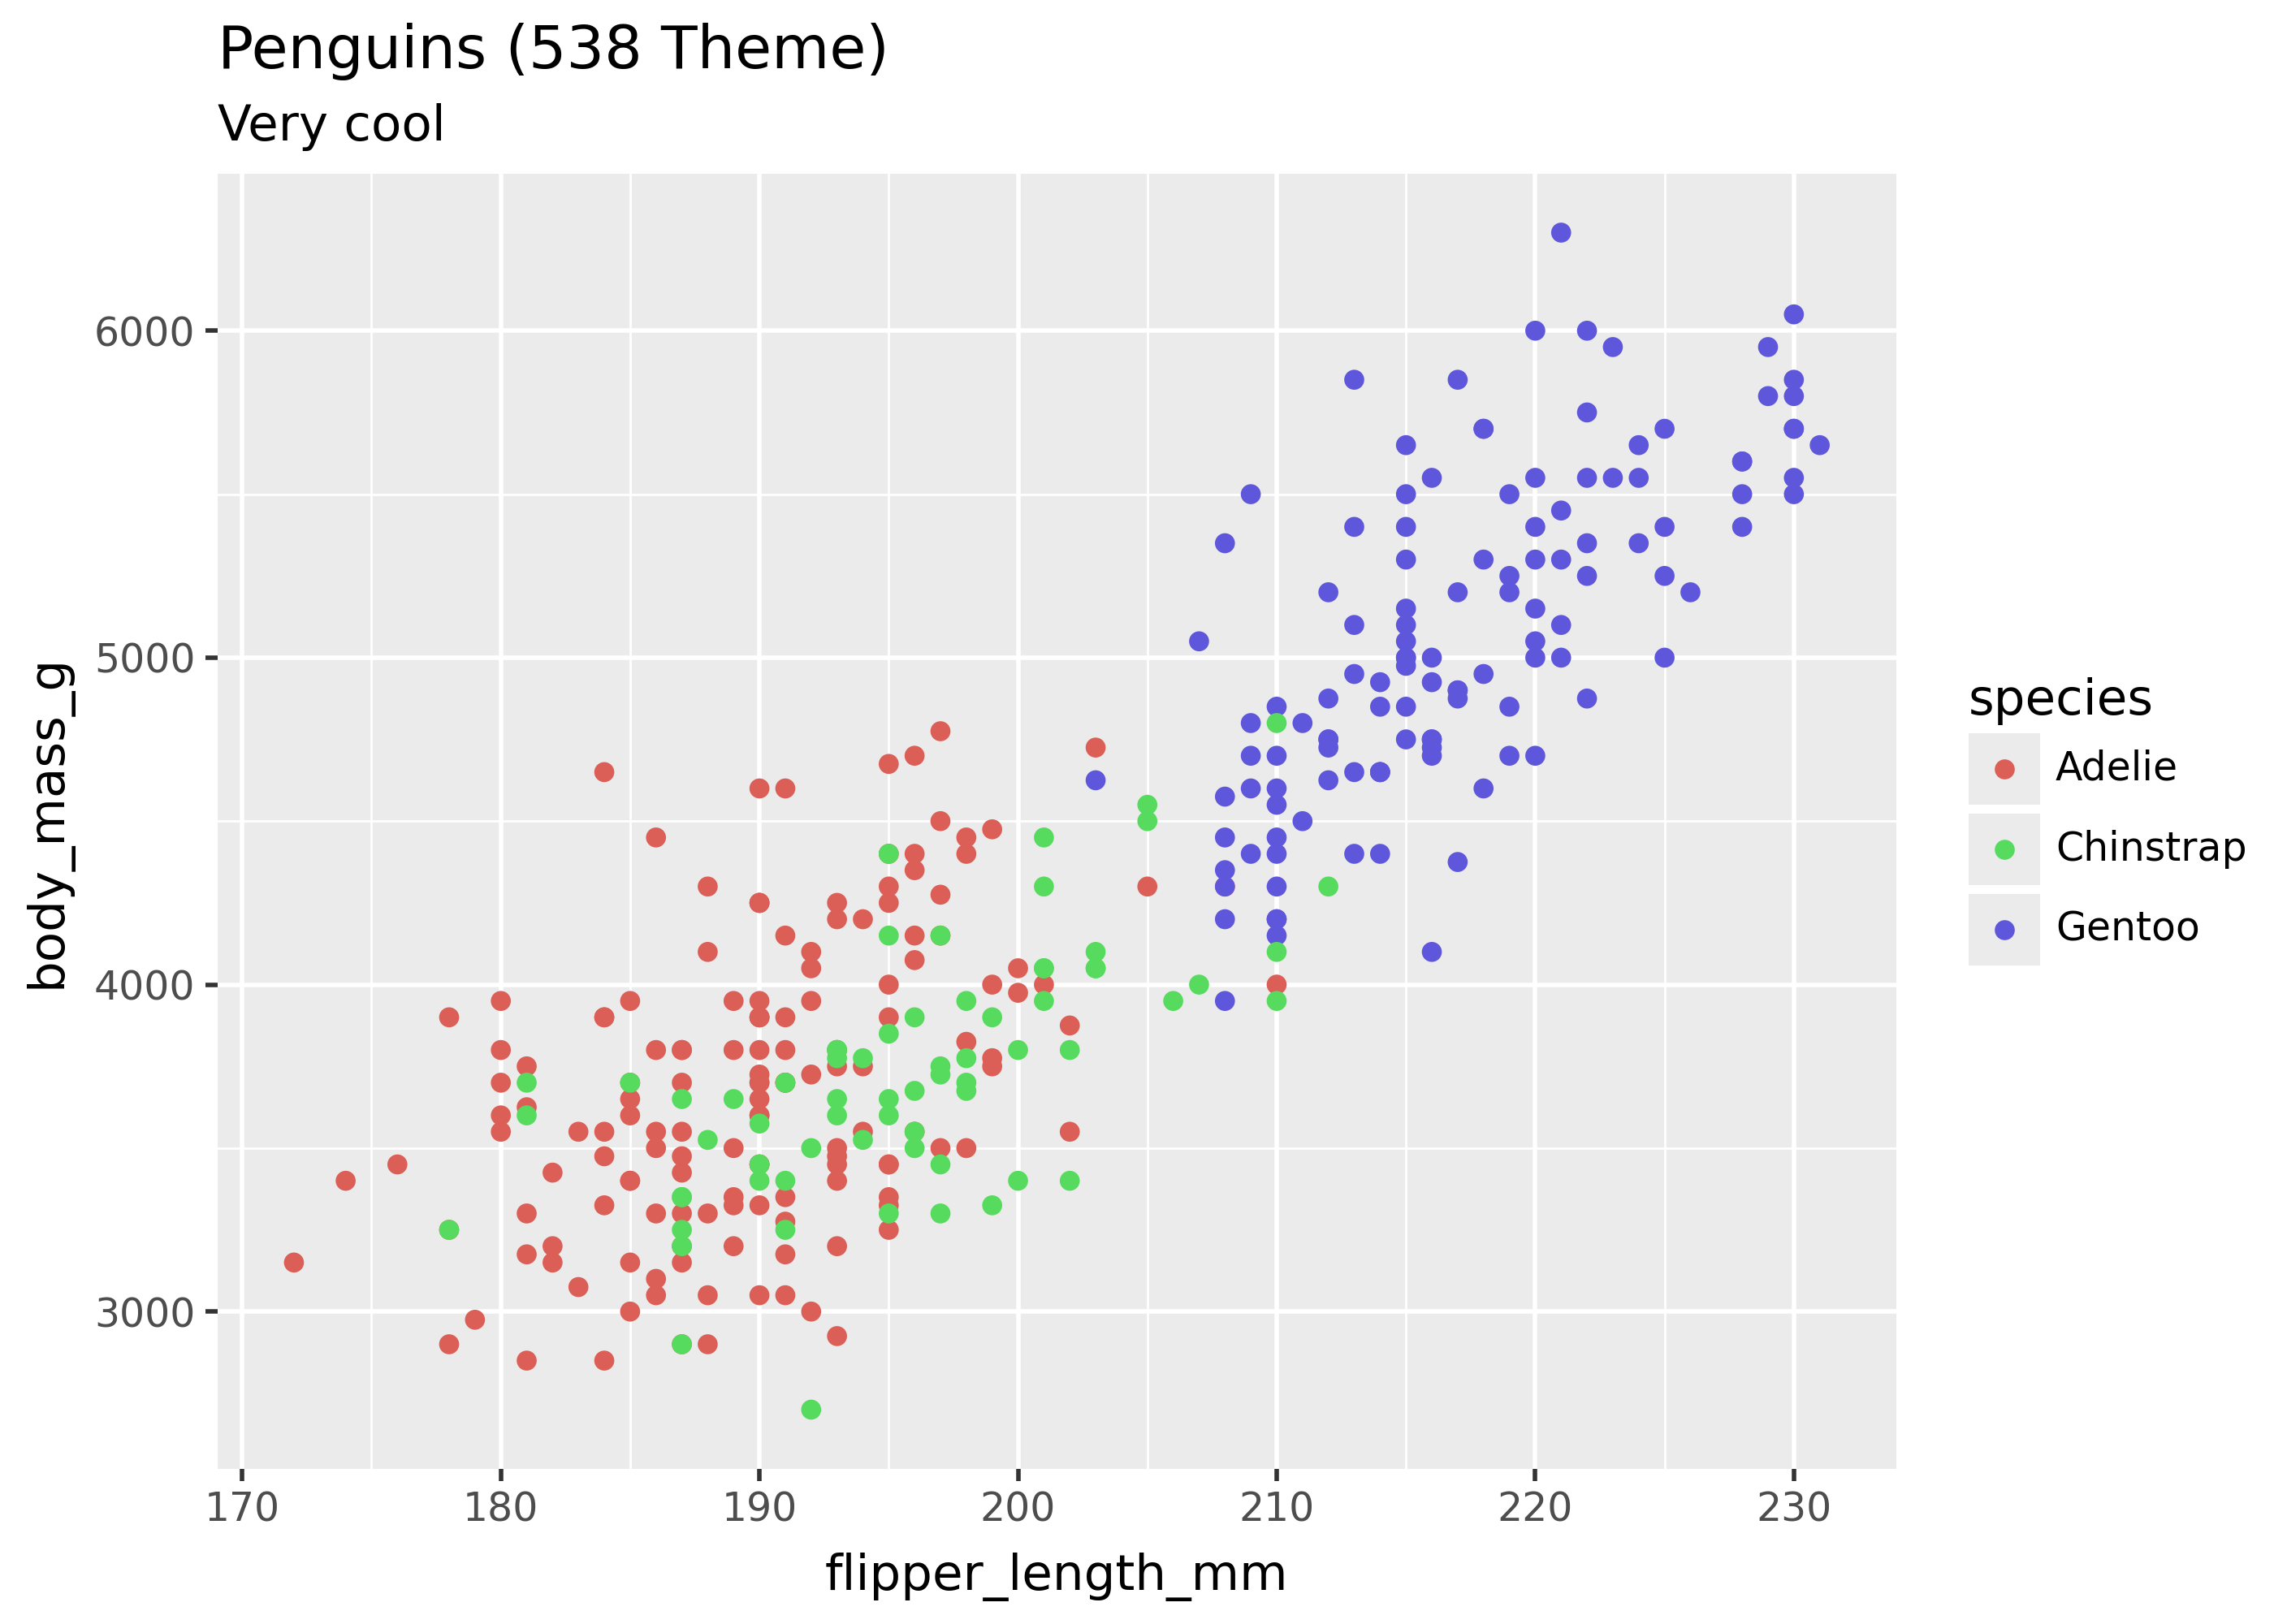
Basic theme() use
Use the theme() function to customize many aspects of a plot’s appearance. This function often takes an element object, like element_text(), which specifies properties like font size and color.
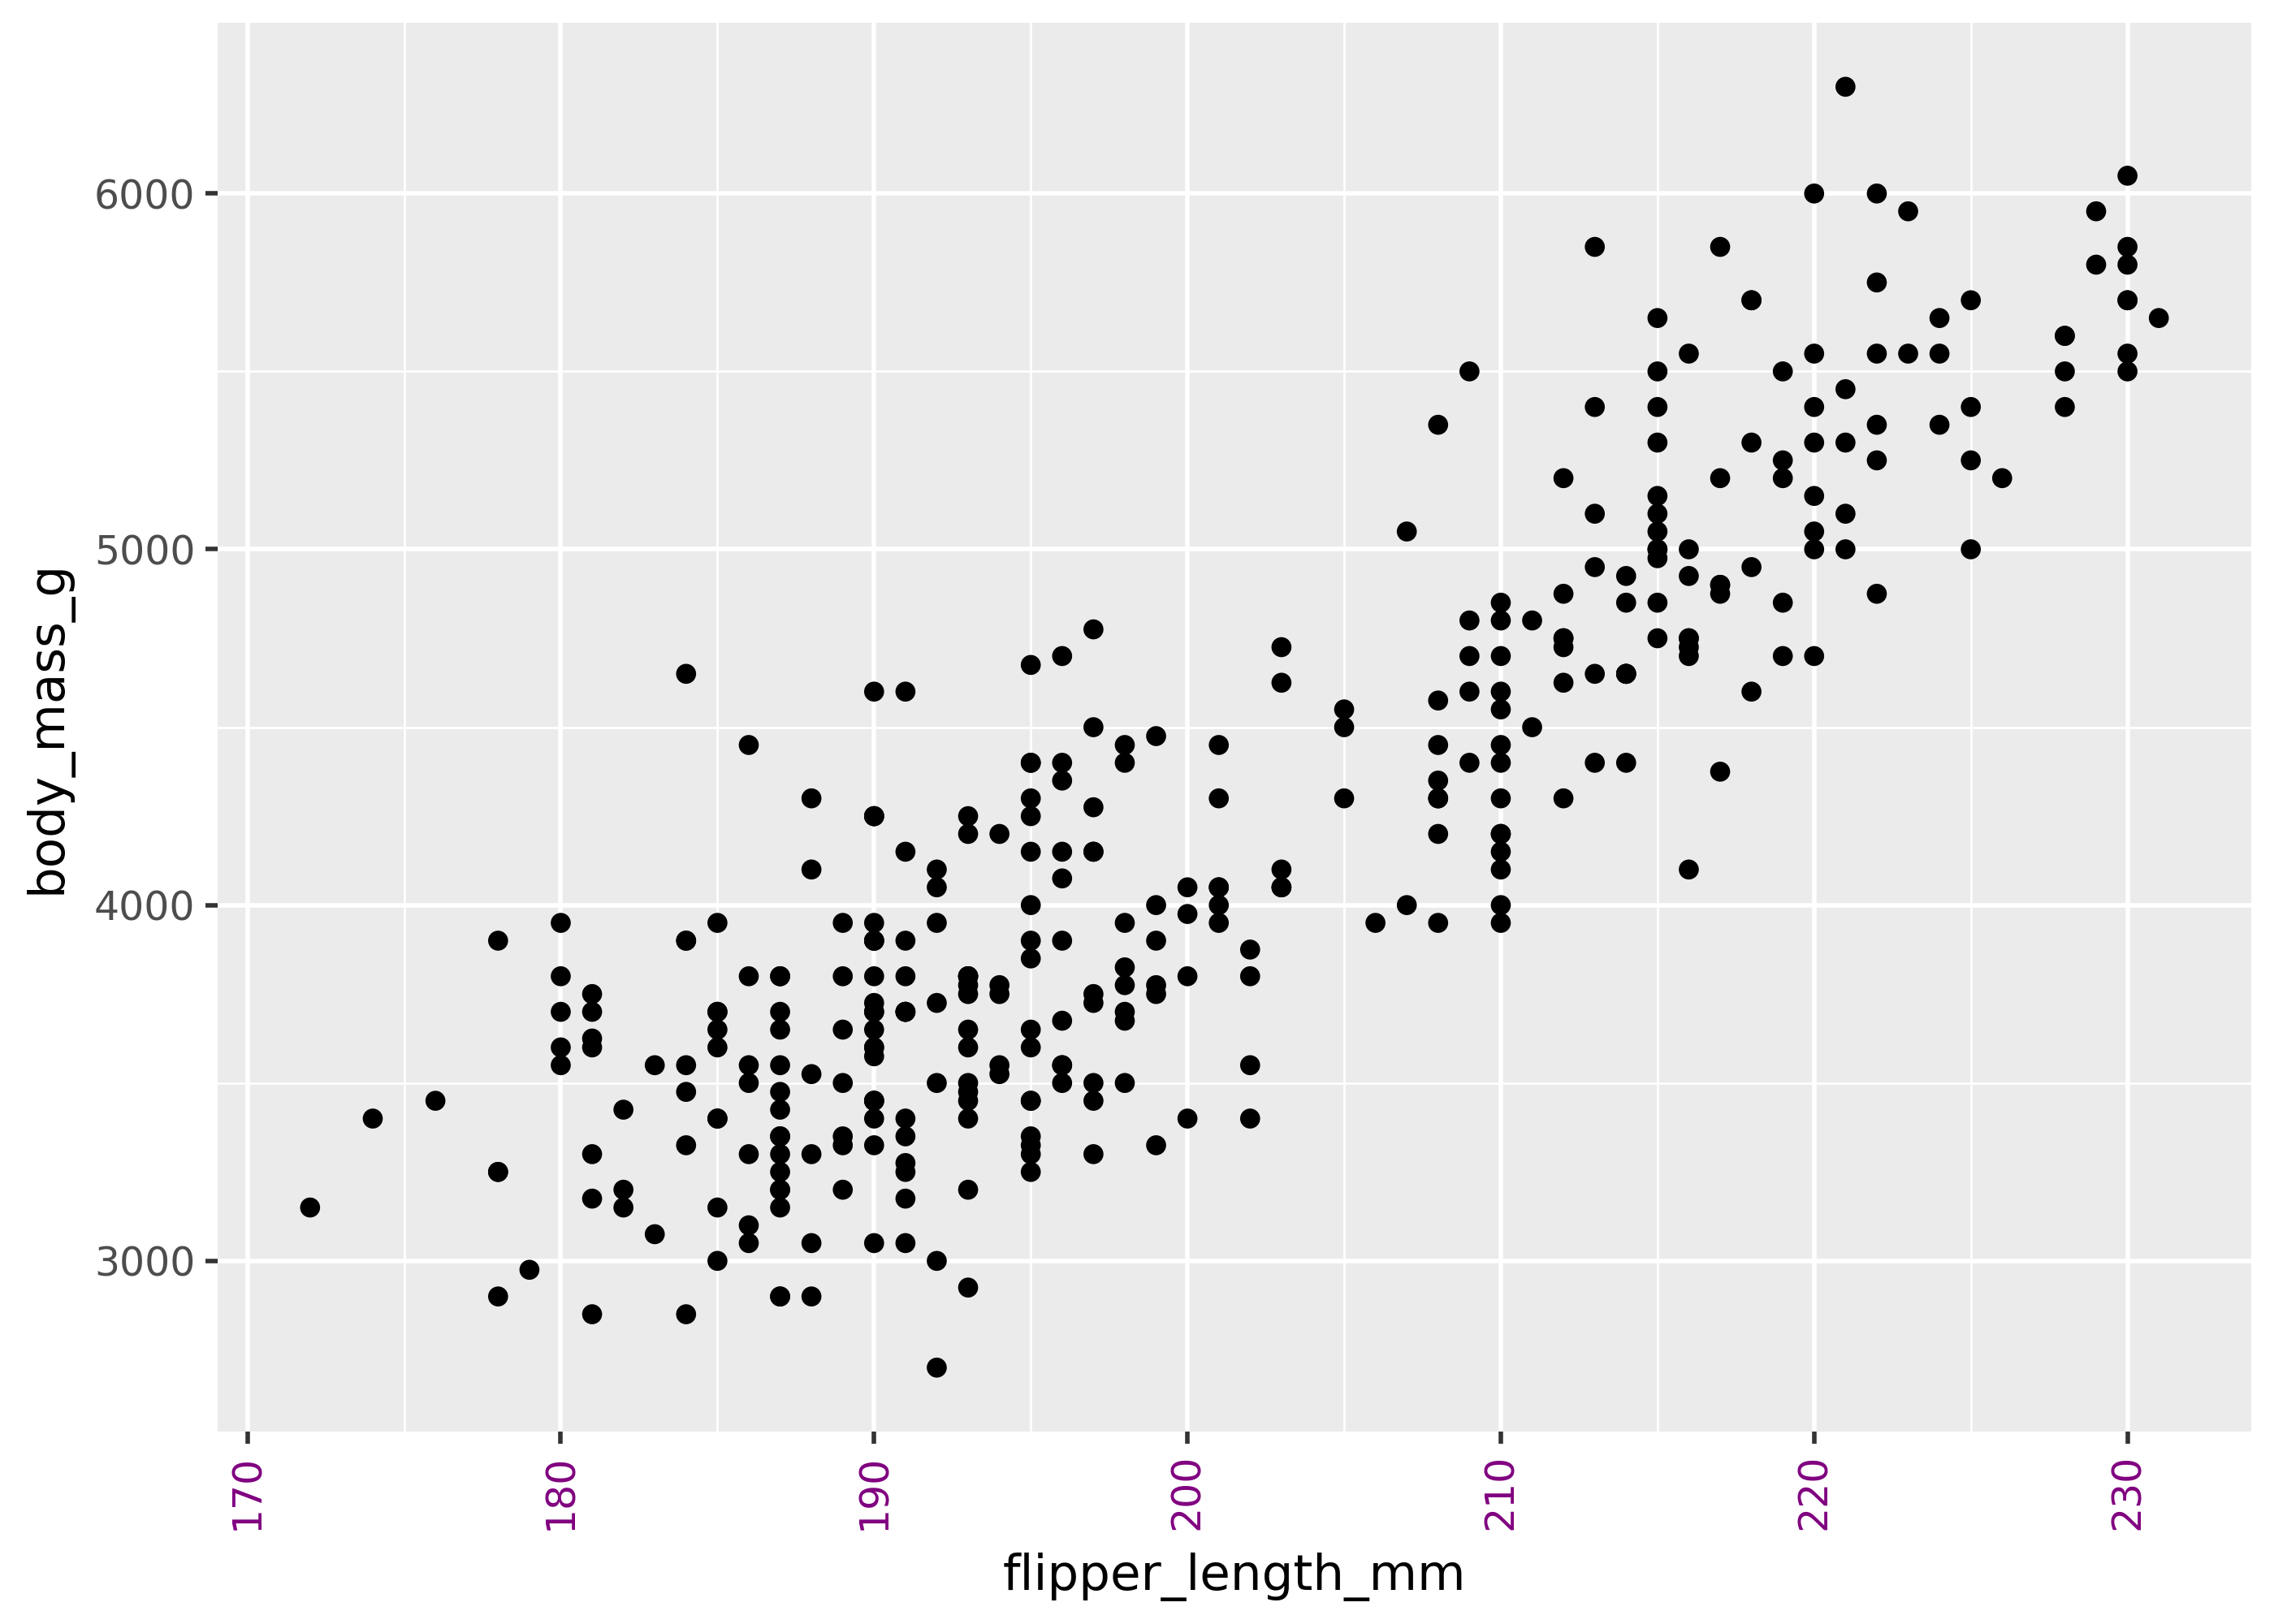
For example, the code below sets the x-axis text to be purple and rotated 90 degrees.
(
    ggplot(penguins, aes(x="flipper_length_mm", y="body_mass_g"))
    + geom_point()
    + theme(
        axis_text_x=element_text(angle=90, color="purple"),
    )
)
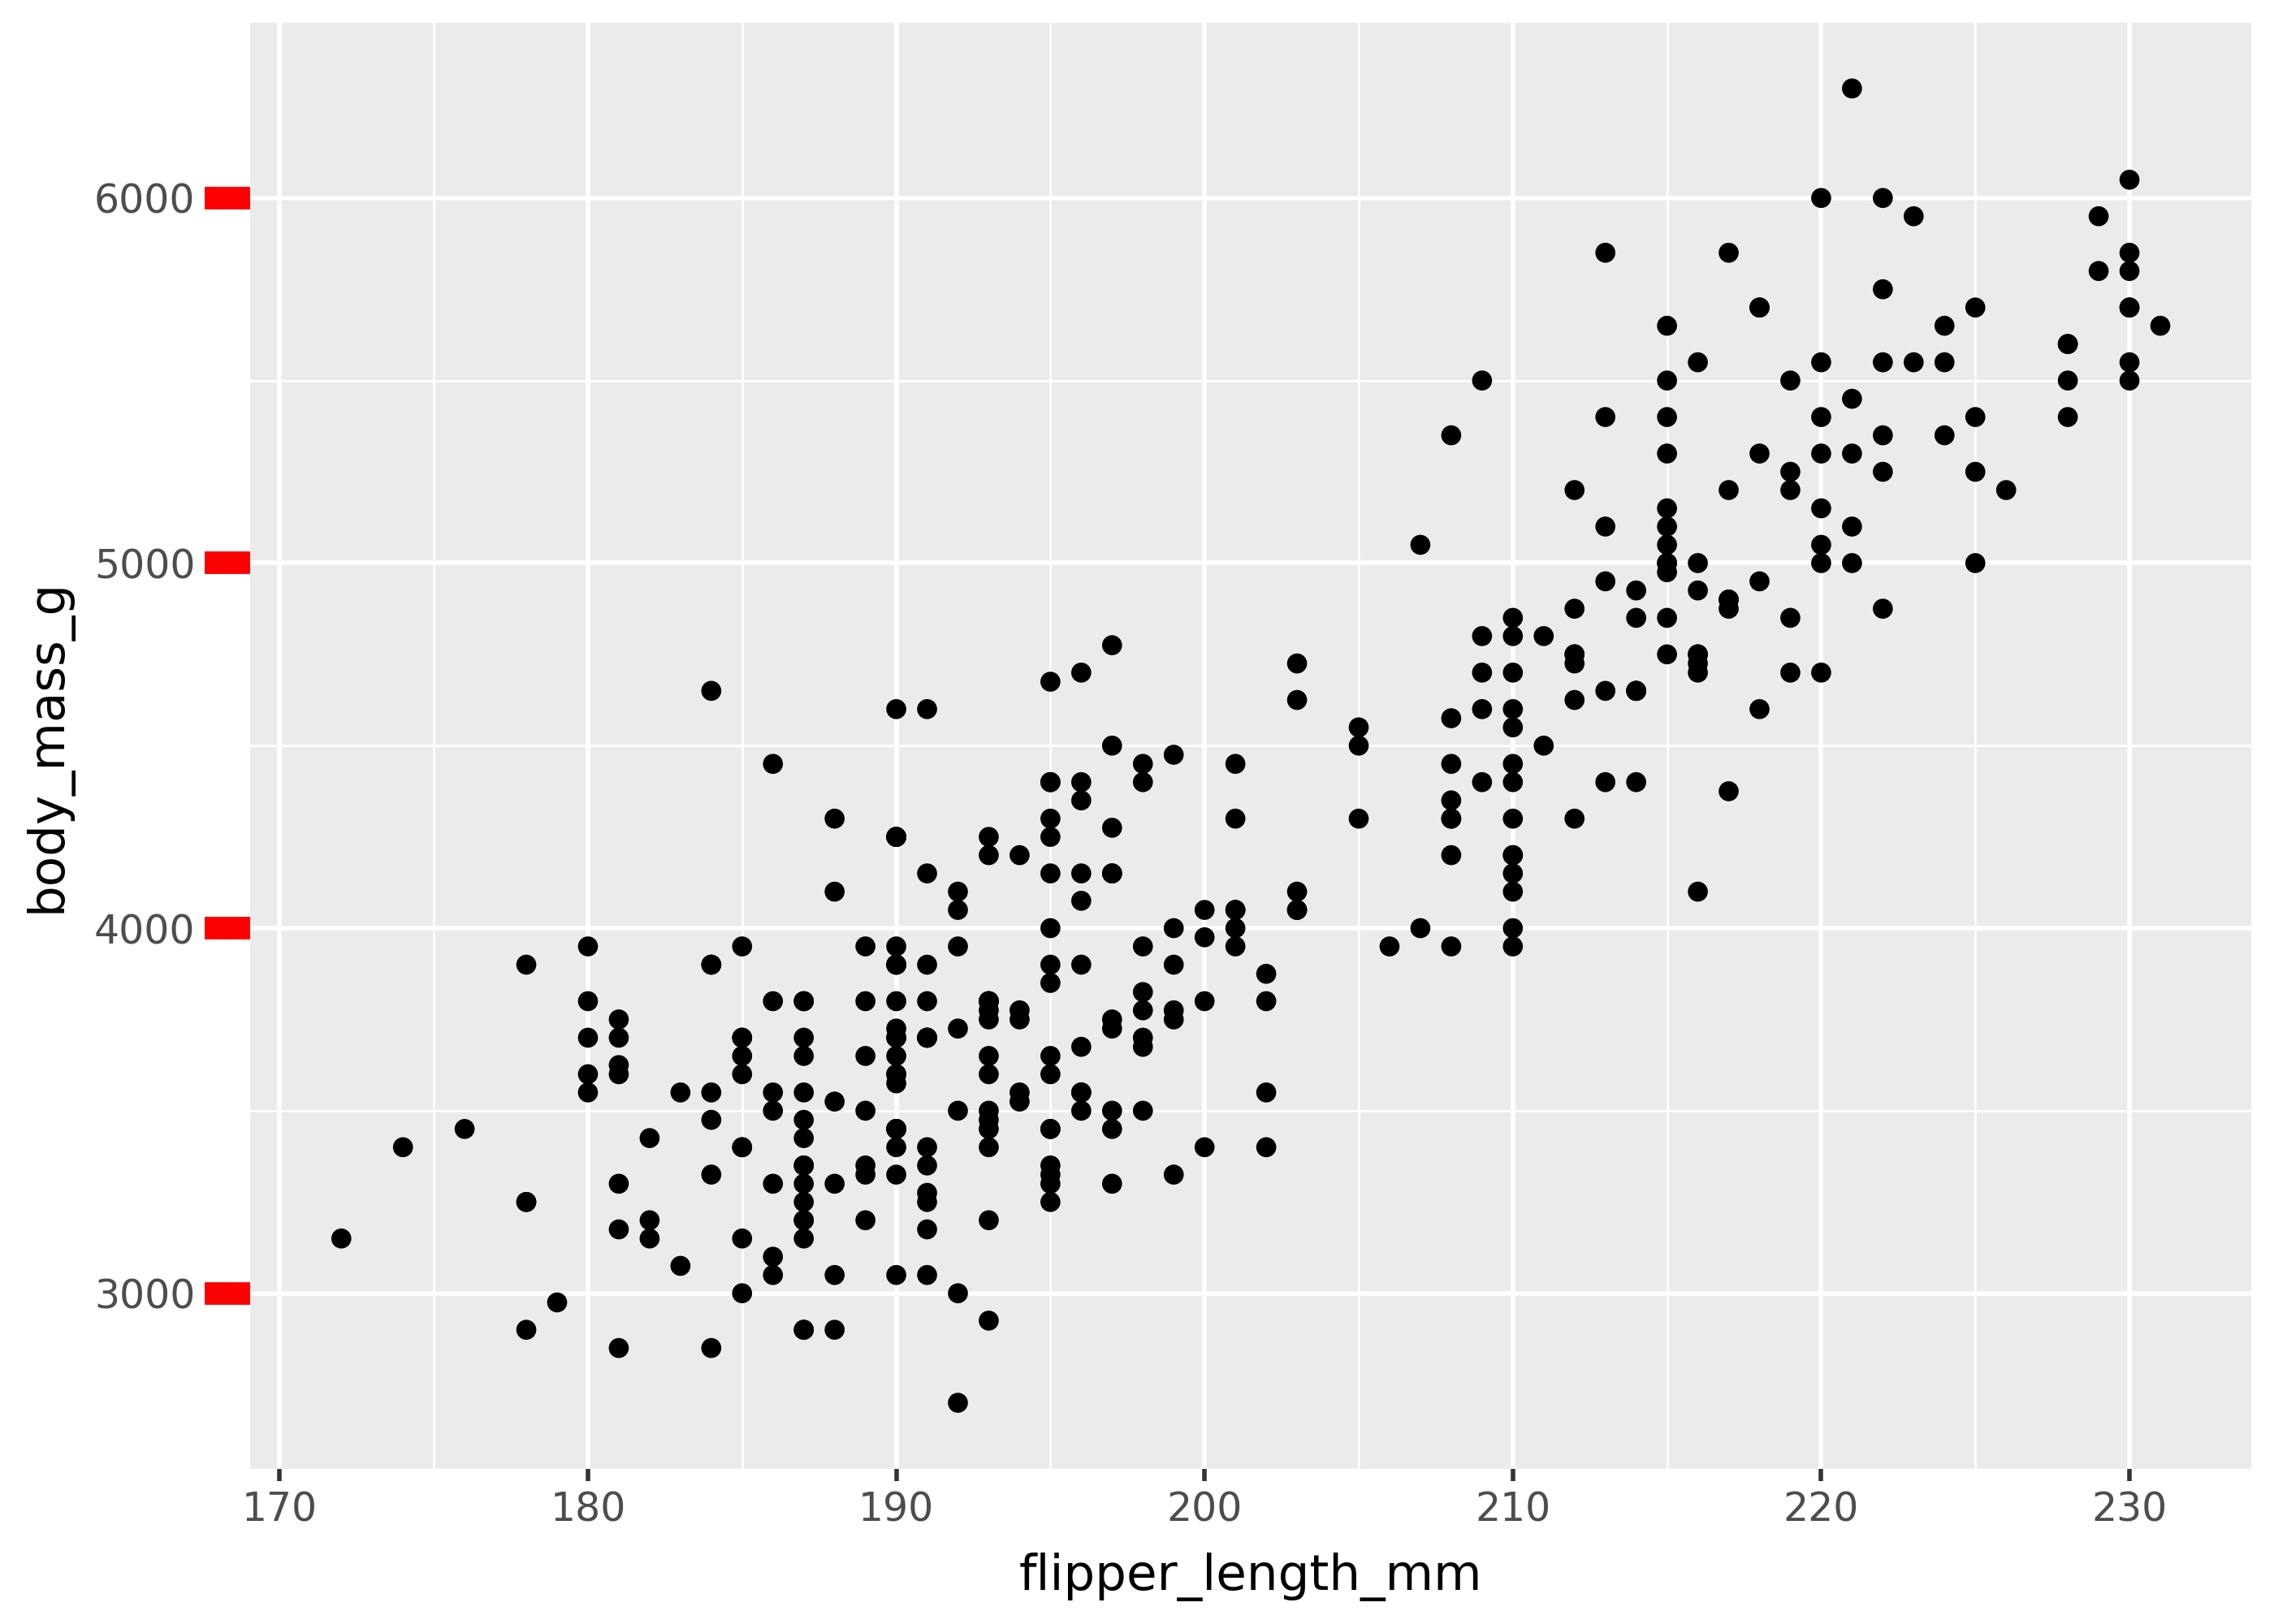
The element_line() function can be used to customize pieces like tick marks. This is shown below.
(
    ggplot(penguins, aes(x="flipper_length_mm", y="body_mass_g"))
    + geom_point()
    + theme(
        axis_ticks_major_y=element_line(color="red", size=5),
        axis_ticks_length_major_y=10,
    )
)
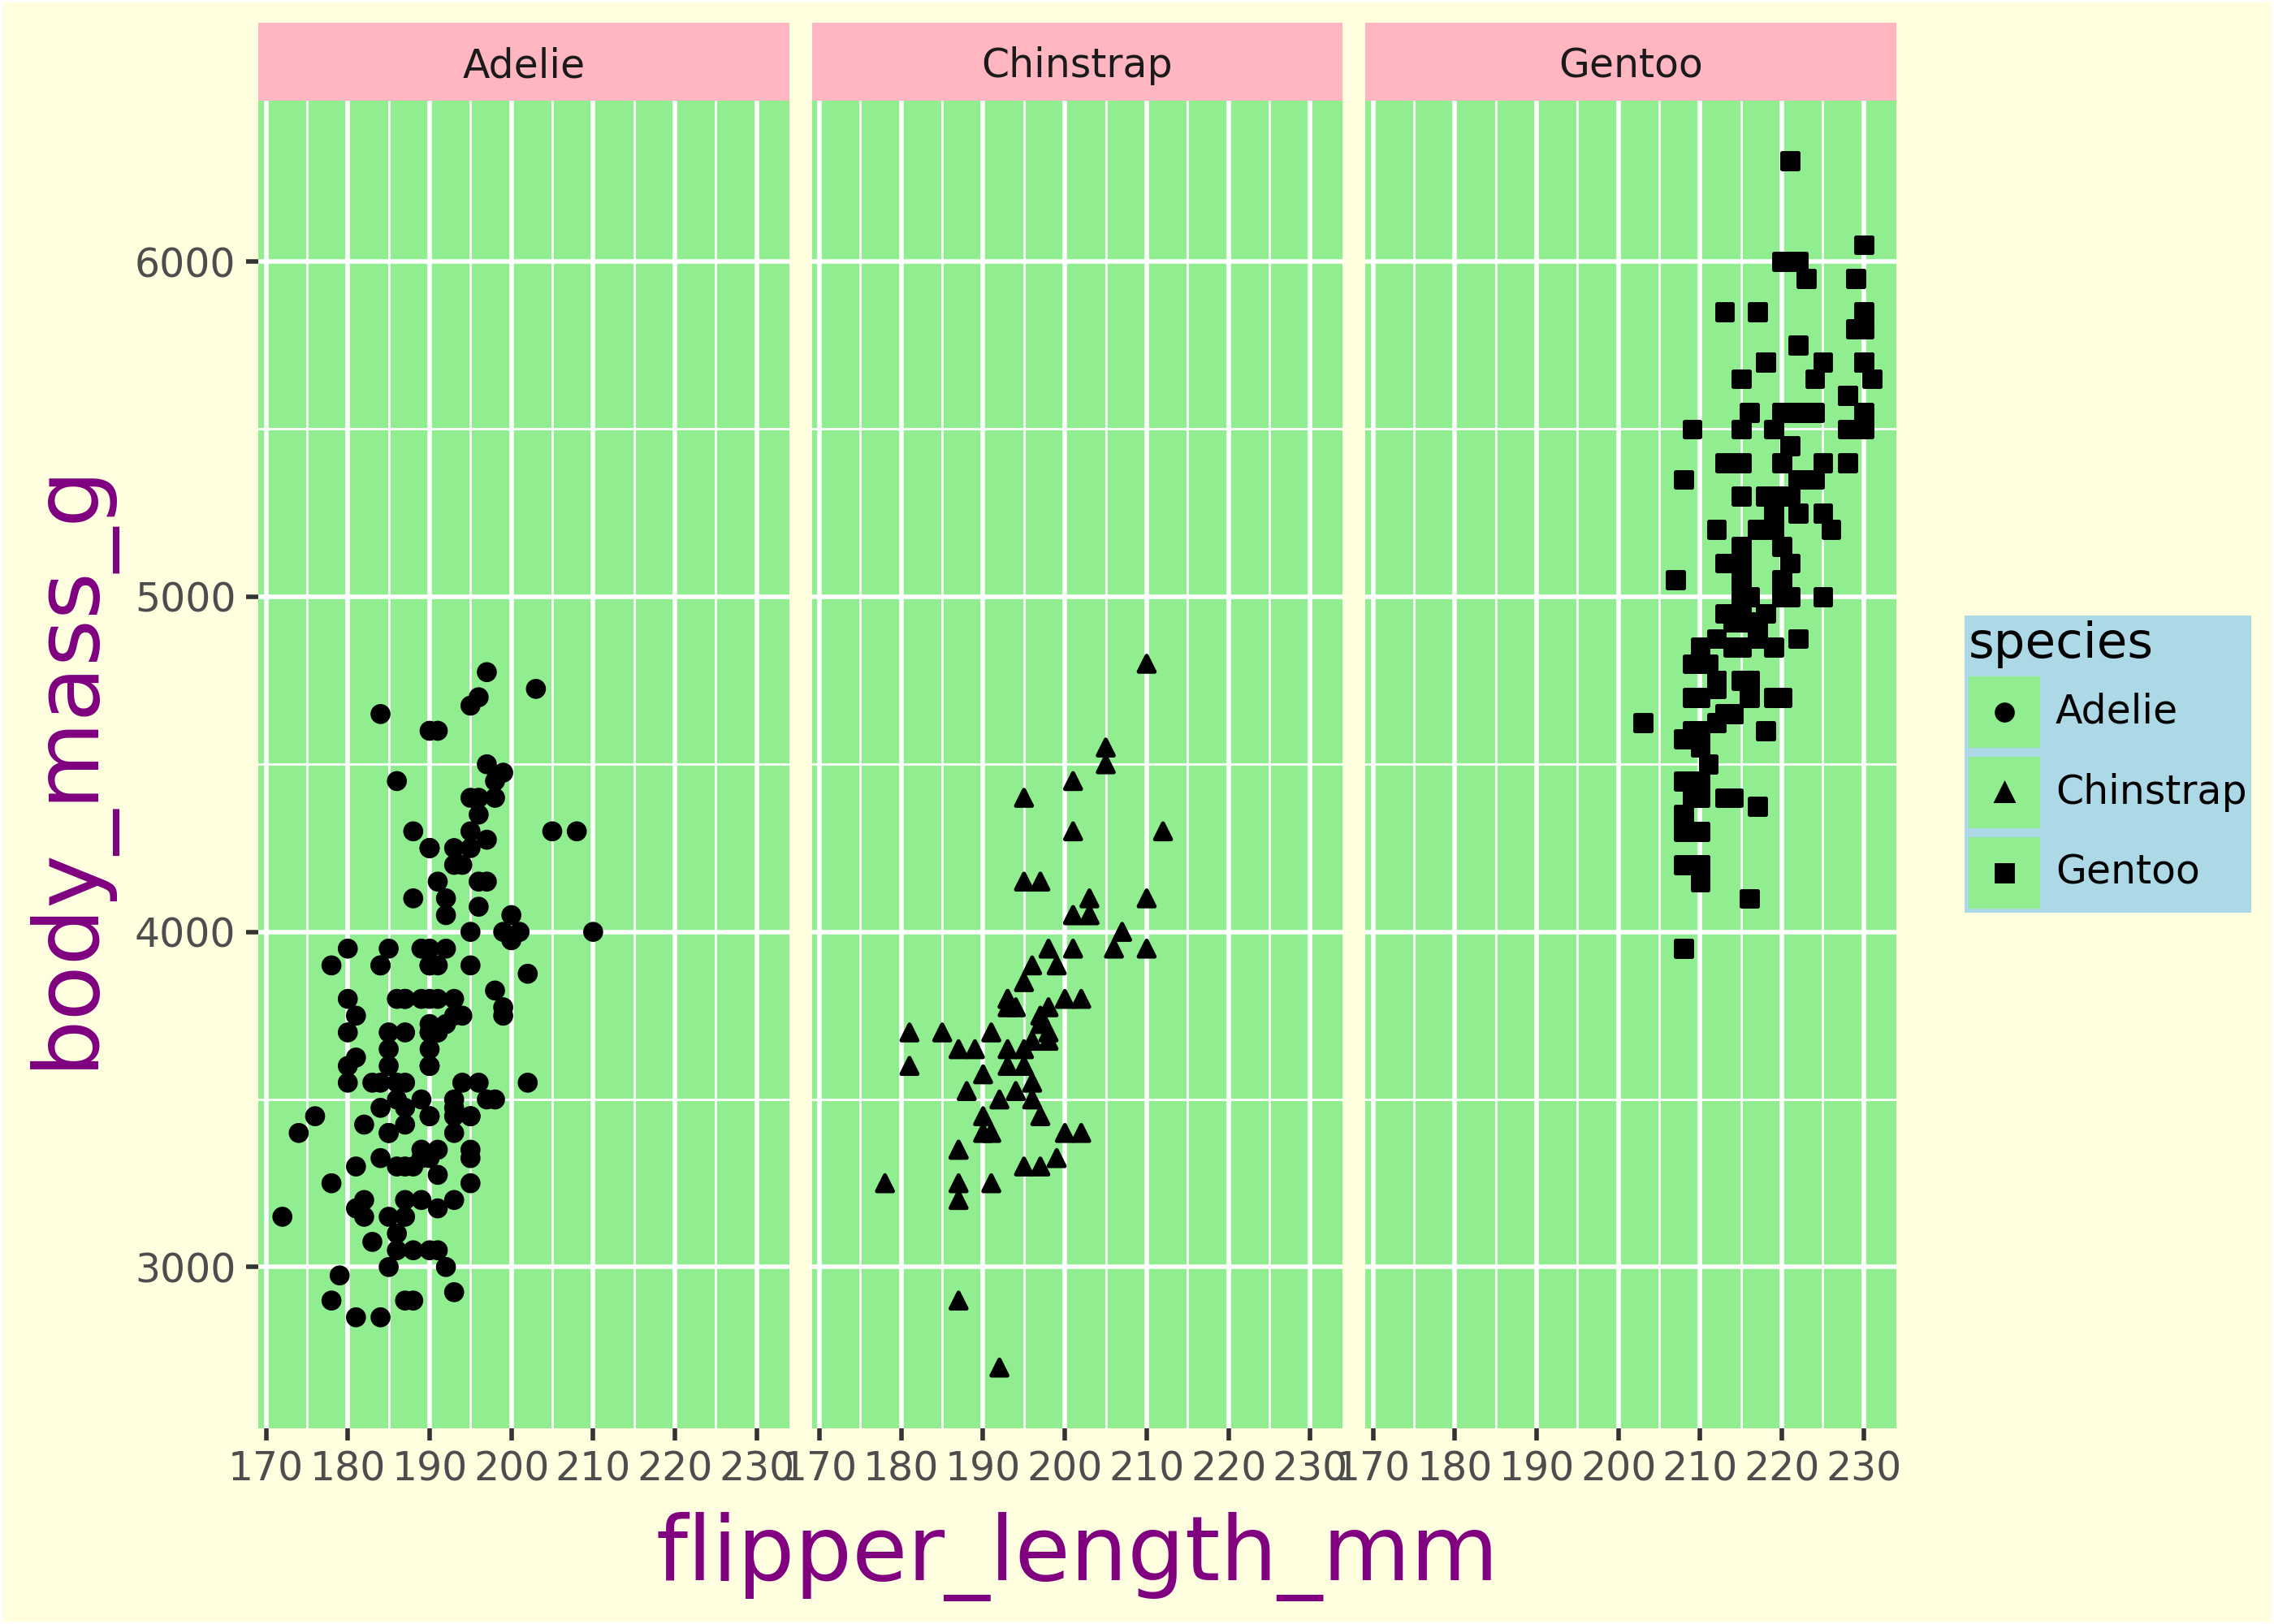
Five main theme areas
There are five main areas of a plot that can be customized—axis, legend, panel, plot, and strip. These are colored in the plot below.
(
    ggplot(penguins, aes(x="flipper_length_mm", y="body_mass_g", shape="species"))
    + geom_point()
    + facet_wrap("~species")
    + theme(
        axis_title=element_text(size=20, color="purple"),
        legend_background=element_rect(fill="lightblue"),
        panel_background=element_rect(fill="lightgreen"),
        plot_background=element_rect(fill="lightyellow"),
        strip_background=element_rect(fill="lightpink"),
    )
    + theme()
)
Each of these areas contains many specific pieces that can be customized. For example, the legend margin, panel grid lines, or plot title style. There are over 100 theme arguments available in theme()!
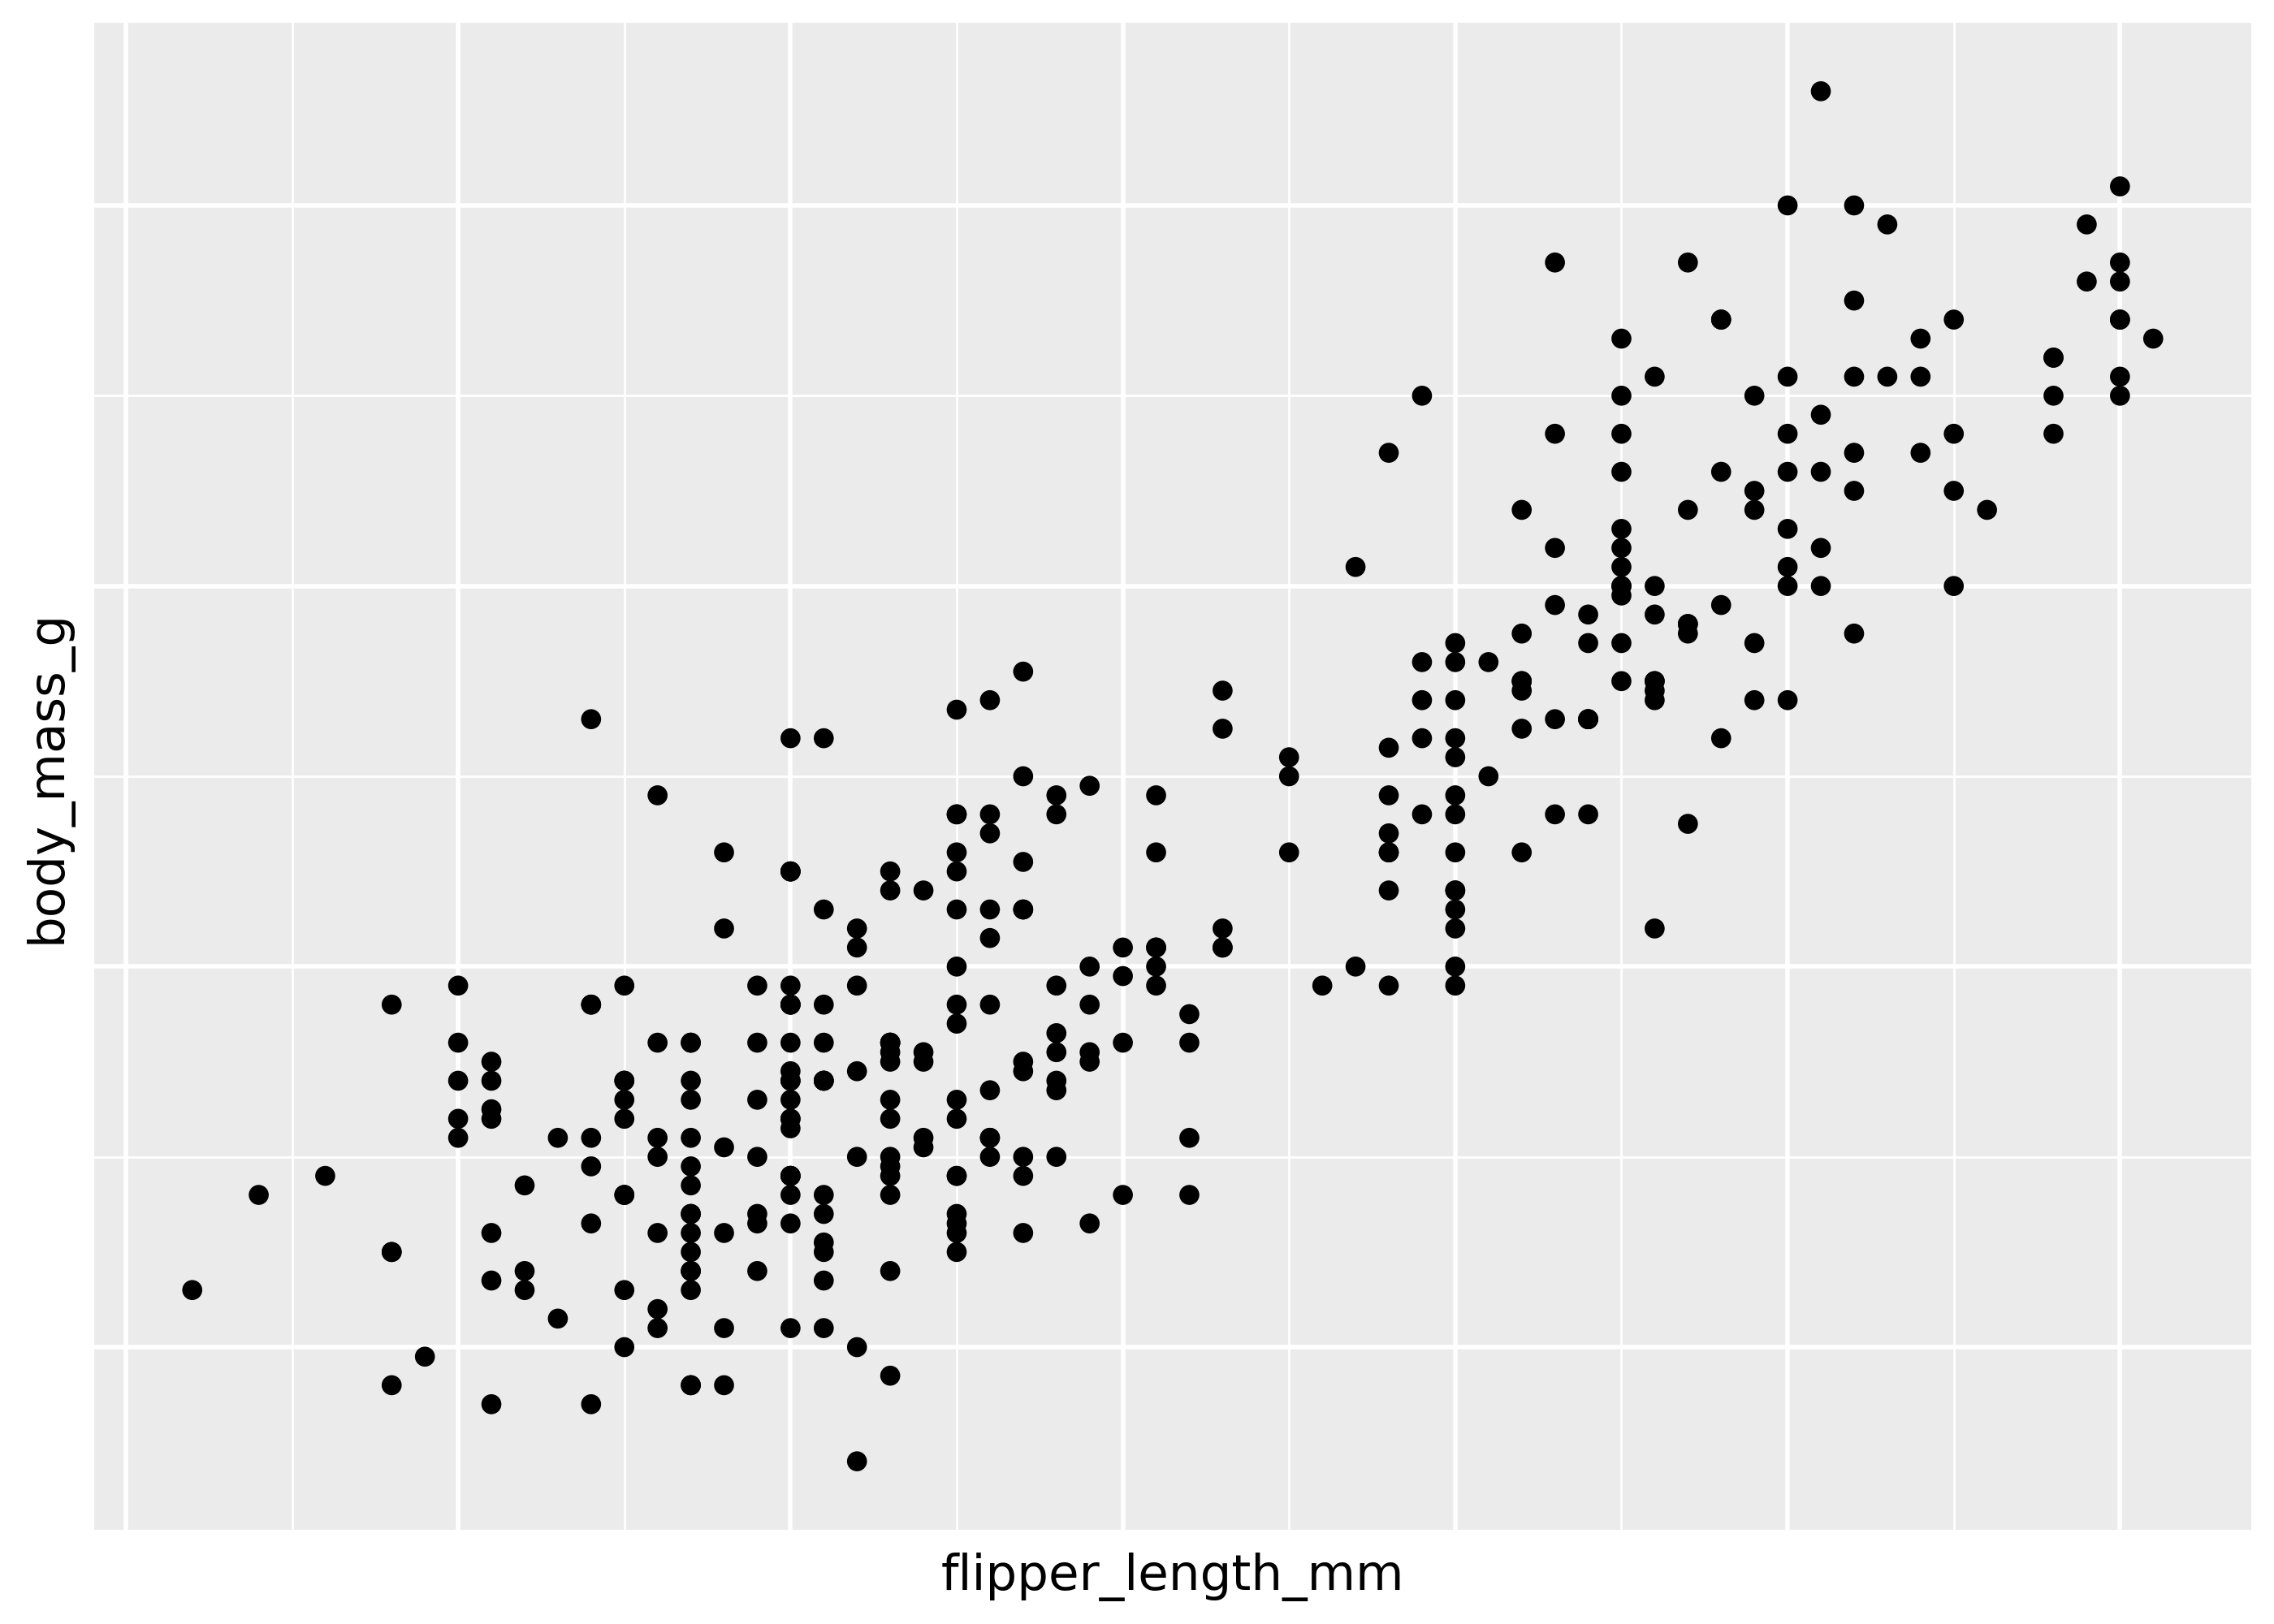
Blanking elements
Use element_blank() to remove theme elements from a plot.
The code below removes the x- and y-axis text and tick marks.
(
    ggplot(penguins, aes(x="flipper_length_mm", y="body_mass_g"))
    + geom_point()
    + theme(
        axis_text=element_blank(),
        axis_ticks=element_blank(),
    )
)
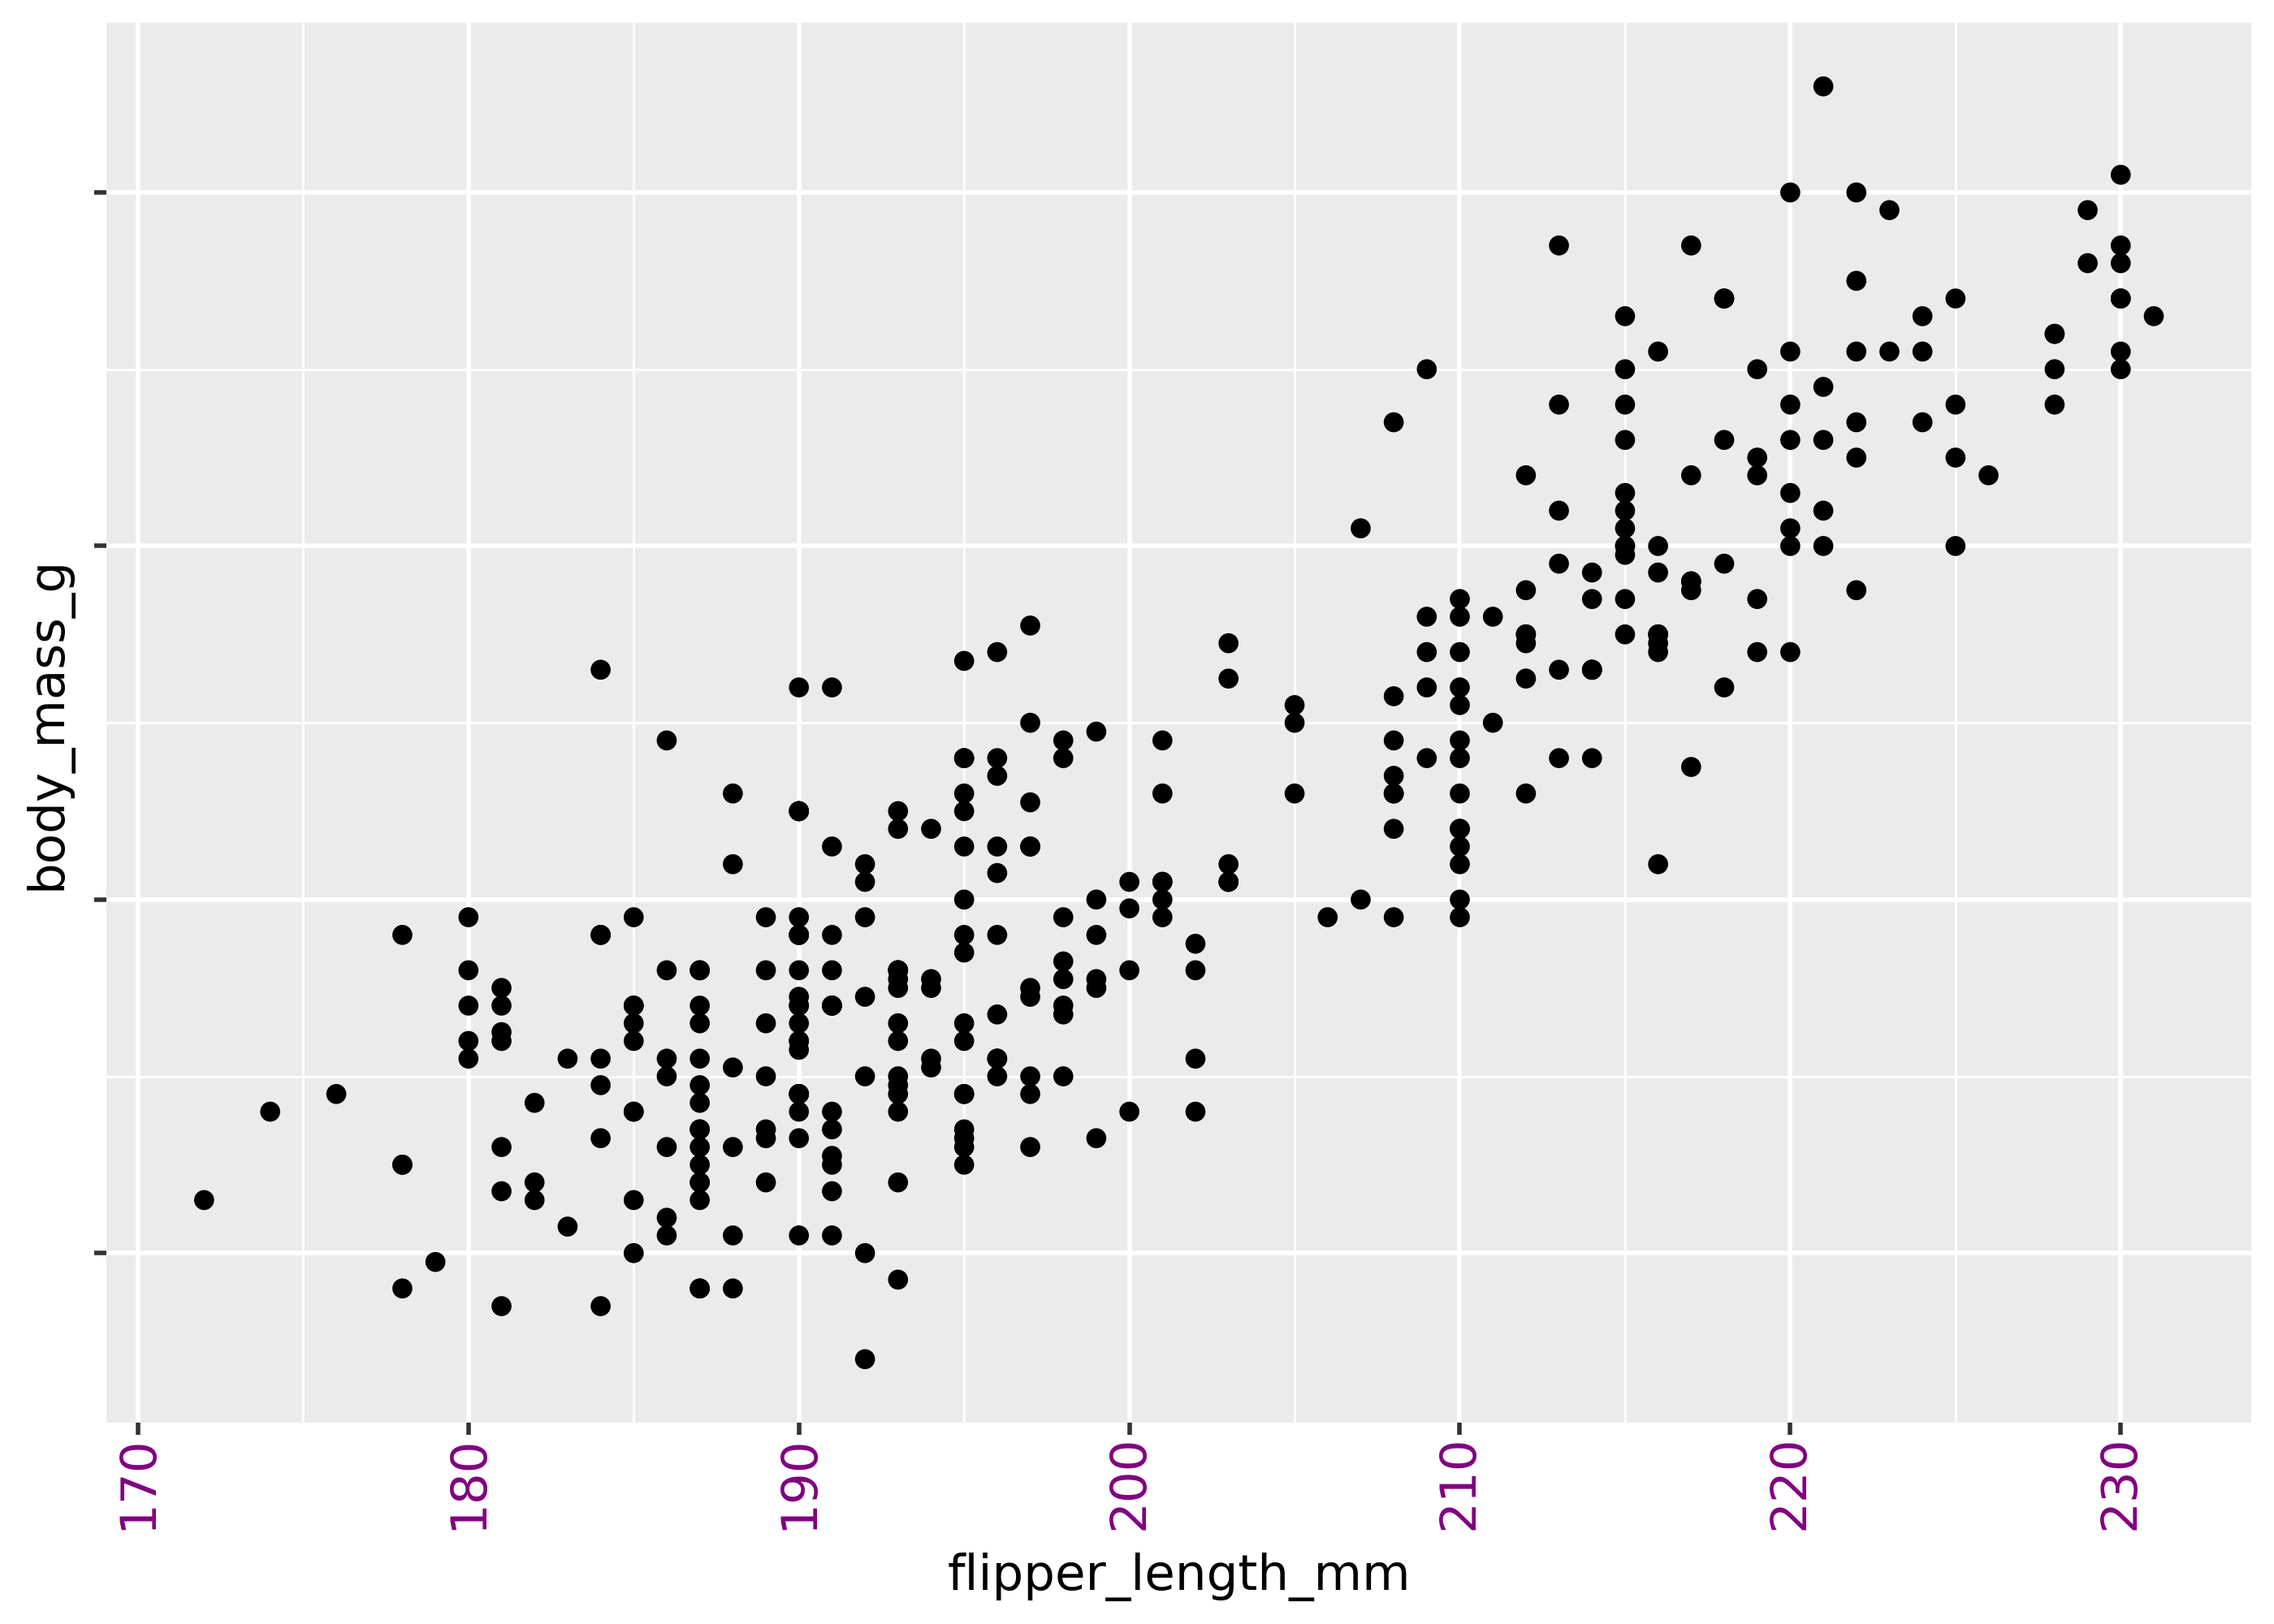
Inherited elements
Some arguments like theme(axis_text=...) set the default for multiple pieces (in this case axis_text_x and axis_text_y). For example, the code below blanks out the x- and y-axis text by default, but then sets the x-axis text to be purple.
(
    ggplot(penguins, aes(x="flipper_length_mm", y="body_mass_g"))
    + geom_point()
    + theme(
        axis_text=element_blank(),
        axis_text_x=element_text(angle=90, color="purple"),
    )
)
Creating a custom theme
Using a variable
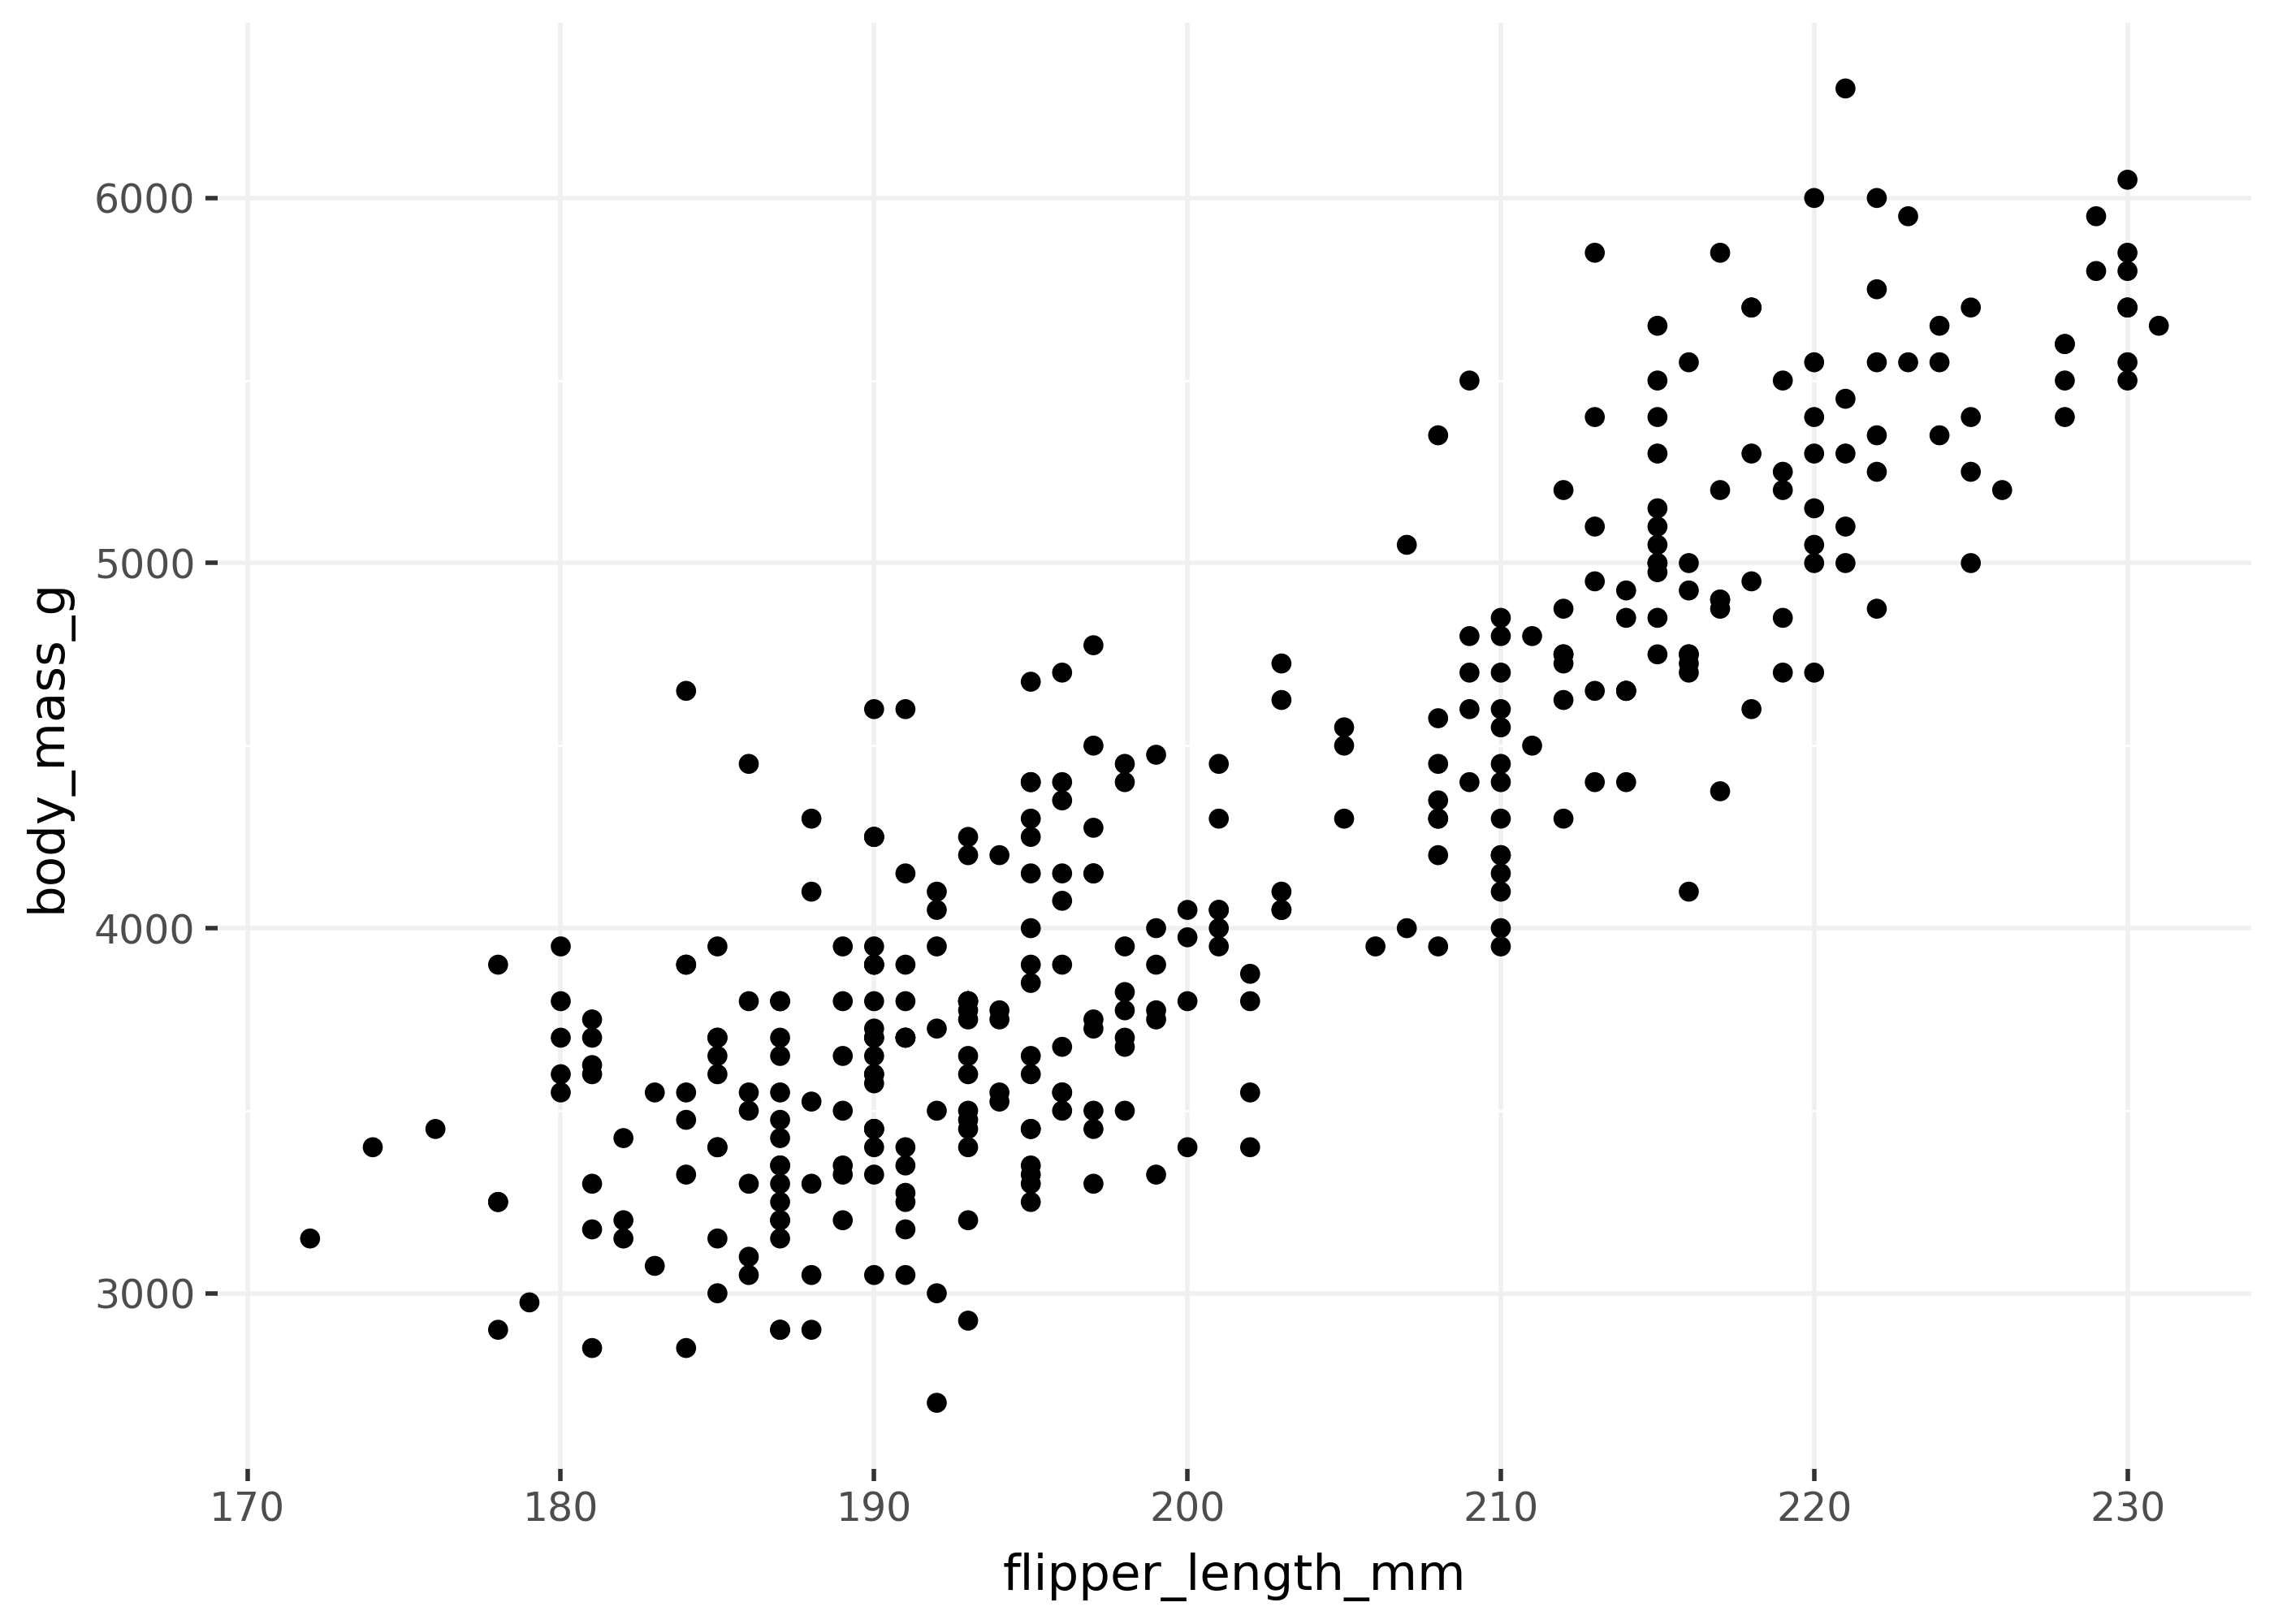
Save the result of theme() to a variable to reuse it across plots.
my_theme = theme(
    panel_background=element_rect(fill="white"),
    panel_grid_major=element_line(color="#F0F0F0"),
)

(
    ggplot(penguins, aes(x="flipper_length_mm", y="body_mass_g"))
    + geom_point()
    + my_theme
)
Subclassing premade themes
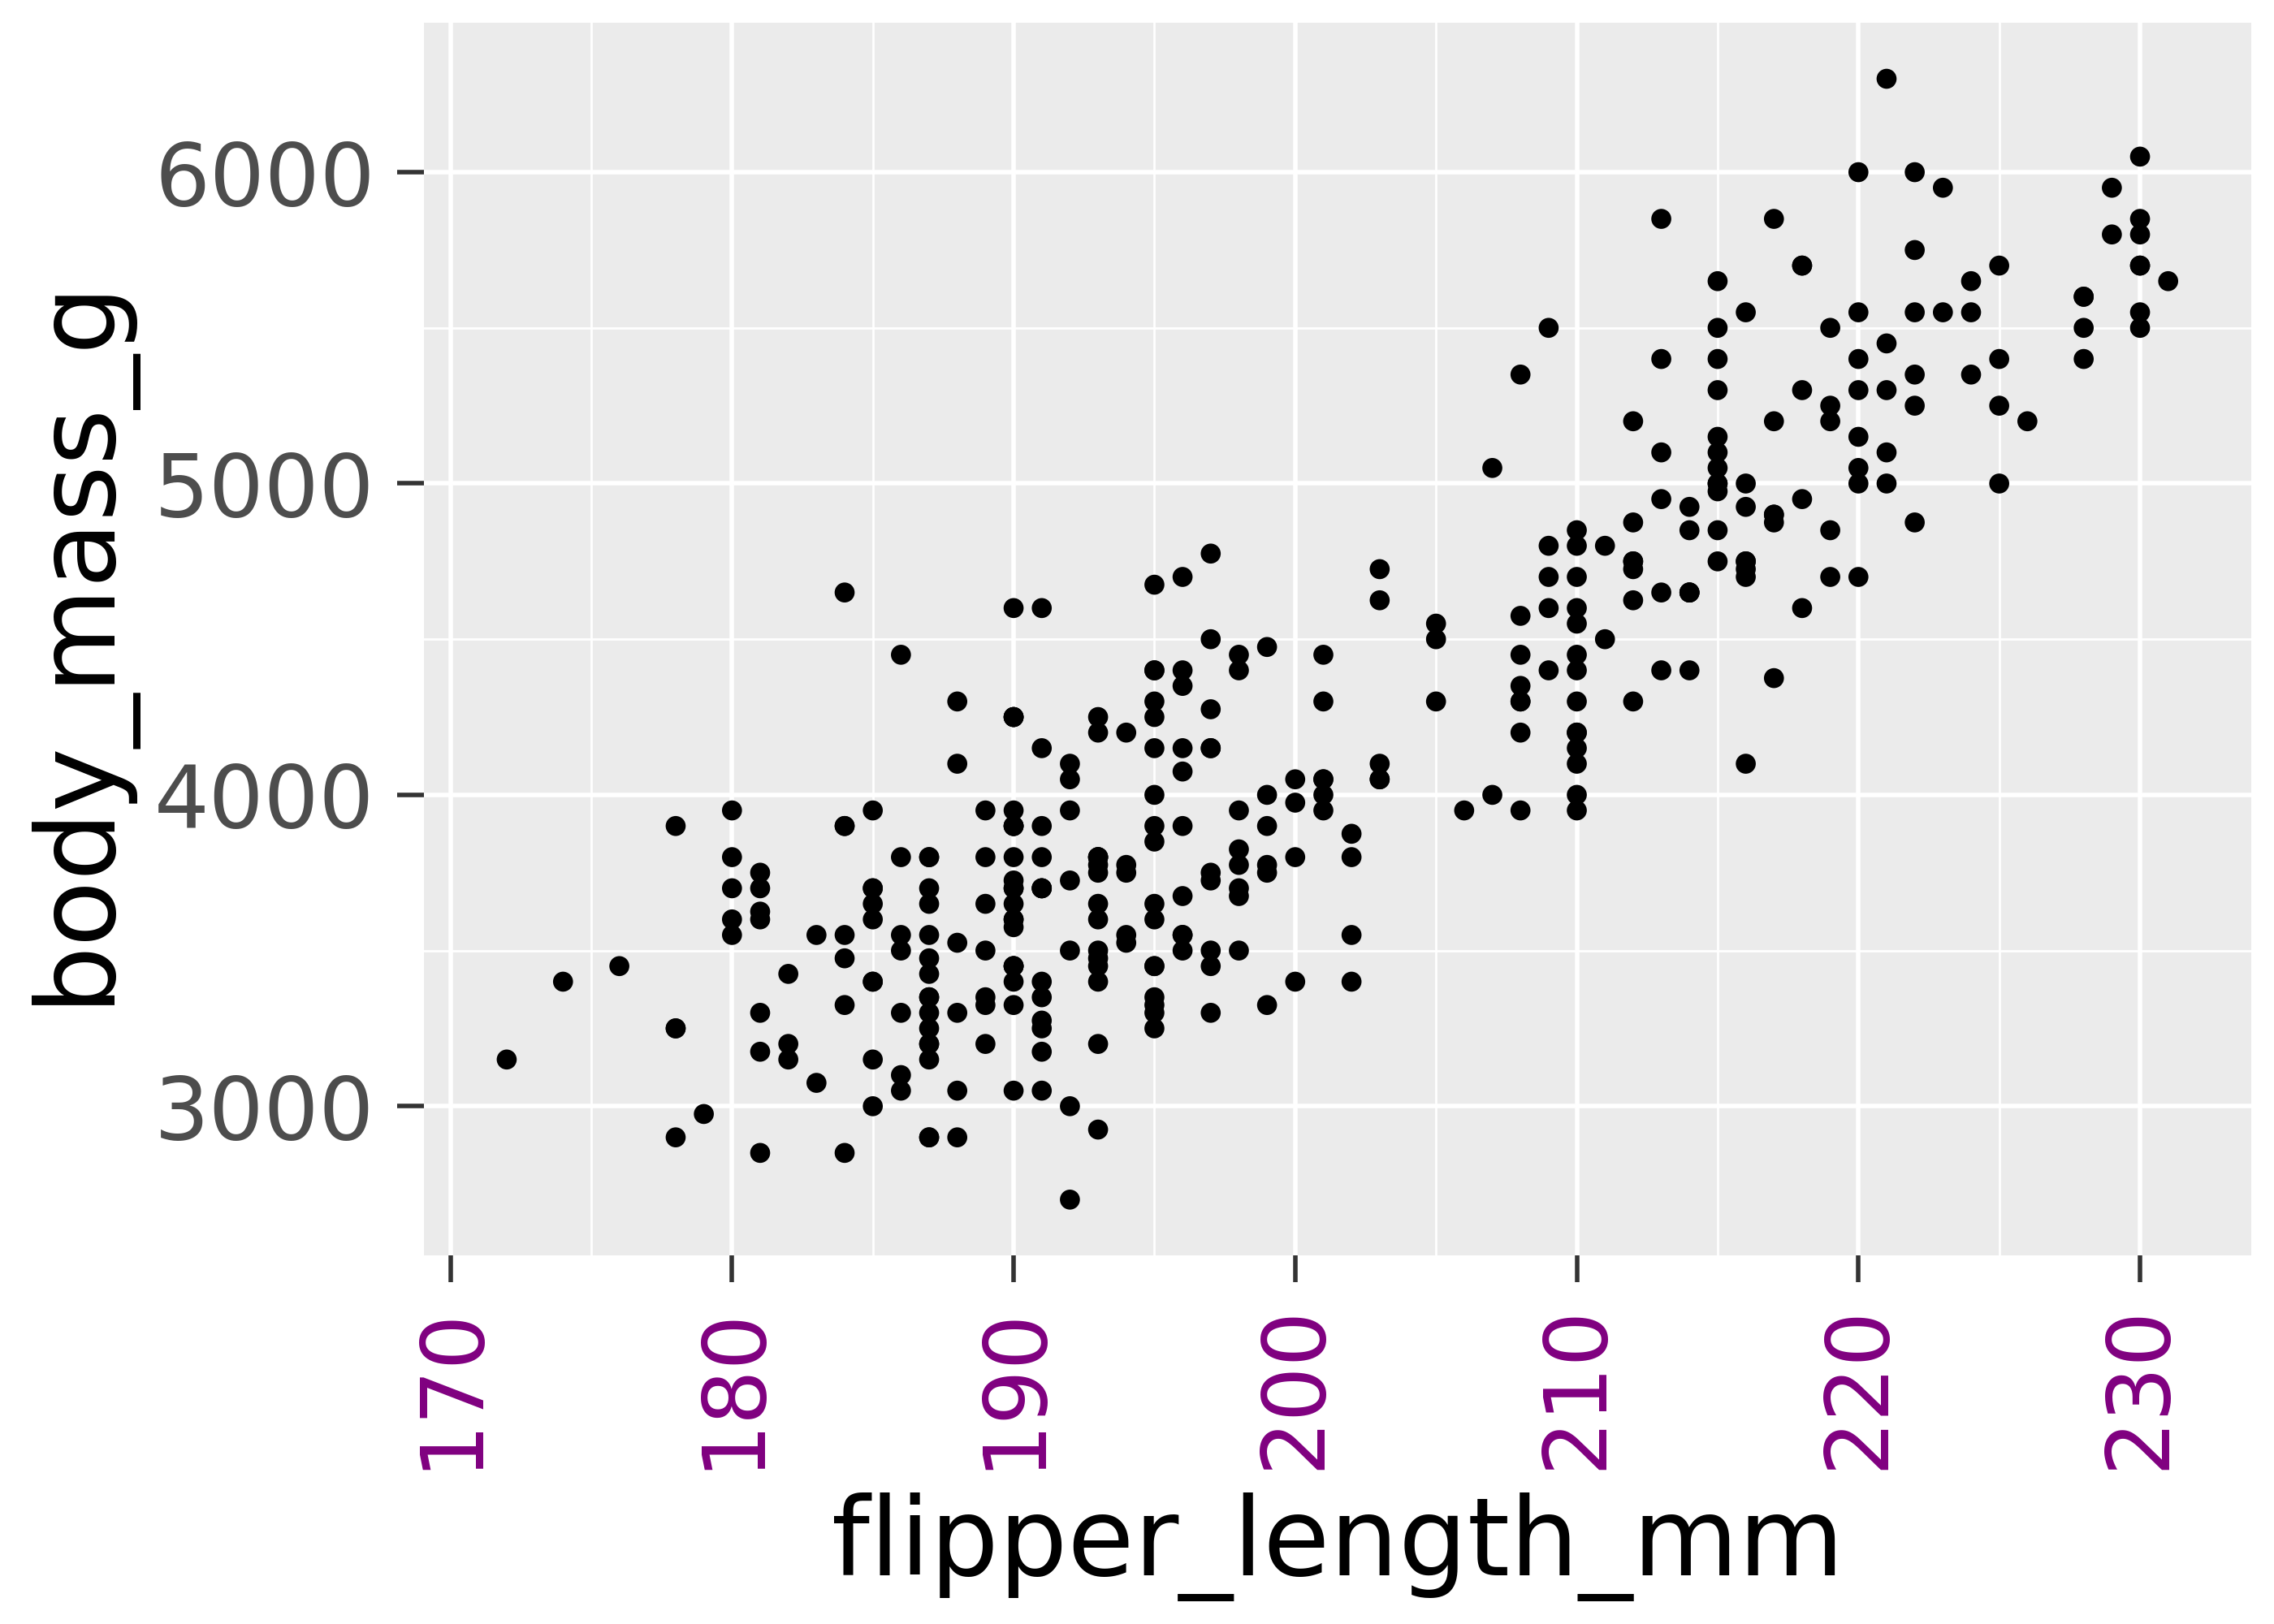
Note that many premade classes use a convenient base_size= argument, to apply a base size to many text elements. Sometimes it’s useful to subclass these premades, and then add your own customizations.
class custom_theme(theme_gray):
    def __init__(self, base_size=11, base_family=None):
        super().__init__(base_size=base_size, base_family=base_family)
        self += theme(axis_text_x=element_text(angle=90, color="purple"))


p = ggplot(penguins, aes(x="flipper_length_mm", y="body_mass_g")) + geom_point()

p + custom_theme()
p + custom_theme(base_size=24)