from plotnine import *
import geodatasets
import geopandas as gp

chicago = gp.read_file(geodatasets.get_path("geoda.chicago_commpop"))
groceries = gp.read_file(geodatasets.get_path("geoda.groceries"))Maps
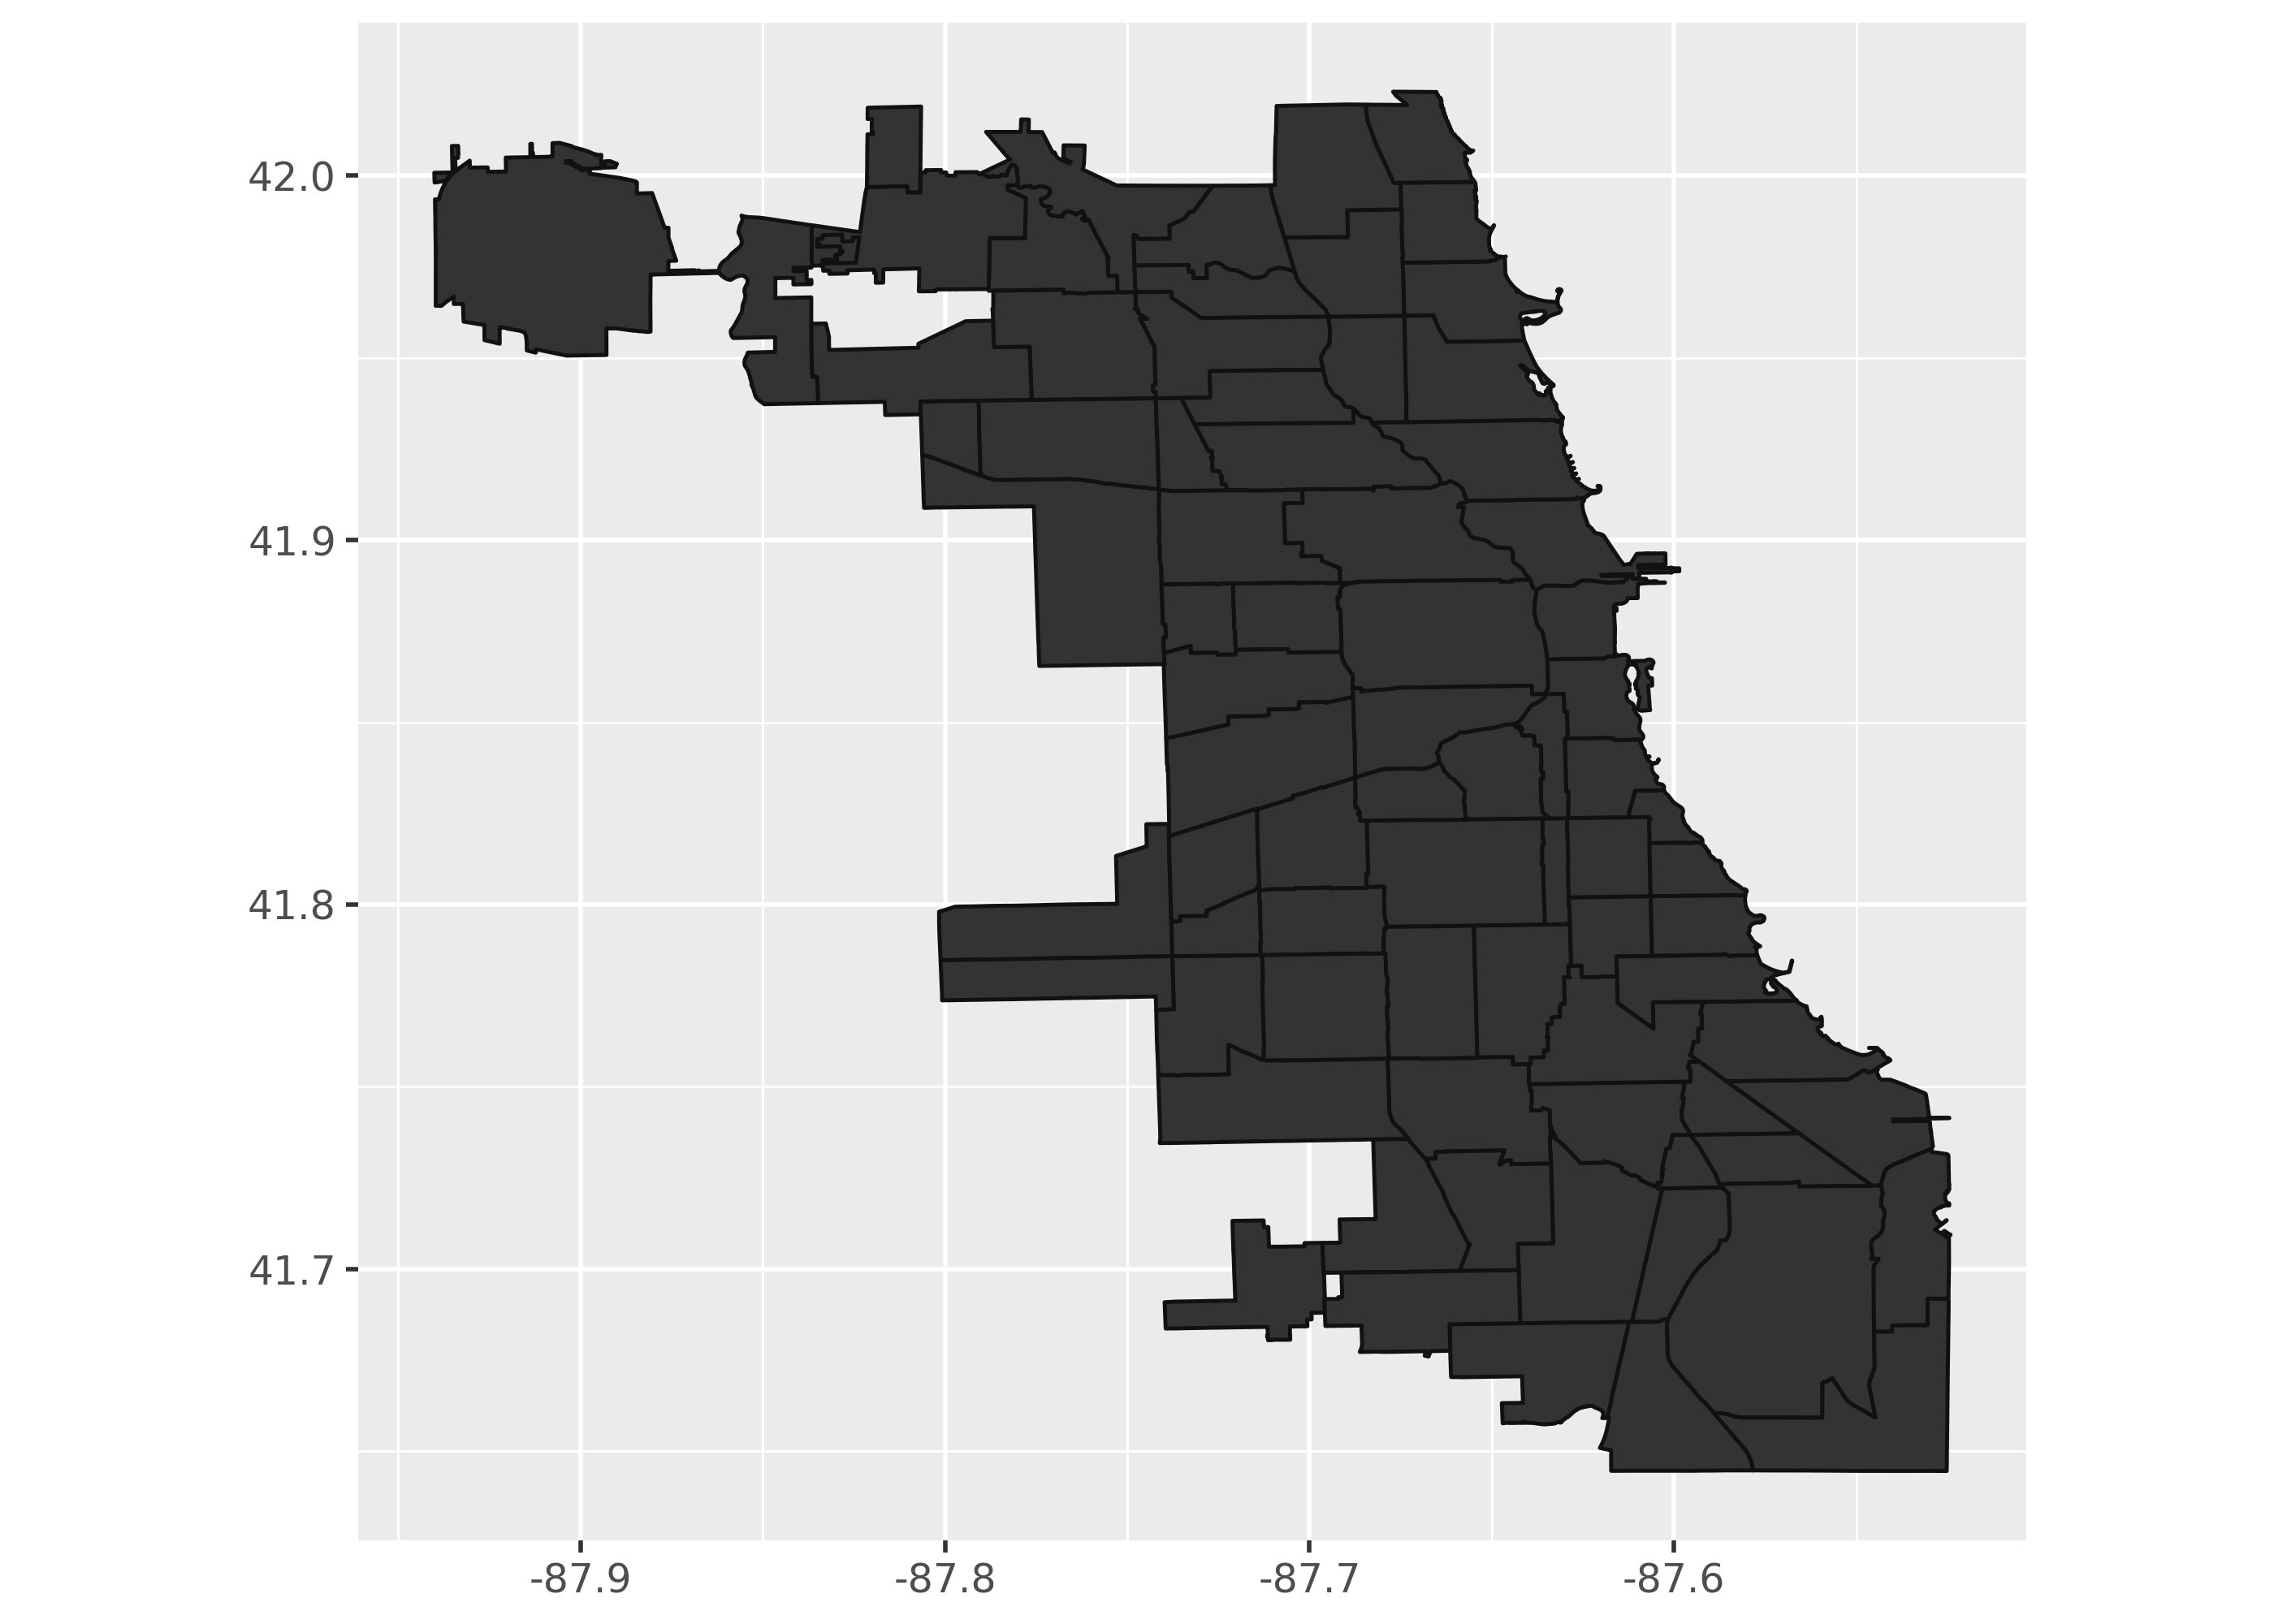
(
    ggplot(chicago)
    + geom_map()
    + coord_fixed()
)
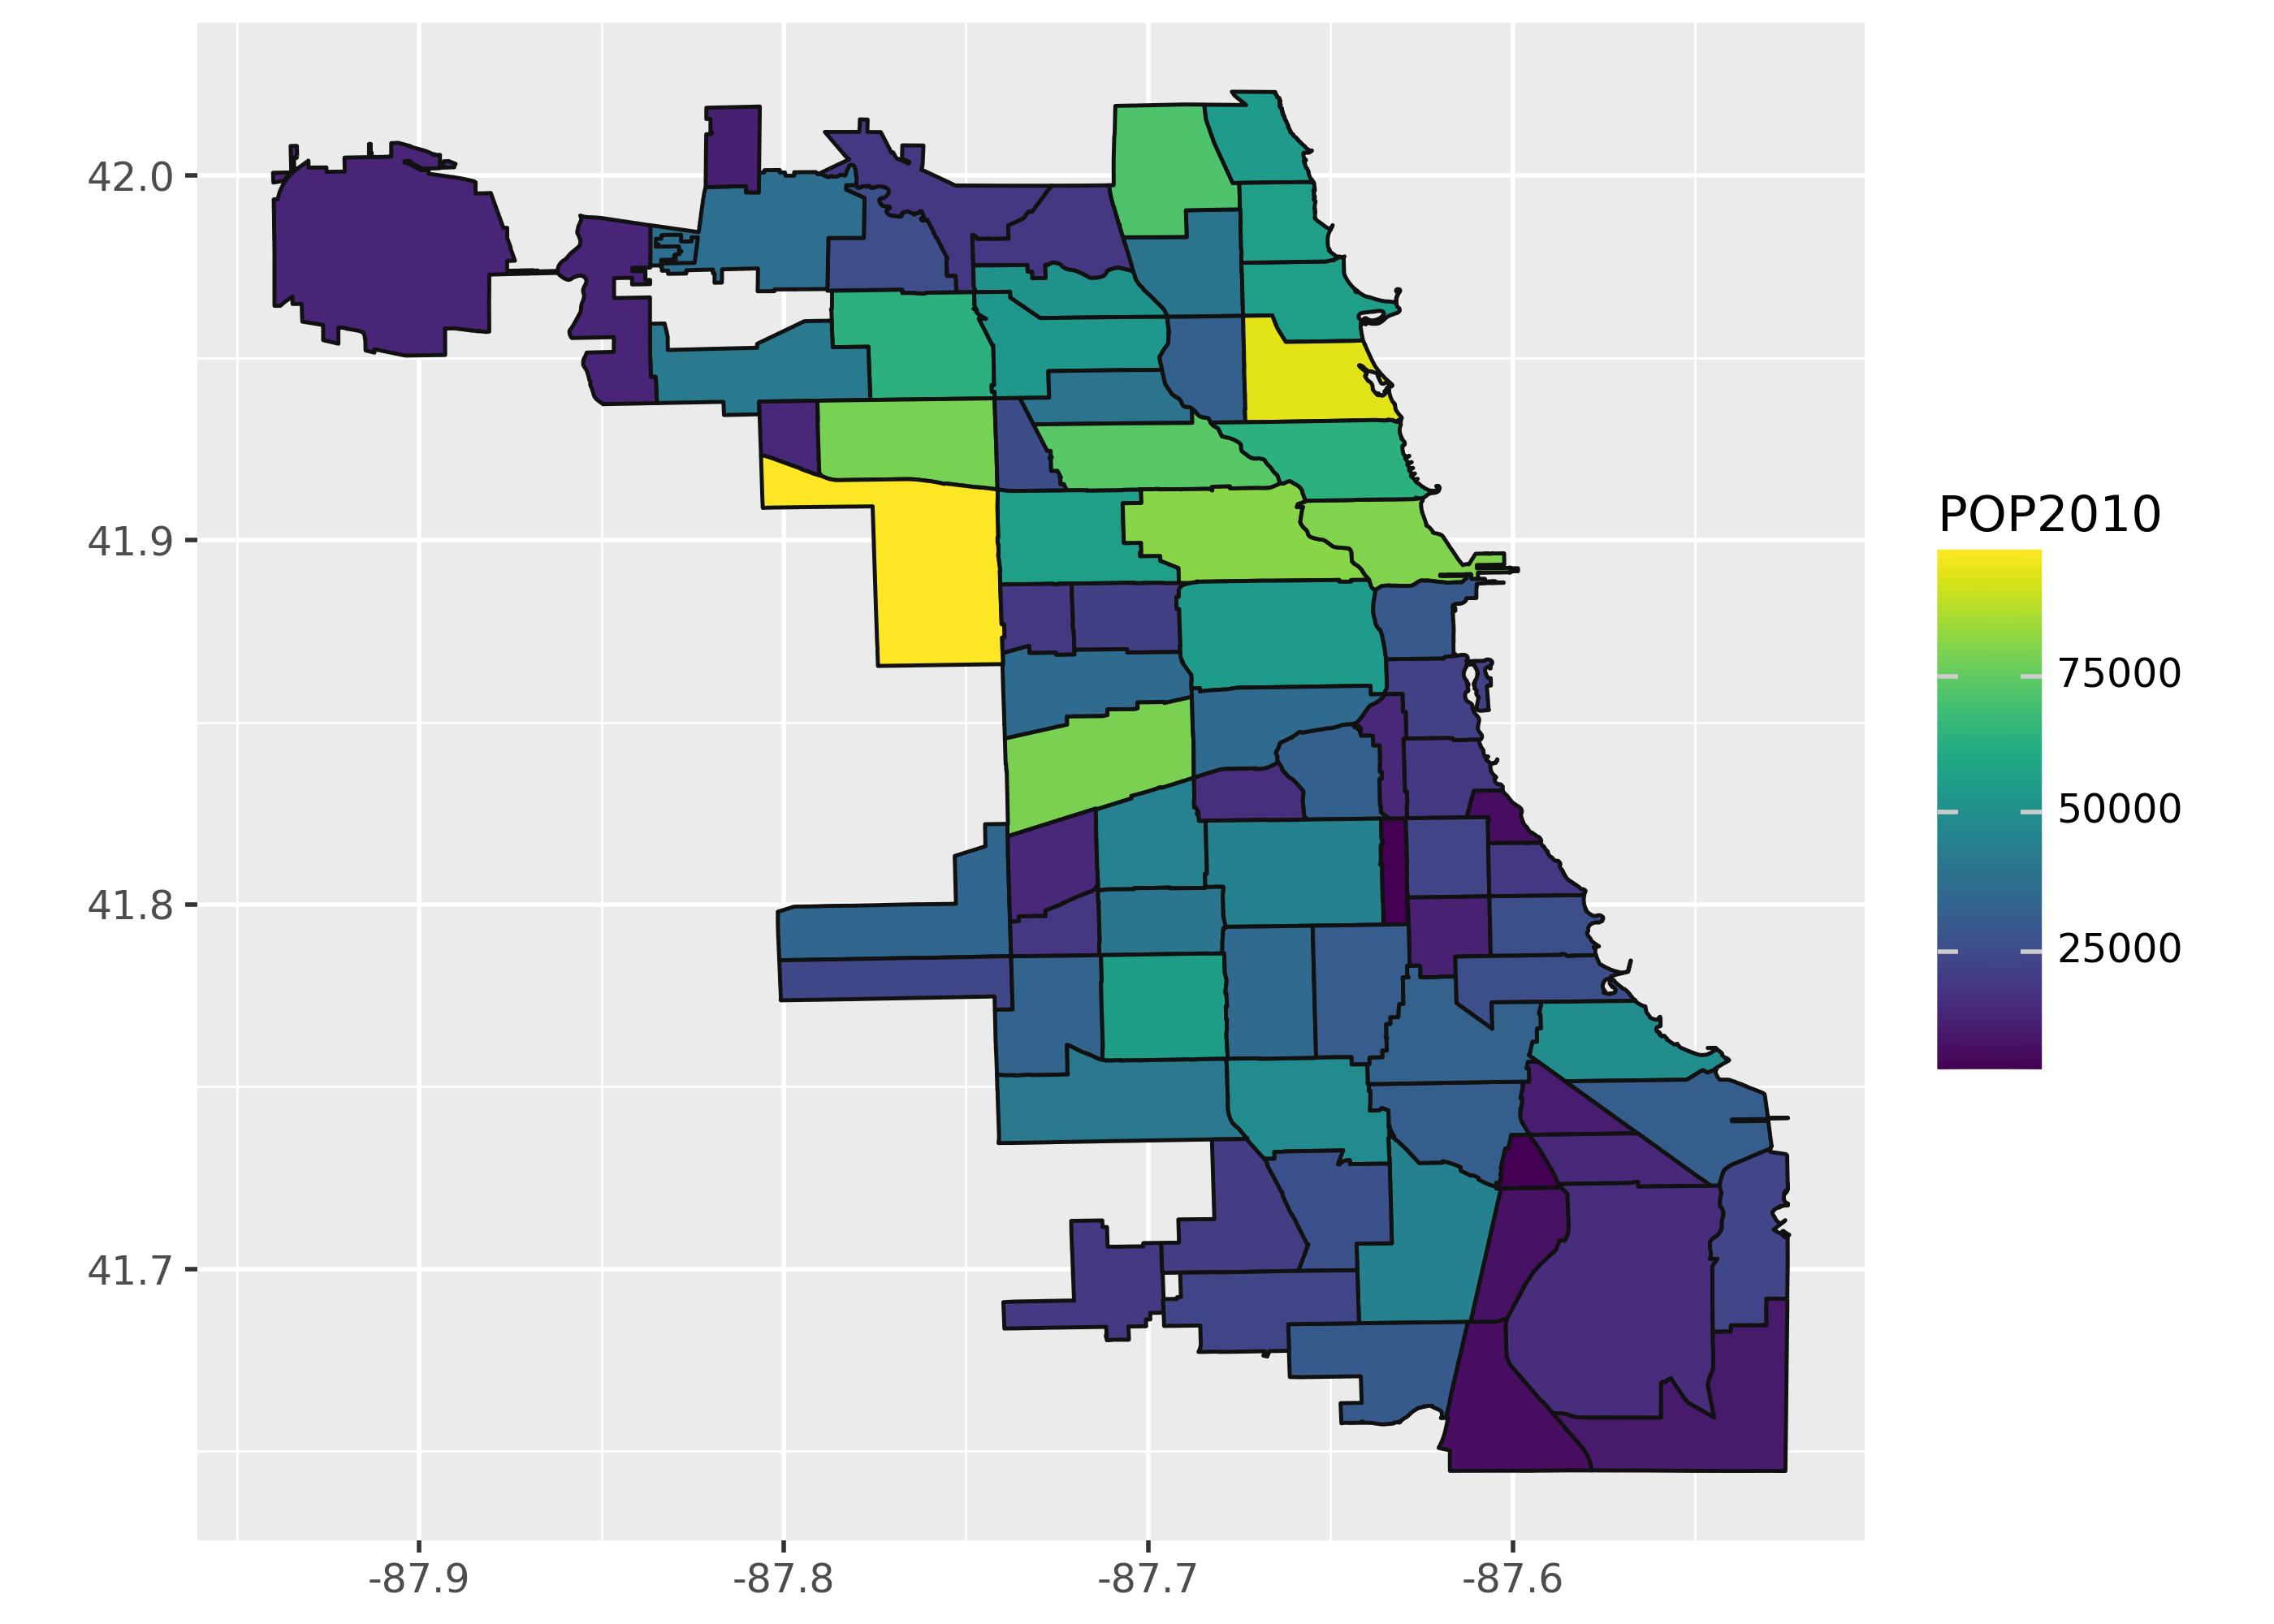
(
    ggplot(chicago, aes(fill="POP2010"))
    + geom_map()
    + coord_fixed()
)
(
    ggplot(chicago, aes(fill="POP2010"))
    + geom_map()
    #+ scale_fill_cmap('plasma')
    #+ scale_fill_gradientn(["green", "purple", "papayawhip"])
    #+ scale_fill_gradient(low="green", high="blue")
    #+ scale_fill_gradient2()
)
# scale_fill_gradient
# scale_fill_continuous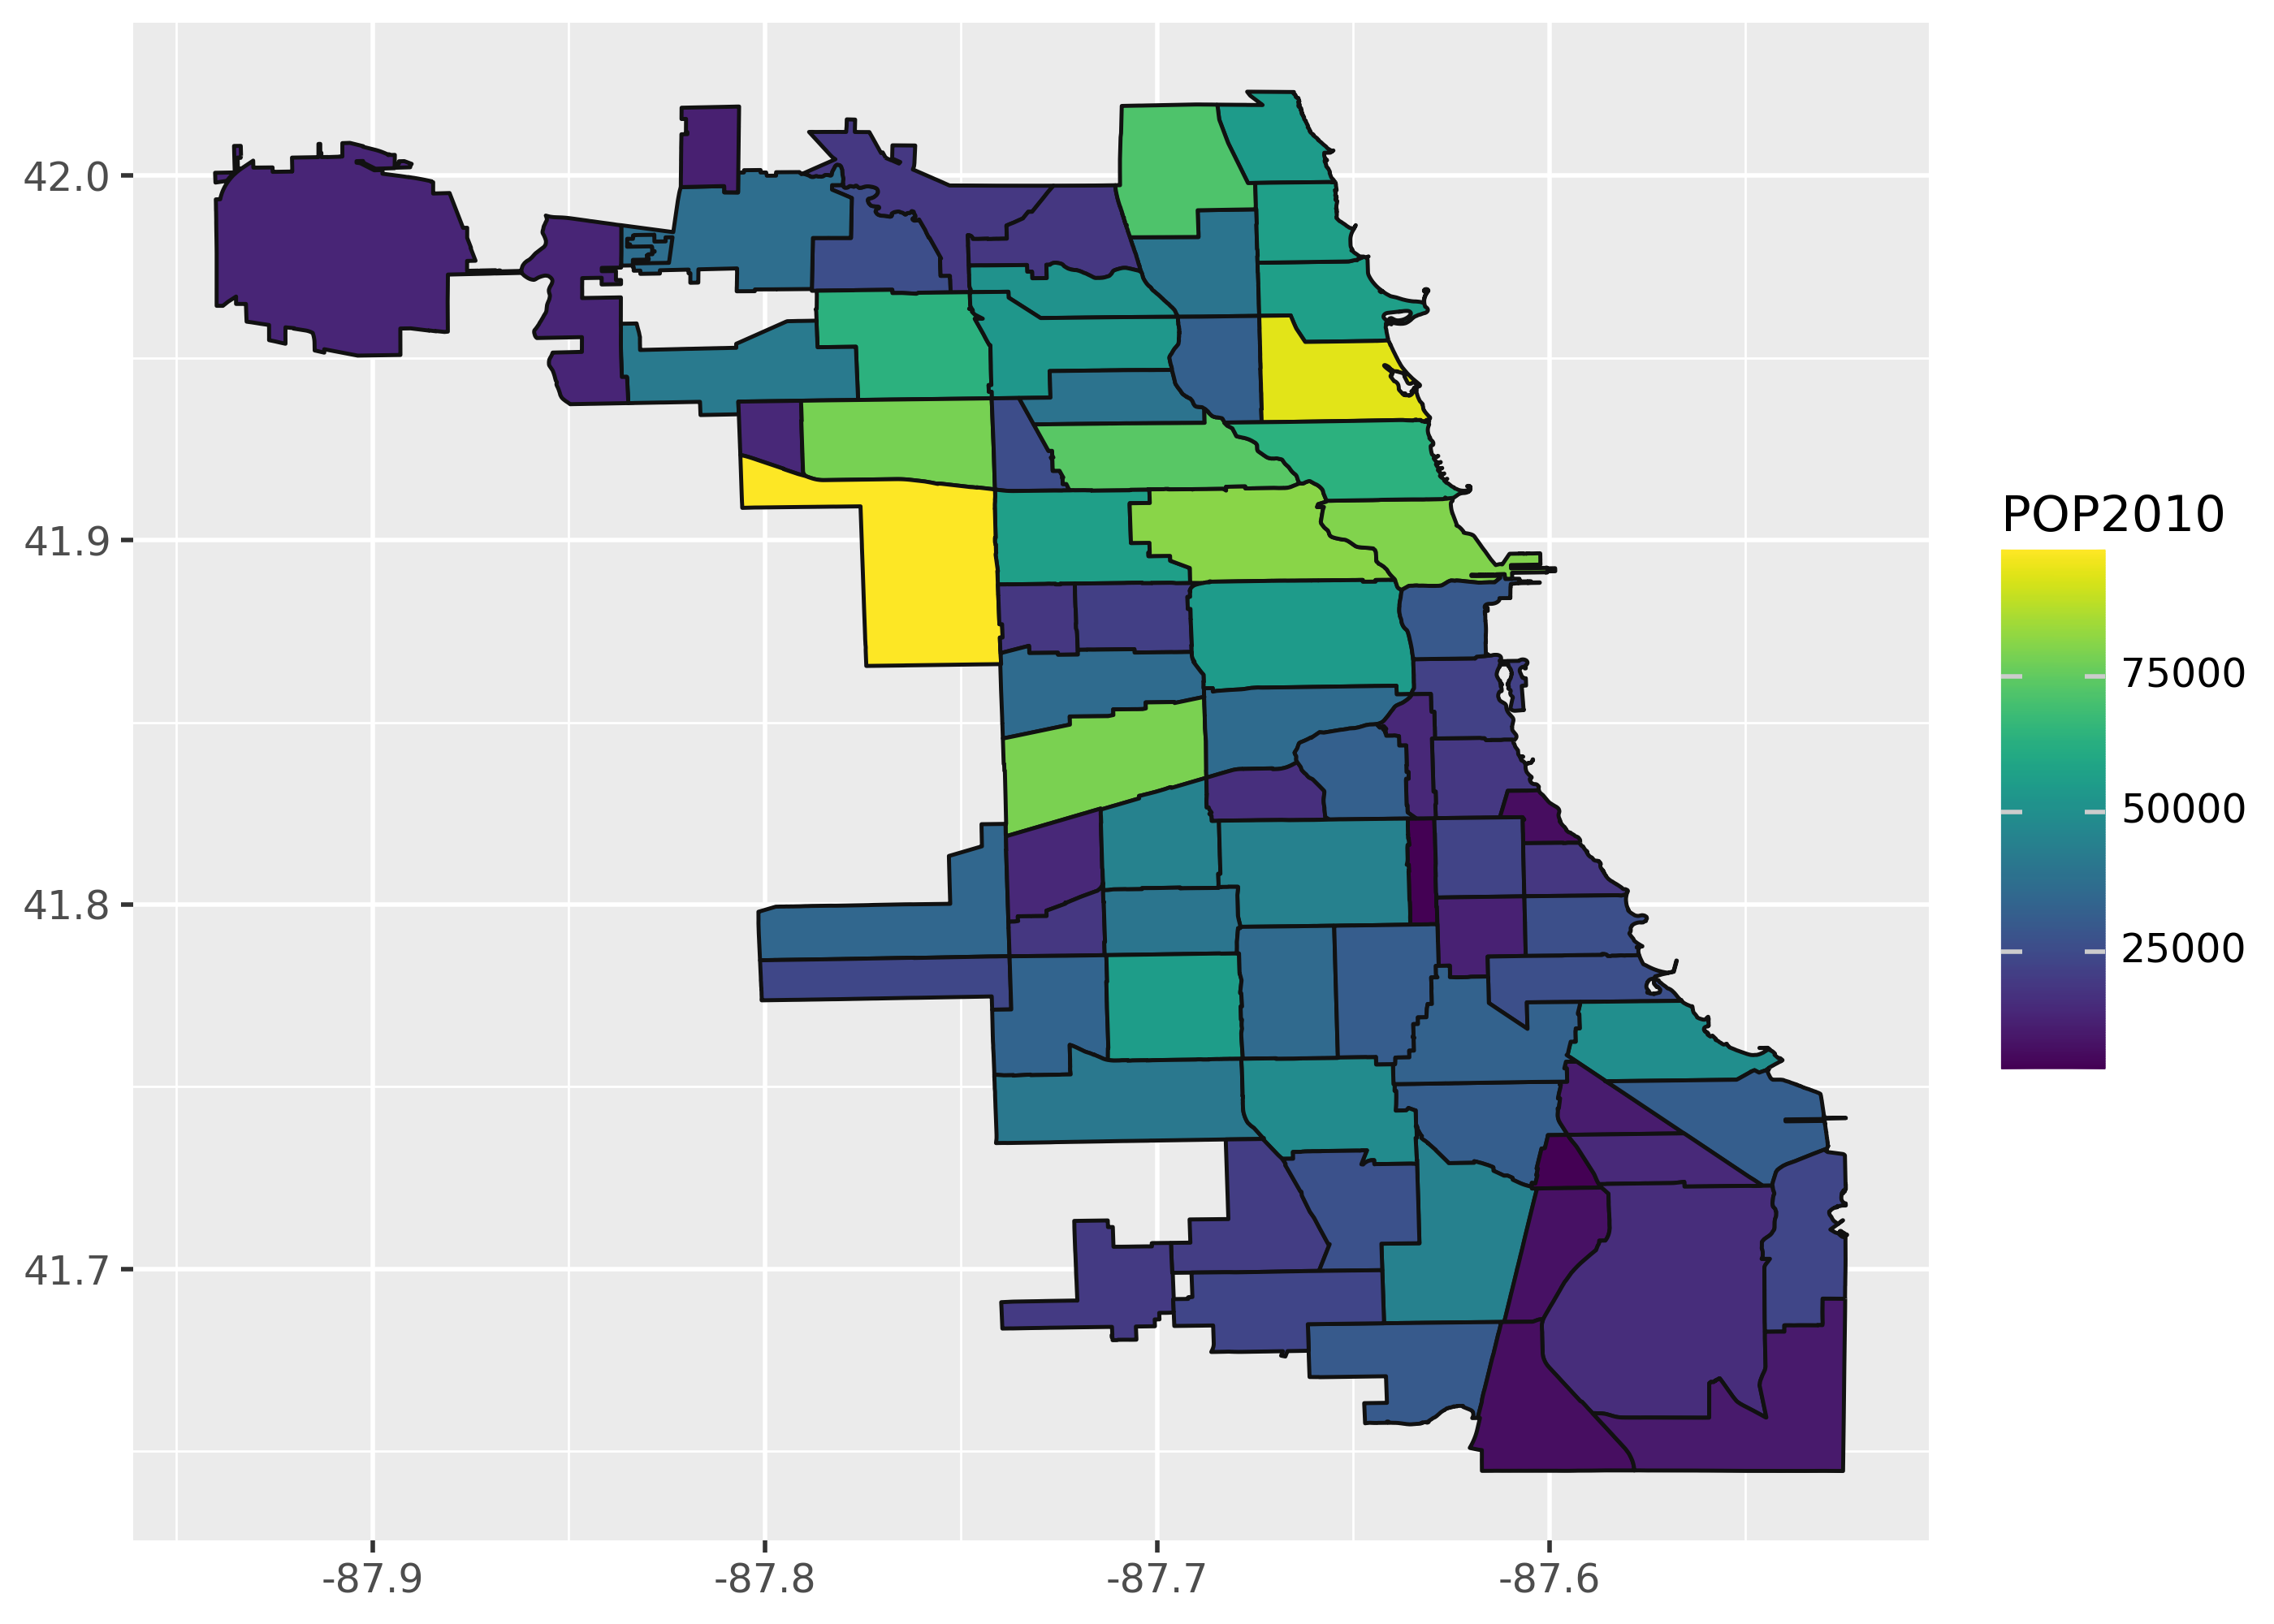
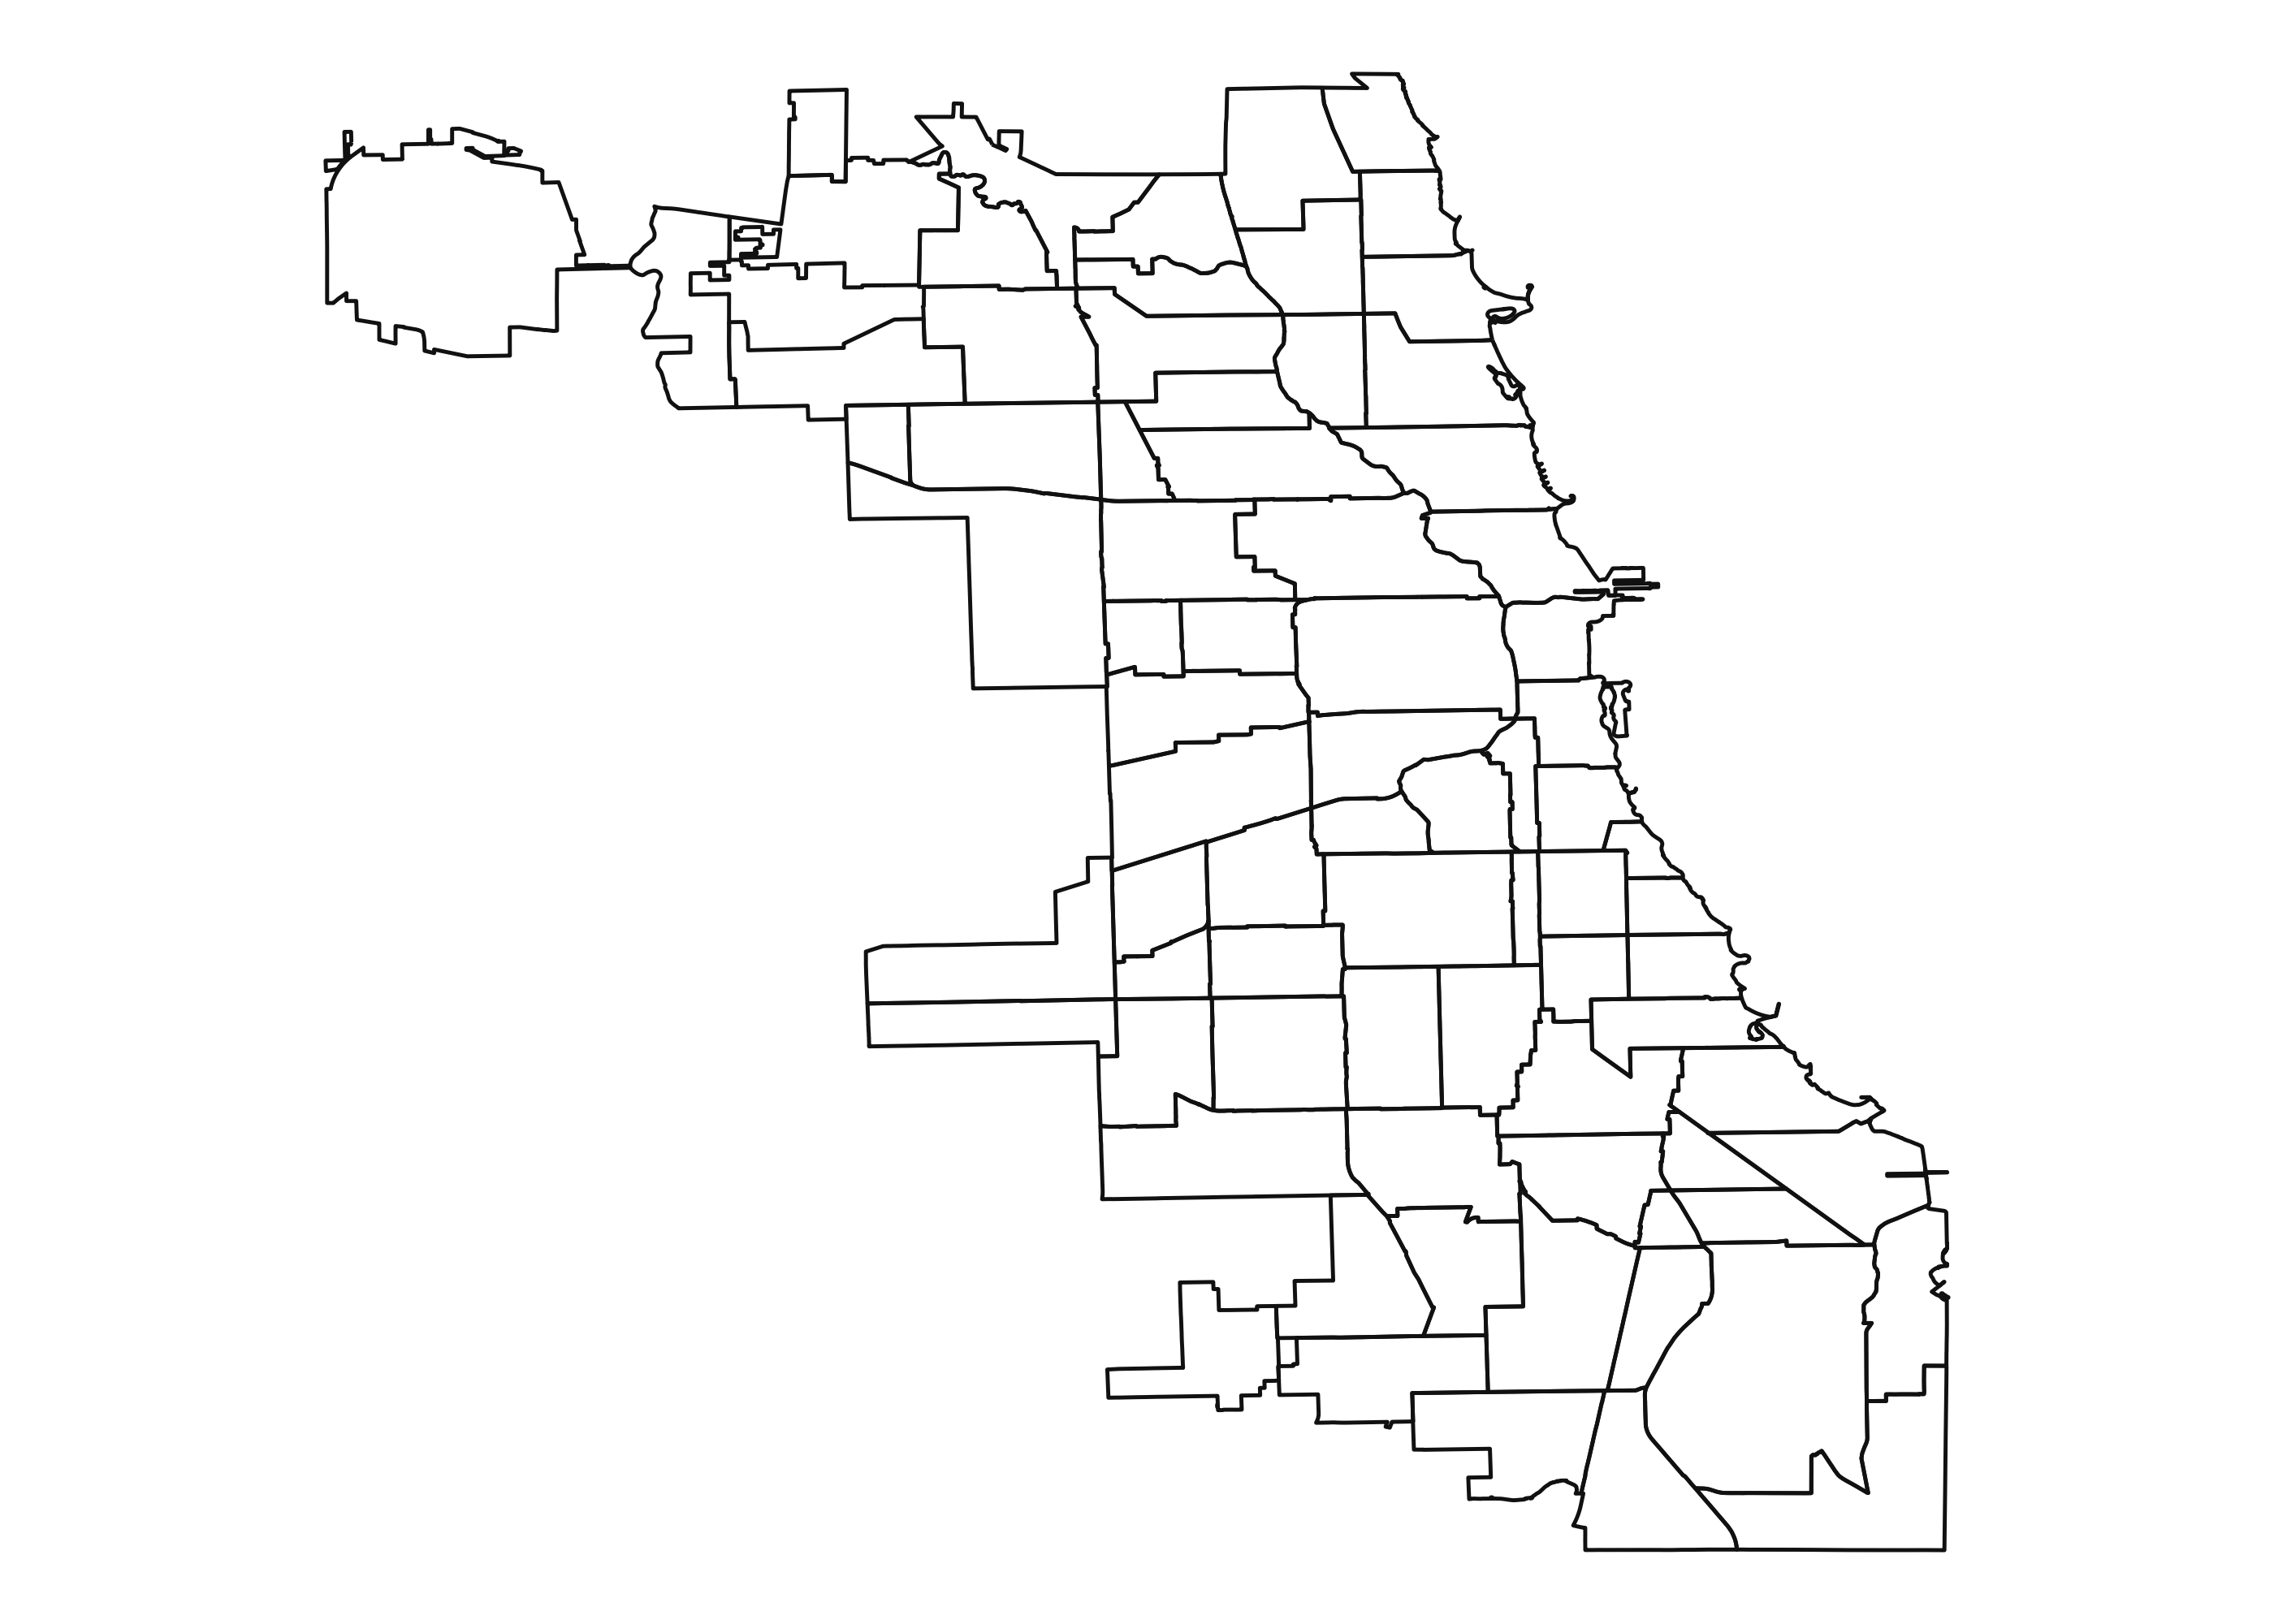
(
    ggplot(chicago)
    + geom_map(fill=None)
    #+ geom_map(fill=None)
    + theme_void()
    + coord_fixed()
)
Missing data
import numpy as np
chi_missing = chicago.copy()
chi_missing.loc[np.random.choice(chicago.index, 50), 'POP2010'] = np.nan
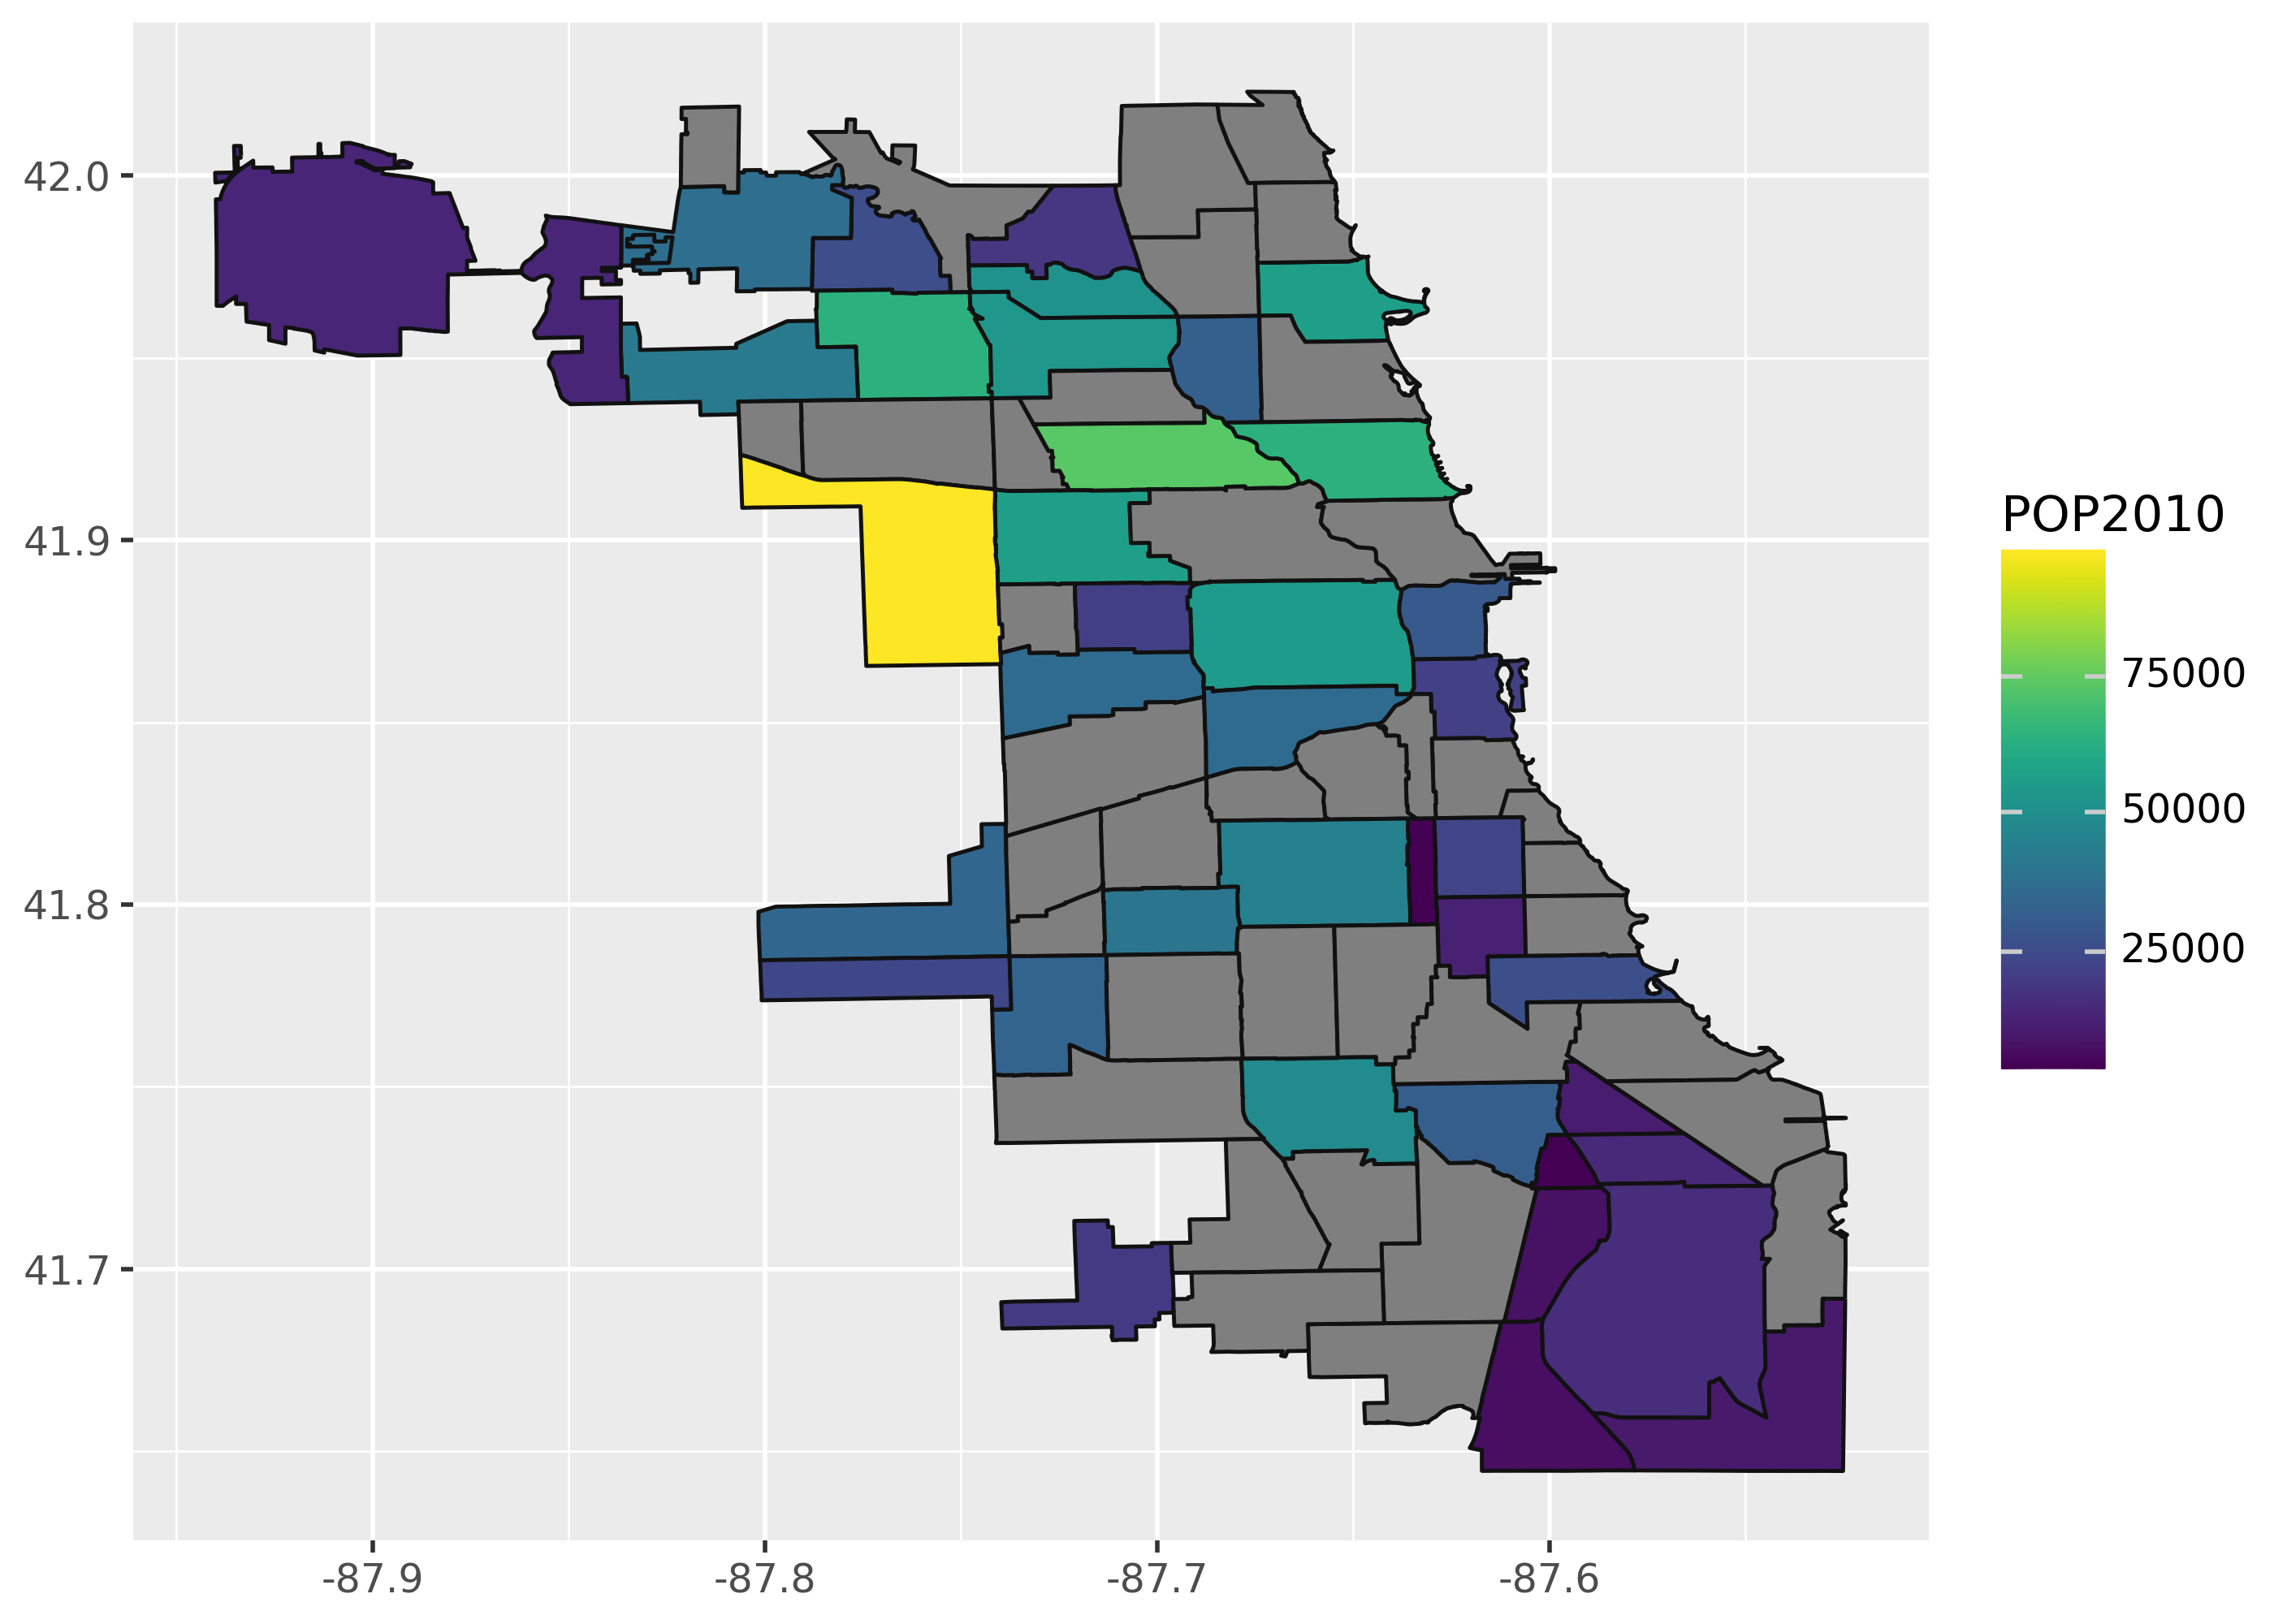
(
ggplot(chi_missing, aes(fill="POP2010"))
+ geom_map()
)
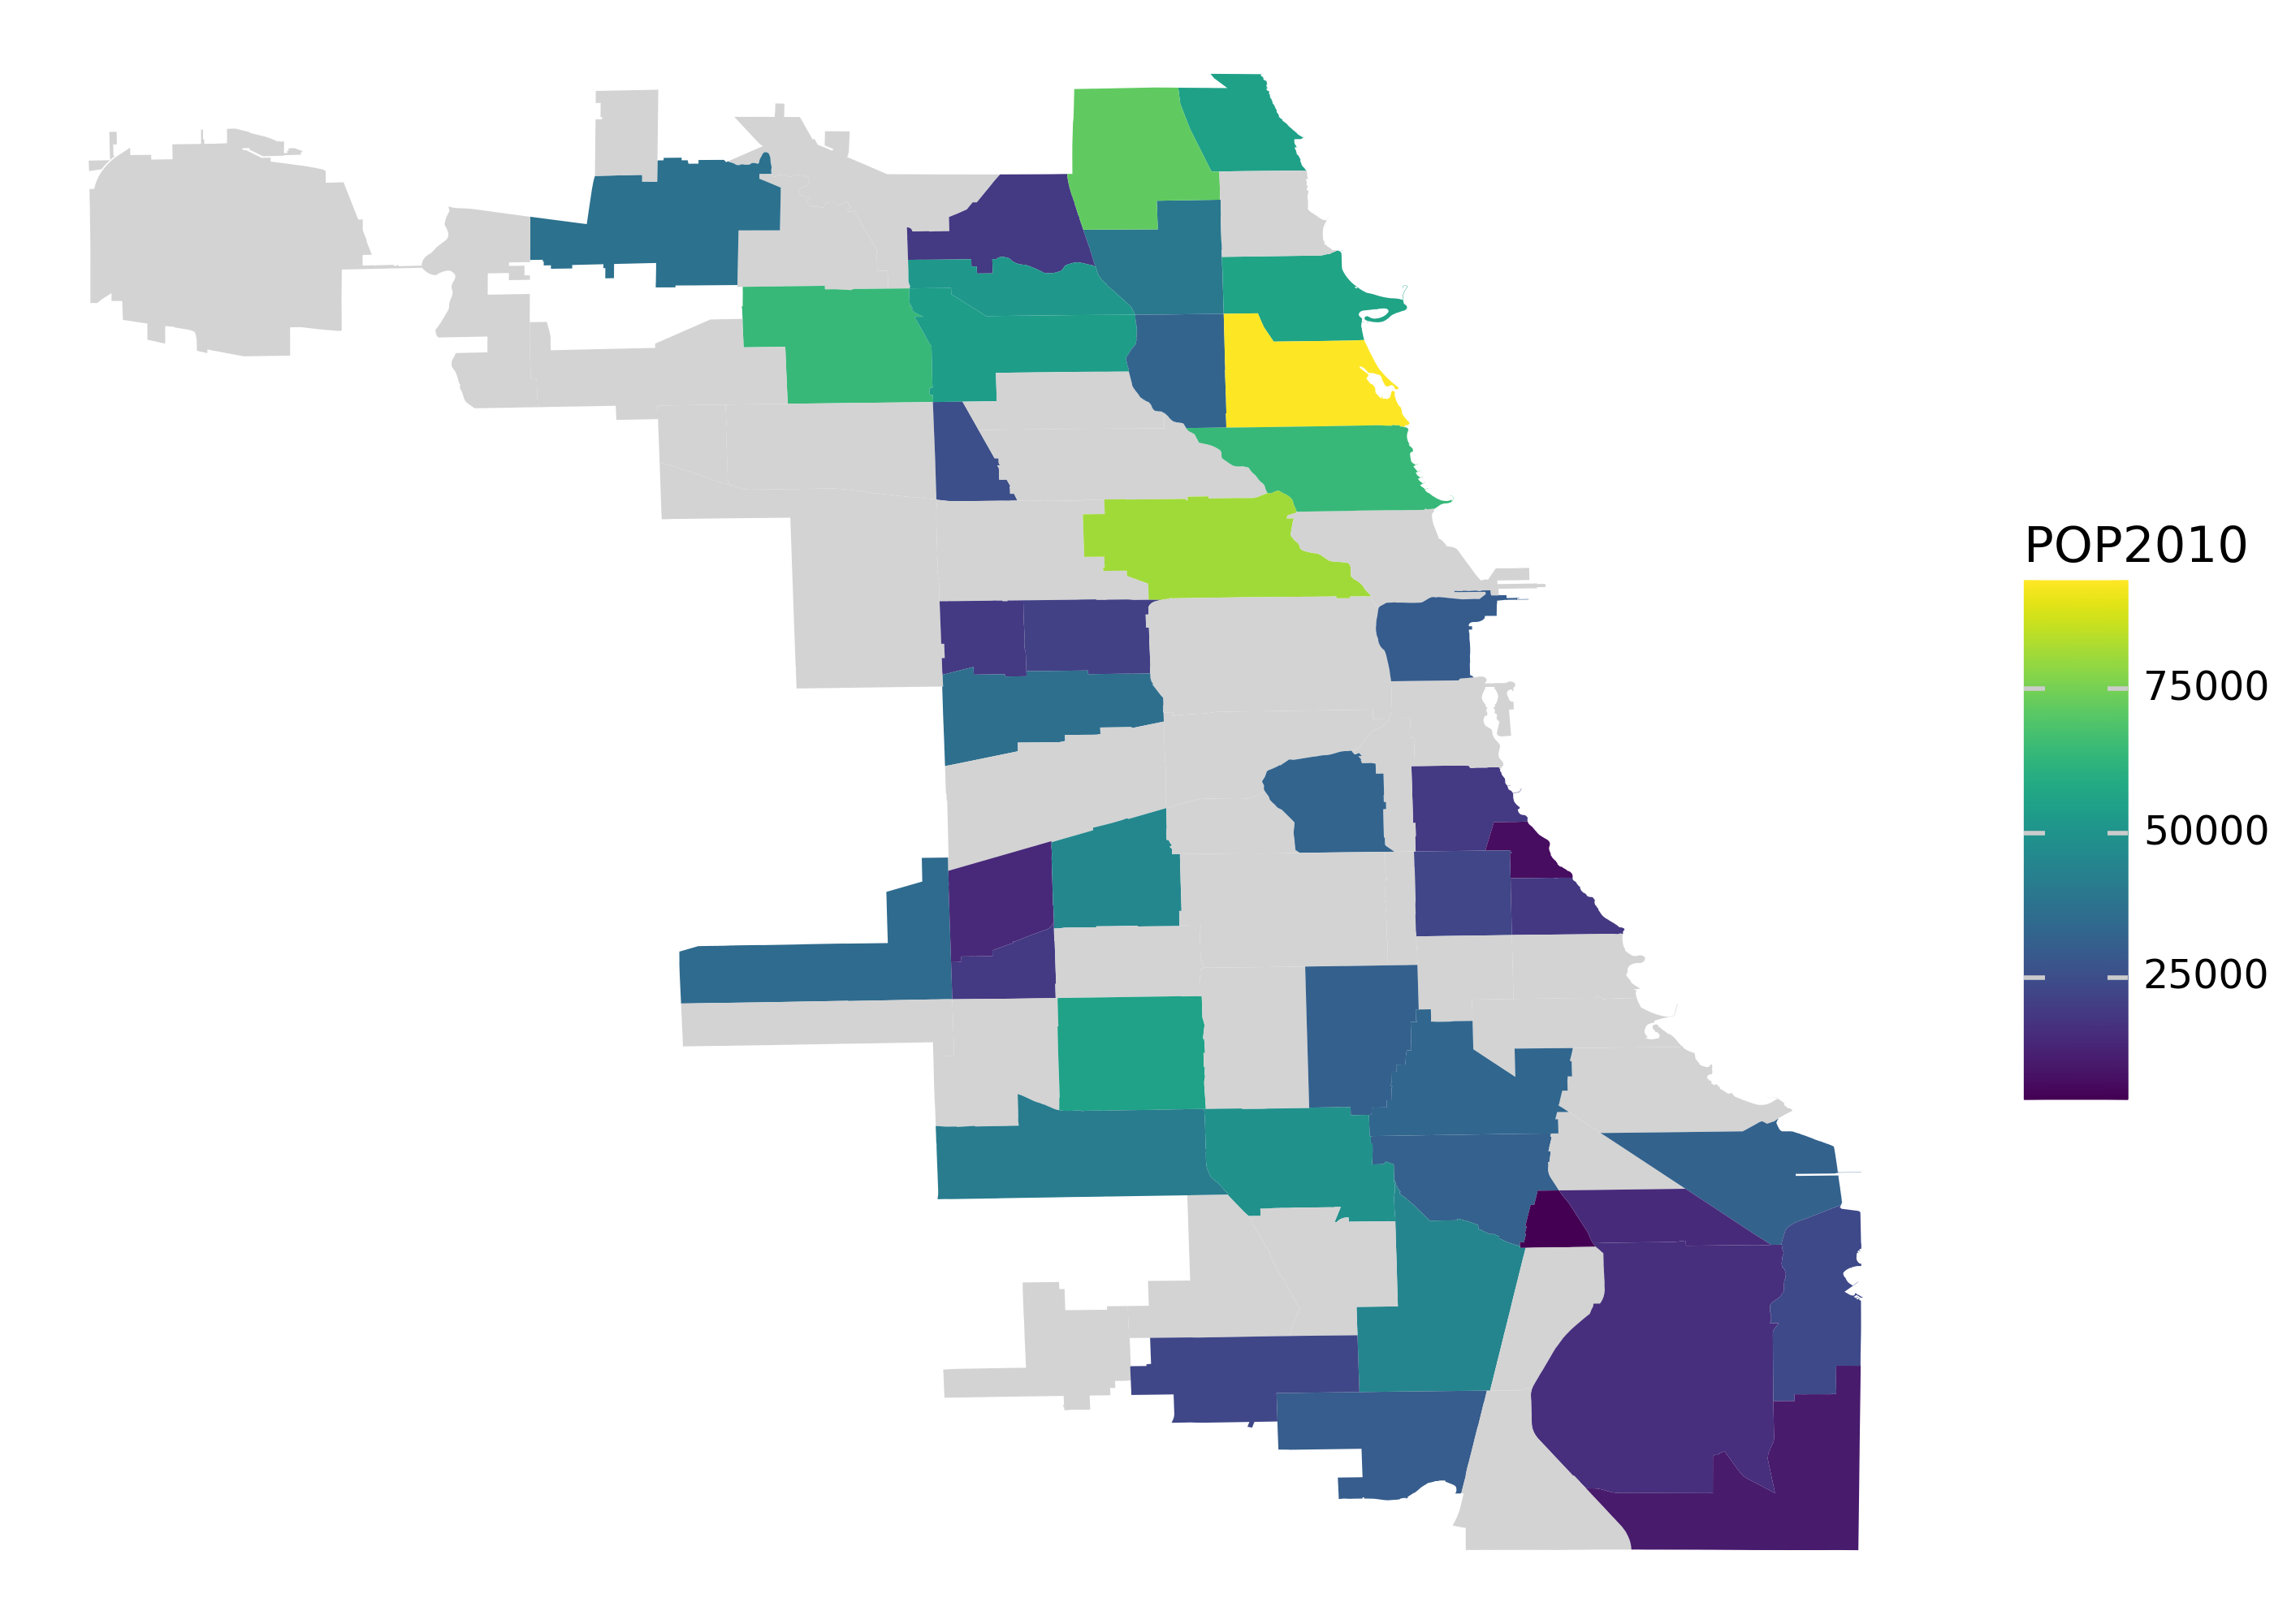
(
    ggplot(chi_missing, aes(fill="POP2010"))
    + geom_map(color="none")
    + theme_void()
    + scale_fill_continuous(na_value="lightgrey")
)
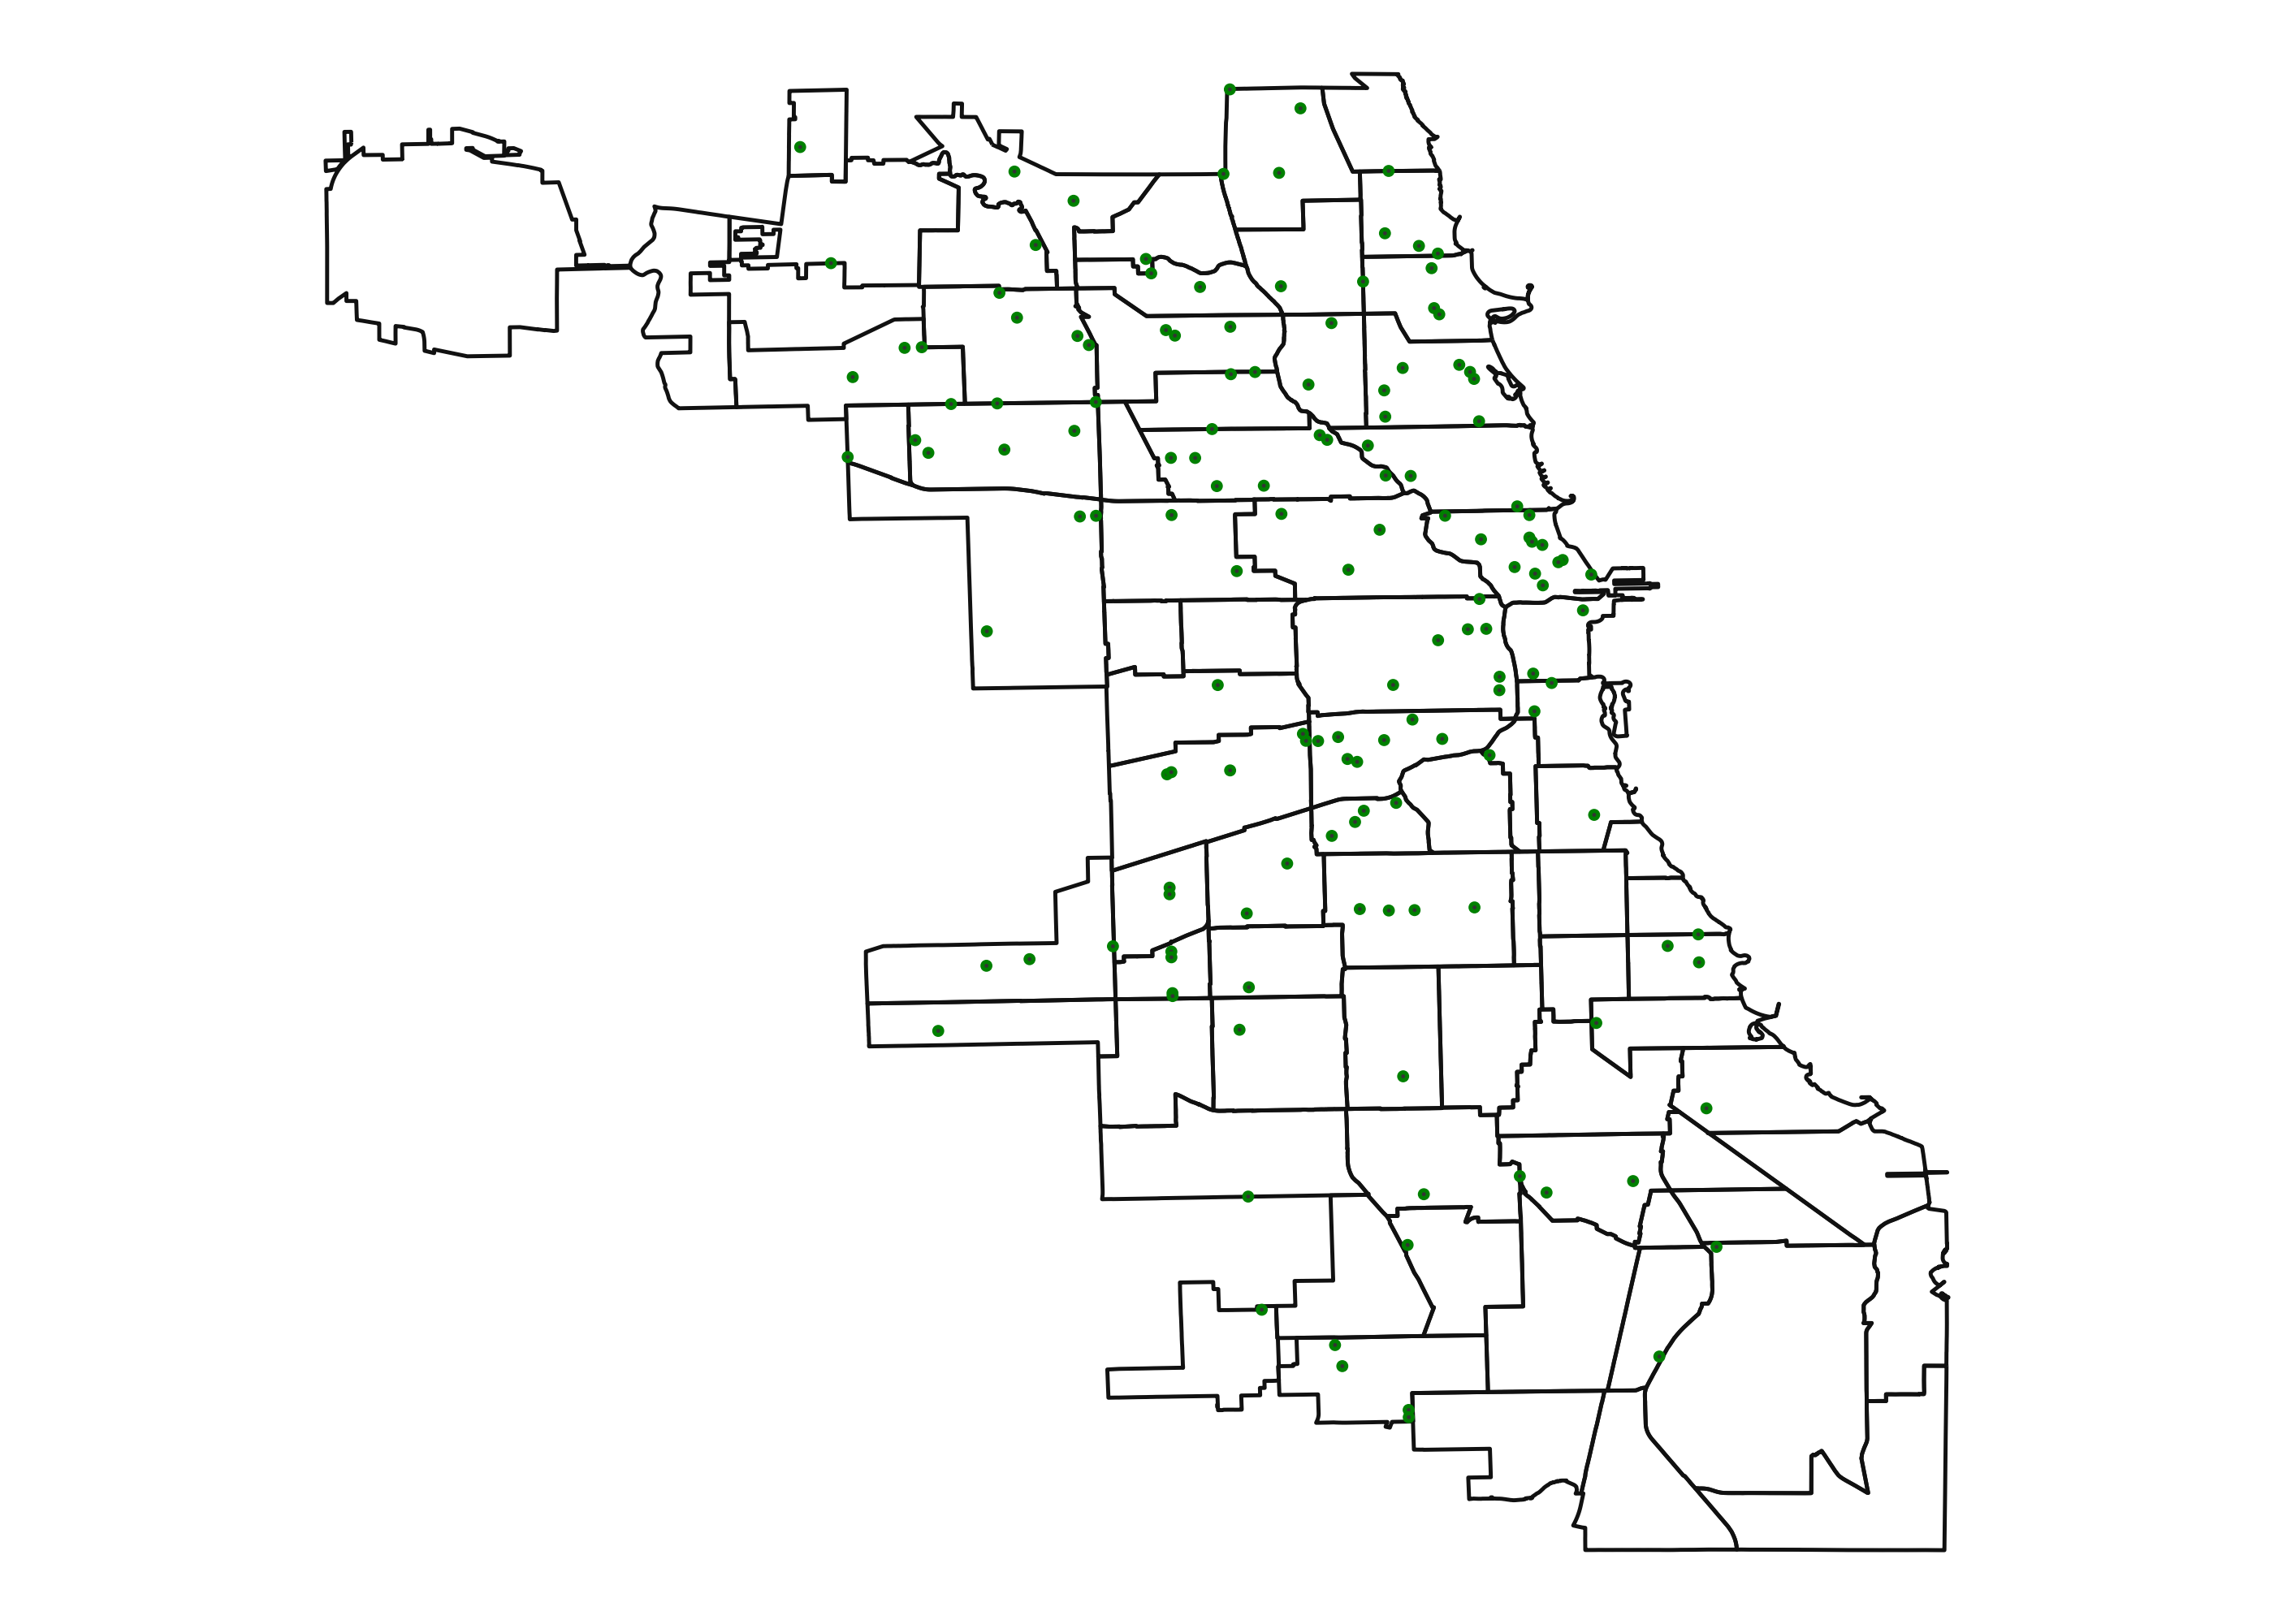
(
    ggplot()
    + geom_map(data=chicago, fill=None)
    + geom_map(data=groceries.to_crs(chicago.crs), color="green")
    + theme_void()
    + coord_fixed()
)