from plotnine import *
from plotnine.data import penguinsSave and display
TipYou will learn
- How to display plots in Jupyter notebooks, Quarto documents, and the console.
- How to save plots to different formats.
- How to change plot size and resolution.
- How to ensure fonts in SVGs are self-contained.
NoteKey points
- Plots should display automatically in Jupyter and Quarto.
- Use the
.show()method to explicitly display a plot (including while in the console). - Use the
.save()method to save a plot to a file. - Plot size and resolution can be set in the
.save()method,theme(), or globally. - The
theme(svg_usefonts=False)argument ensures fonts are self-contained in SVGs.
Setup
Displaying plots
By default, plots in Jupyter and Quarto should be displayed automatically.
For example, this website is built with Quarto, but the code below should also cause a plot to appear in a Jupyter notebook.
p = (
    ggplot(penguins, aes("bill_length_mm", "bill_depth_mm", color="species"))
    + geom_point()
    + labs(
        title="Palmer Penguins Bill Depth vs Length",
        x="Bill length (mm)",
        y="Bill depth (mm)",
    )
)

p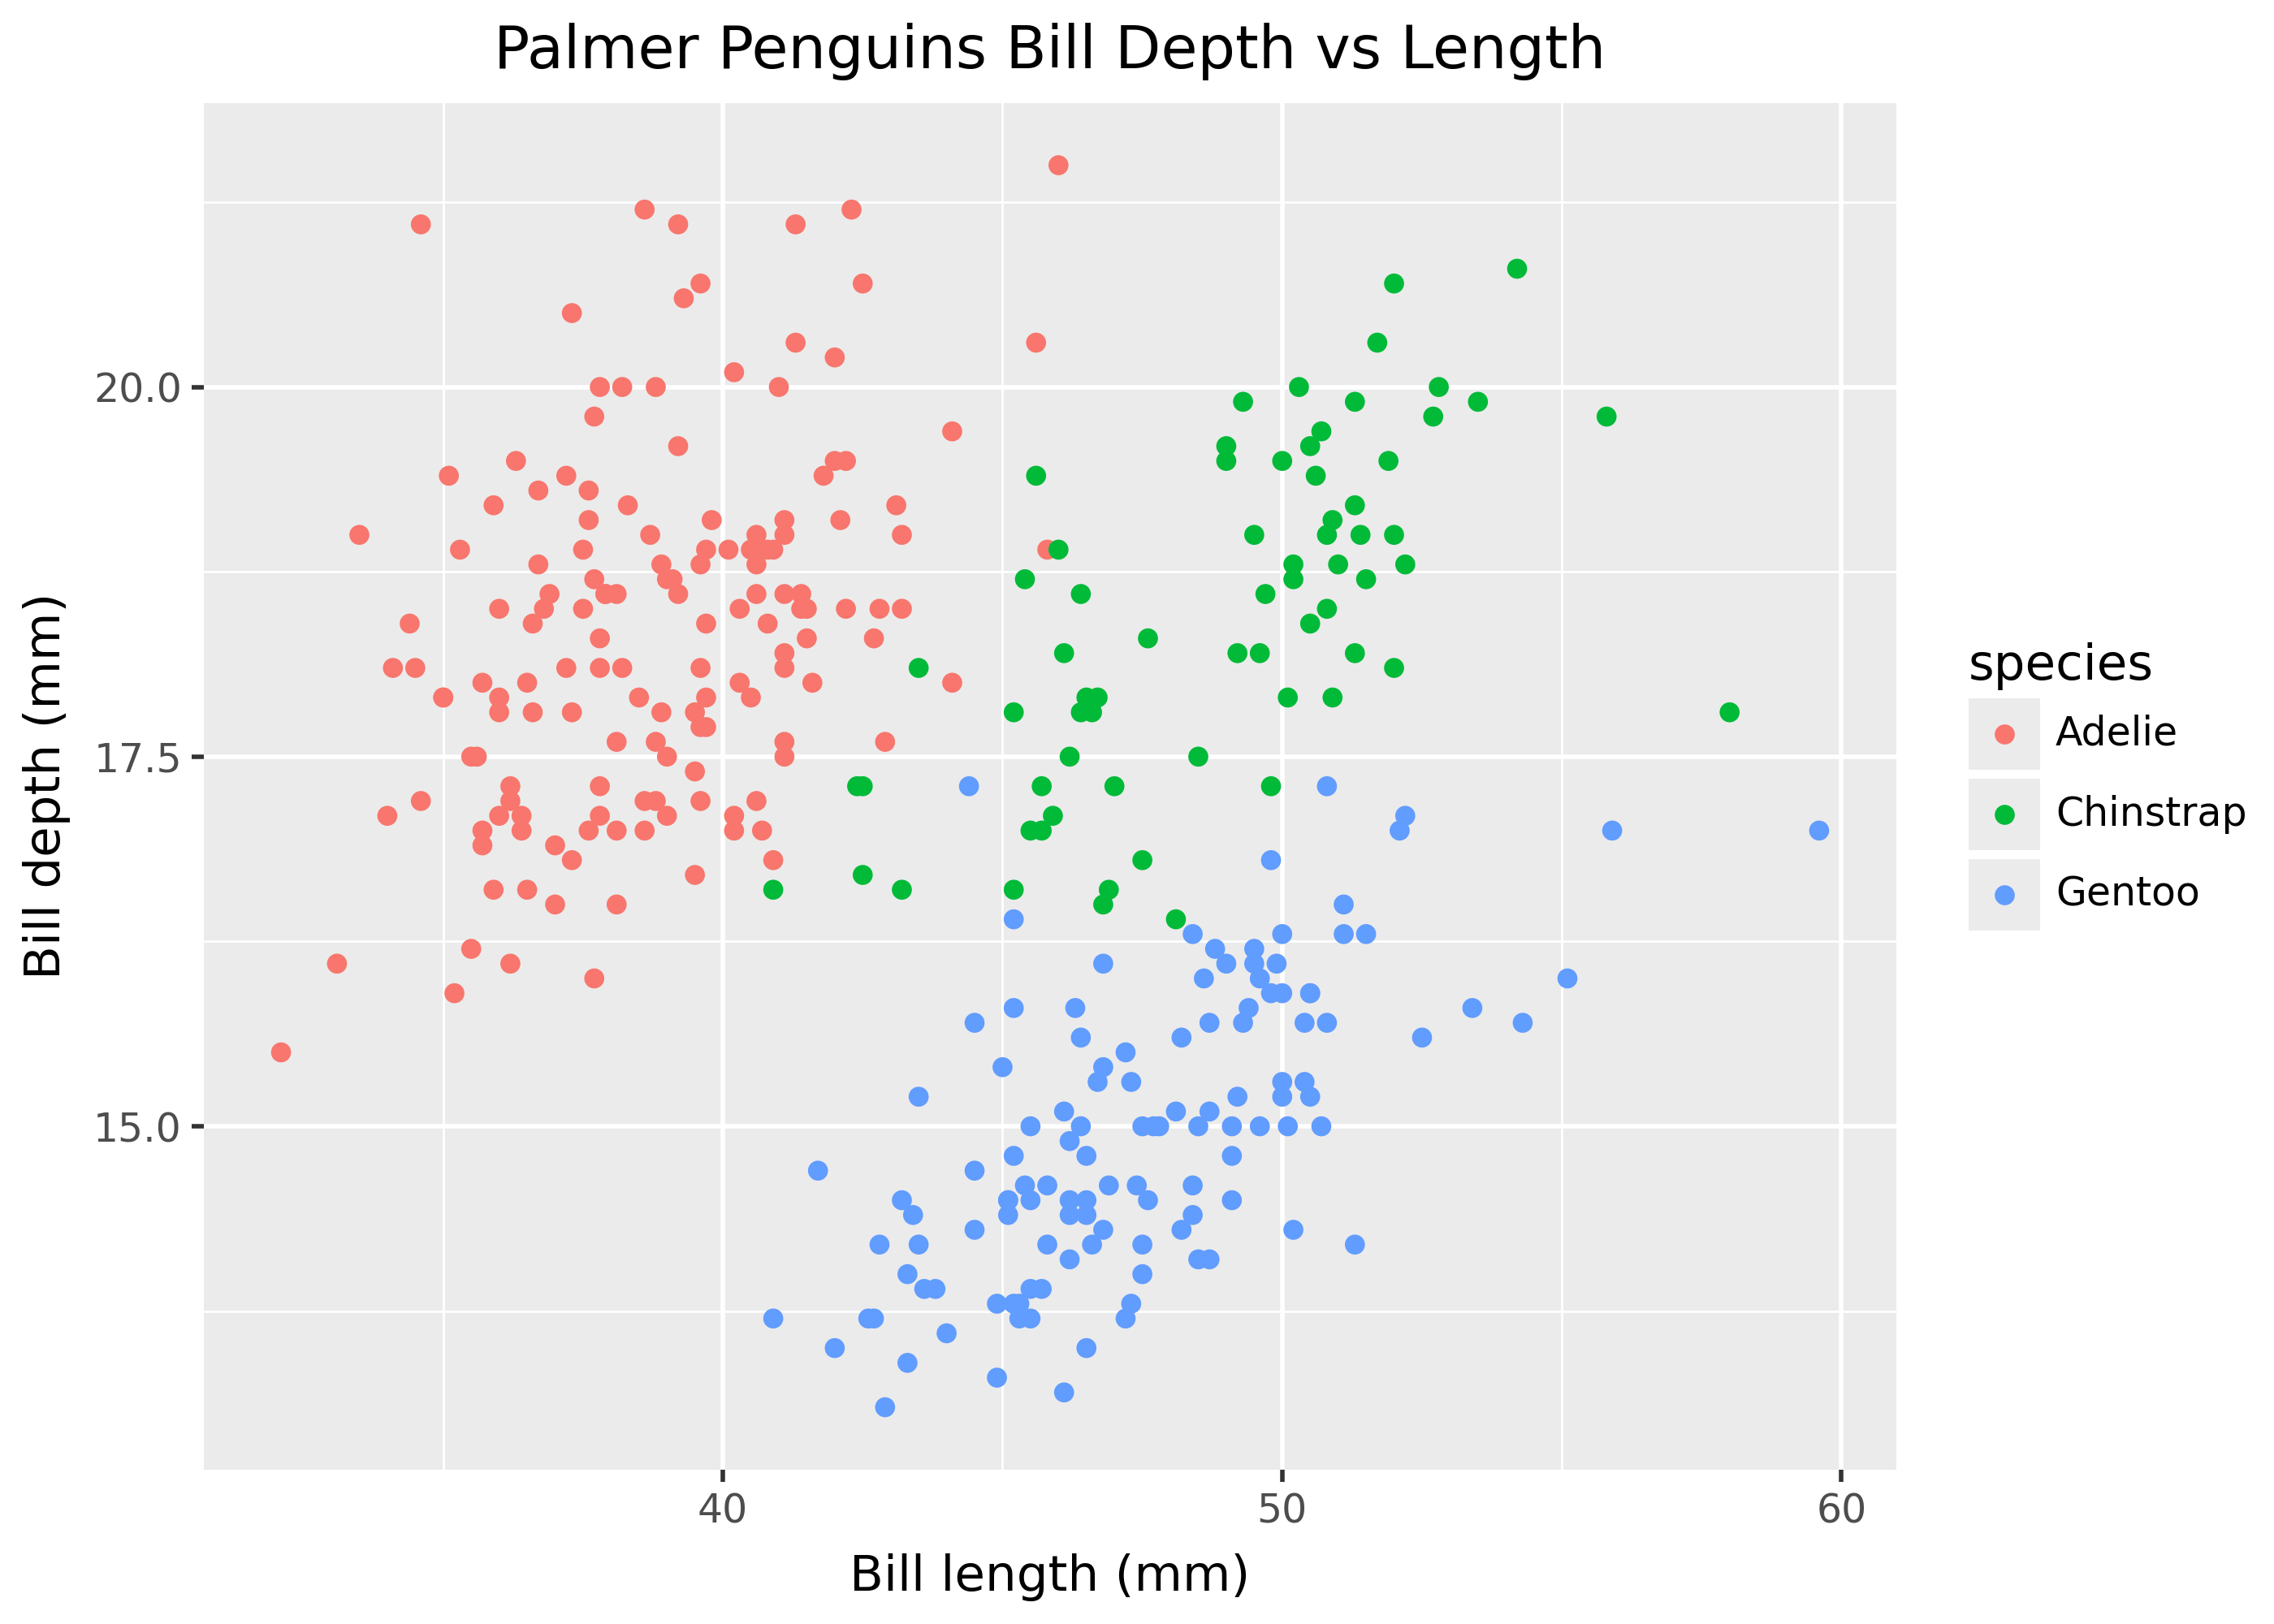
If you want to explicitly display a plot, use the .show() method.
p.show()
Customizing display
See the following documentation pages for customizing plot display:
- Quarto: documentation on computed figures and figure options page.
- Jupyter notebooks: “Integrating your objects with IPython”.
Saving plots
Use the .save() method to save a plot to a file. It takes as its first argument the name of the file to save the plot to.
p.save("my_plot.png")By default, Plotnine tries to infer the file format from its name. For example, in the code above, Plotnine would save the plot in PNG format.
Setting size, resolution, and format
Plotnine supports customizing plot size, resolution, and format in three ways, in order of precedence:
.save()method arguments.theme()settings.plotnine.options.set_option()global options.
p = ggplot(penguins, aes("bill_length_mm", "bill_depth_mm", color="species"))


# Customize in save method ---
p.save("my_plot.png", width=6, height=4, dpi=100)


# Display or save with custom theme ---
my_theme = theme(figure_size=(6, 4), dpi=100)
p + my_theme


# Save using global option ---
from plotnine.options import set_option

set_option("figure_size", (6, 4))

p.save()
Handling fonts in svg
When plots using custom fonts are saved as an SVG, it may not display correctly on computers that do not have the fonts installed. Use the svg_usefonts argument in the theme() function to ensure that fonts are self-contained in the SVG file.
p + theme(svg_usefonts=False)